10-K: Annual report [Section 13 and 15(d), not S-K Item 405]
Published on March 21, 2025
UNITED STATES
SECURITIES AND EXCHANGE COMMISSION
Washington, D.C. 20549
_________________________
FORM 10-K
_________________________
(Mark One)
| ANNUAL REPORT PURSUANT TO SECTION 13 OR 15(d) OF THE SECURITIES EXCHANGE ACT OF 1934 | |||||
For the fiscal year ended December 31 , 2024
OR
| TRANSITION REPORT PURSUANT TO SECTION 13 OR 15(d) OF THE SECURITIES EXCHANGE ACT OF 1934 | |||||
For the transition period from ___________ to ___________
Commission file number 001-42302
_________________________
(Exact name of registrant as specified in its charter)
_________________________
| (State or other jurisdiction of incorporation or organization) | (I.R.S. Employer Identification No.) | ||||
| (Address of Principal Executive Offices) | (Zip Code) | ||||
(703 ) 748-2005
Registrant’s telephone number, including area code
Securities registered pursuant to Section 12(b) of the Act:
| Title of each class | Trading Symbol(s) | Name of each exchange on which registered | ||||||
Indicate by check mark if the registrant is a well-known seasoned issuer, as defined in Rule 405 of the Securities Act.
Yes o No x
Indicate by check mark if the registrant is not required to file reports pursuant to Section 13 or Section 15(d) of the Act.
Yes o No x
Indicate by check mark whether the registrant (1) has filed all reports required to be filed by Section 13 or 15(d) of the Securities Exchange Act of 1934 during the preceding 12 months (or for such shorter period that the registrant was required to file such reports), and (2) has been subject to such filing requirements for the past 90 days.
Indicate by check mark whether the registrant has submitted electronically every Interactive Data File required to be submitted pursuant to Rule 405 of Regulation S-T (§ 232.405 of this chapter) during the preceding 12 months (or for such shorter period that the registrant was required to submit such files).
Indicate by check mark whether the registrant is a large accelerated filer, an accelerated filer, a non-accelerated filer, a smaller reporting company, or an emerging growth company. See the definitions of “large accelerated filer,” “accelerated filer,” “smaller reporting company,” and “emerging growth company” in Rule 12b-2 of the Exchange Act.
| Large accelerated filer | o |
Accelerated filer | o |
|||||||||||
x |
Smaller reporting company | |||||||||||||
| Emerging growth company | ||||||||||||||
If an emerging growth company, indicate by check mark if the registrant has elected not to use the extended transition period for complying with any new or revised financial accounting standards provided pursuant to Section 13(a) of the Exchange Act.
Indicate by check mark whether the registrant has filed a report on and attestation of its management's assessment of the effectiveness of its internal control over financial reporting under Section 404(b) of the Sarbanes-Oxley Act (15 U.S.C. 7262(b)) by the registered public accounting firm that prepared or issued its audit report.
If securities are registered pursuant to Section 12(b) of the Act, indicate by check mark whether the financial statements of the registrant included in the filing reflect the correction of an error to previously issued financial statements.
Indicate by check mark whether any of those error corrections are restatements that required a recovery analysis of incentive based compensation received by any of the registrant’s executive officers during the relevant recovery period pursuant to §240.10D-1(b).
o
Indicate by check mark whether the registrant is a shell company (as defined in Rule 12b-2 of the Act).
Yes o No x
The aggregate market value of the registrant’s voting and non-voting common equity held by non-affiliates of the registrant on December 31, 2024, based on the closing price of $25.07 per share of the registrant’s Class A common stock as reported by The New York Stock Exchange on December 31, 2024, was approximately $75,948,000 . The registrant has elected to use December 31, 2024 as the calculation date, which was the last business day of the registrant’s most recently completed fiscal year, because on June 28, 2024 (the last business day of the registrant’s second fiscal quarter), the registrant was a privately-held company.
As of March 20, 2025, the registrant had outstanding 3,119,317 shares of Class A Common Stock, par value $0.01 per share and 3,442,500 shares of the registrant's Class B Common Stock, par value $0.01 per share.
DOCUMENTS INCORPORATED BY REFERENCE
1
TABLE OF CONTENTS
| Page | |||||
Index of Defined Terms and Acronyms |
|||||
Item 1. Business |
|||||
Item 15. Exhibits and Financial Statement Schedules |
|||||
2
INDEX OF DEFINED TERMS AND ACRONYMS
| ACL | Allowance for Credit Losses | |||||||
| AFS | Available for Sale | |||||||
| AI | Artificial Intelligence | |||||||
| ALCO | Asset Liability Investment Committee of the Board of Directors of Chain Bridge Bank, N.A. | |||||||
| AOCI | Accumulated Other Comprehensive Income (Loss) | |||||||
| ASU | Accounting Standards Update | |||||||
| Bank | Chain Bridge Bank, N.A. | |||||||
| BHC | Bank Holding Company | |||||||
| BHC Act | U.S. Bank Holding Company Act of 1956, as amended | |||||||
| Board or Board of Directors | The Board of Directors of Chain Bridge Bancorp, Inc. | |||||||
| bps | Basis points, defined as one hundredth of one percentage point | |||||||
| Bylaws | Our amended and restated bylaws, which have been adopted by our Board |
|||||||
| Call Report | The Federal Financial Institutions Examination Council (“FFIEC”) Consolidated Reports of Condition and Income, which the Bank files with the FFIEC on a quarterly basis |
|||||||
| CECL |
Current Expected Credit Losses (ASU 2016-13, Financial Instruments-Credit Losses (Topic 326): Measurement of Credit Losses on Financial Instruments)
|
|||||||
| Chain Bridge, CBNA, the Company, we, us, our | Chain Bridge Bancorp, Inc., and its Subsidiaries | |||||||
| Charter | Our amended and restated certificate of incorporation, which became effective on October 3, 2024. The Charter authorizes the establishment of our Class A common stock and Class B common stock and effected the reclassification of each outstanding share of our common stock into 170 shares of Class B common stock |
|||||||
| Class A common stock | Our Class A common stock, par value $0.01 per share |
|||||||
Class B common stock |
Our Class B common stock, par value $0.01 per share |
|||||||
| Common stock | Our Class A common stock and our Class B common stock |
|||||||
| CRE | Commercial real estate | |||||||
| DGCL | Delaware General Corporation Law | |||||||
| EPS | Earnings per share | |||||||
| EVE | Economic value of equity | |||||||
| FASB | Financial Accounting Standard Board | |||||||
| FDIC | Federal Deposit Insurance Corporation | |||||||
| Federal Reserve | Federal Reserve System, the Board of Governors of the Federal Reserve System, or the Federal Reserve Bank of Richmond, Virginia |
|||||||
| FFIEC | Federal Financial Institutions Examination Council | |||||||
Fitzgerald Family |
Collectively, the lineal descendants of Gerald Francis Fitzgerald, deceased, and Marjorie Gosselin Fitzgerald, their spouses or surviving spouses, children, and grandchildren, and the spouses of their children and grandchildren. These persons include, but are not limited to, Peter Gosselin Fitzgerald, Gerald Francis Fitzgerald, Jr., James Gosselin Fitzgerald, Thomas Gosselin Fitzgerald, Julie Fitzgerald Schauer, Thomas Gosselin Fitzgerald, Jr., Andrew James Fitzgerald, and Lauren Fitzgerald Peterson |
|||||||
| GAAP | Generally Accepted Accounting Principles | |||||||
| HTM | Held to Maturity | |||||||
ICS®
|
IntraFi Cash Service®
|
|||||||
| IPO | Initial public offering | |||||||
| N/A | Not Applicable | |||||||
3
| NM | Not Meaningful (Comparisons of positive and negative values or to zero values are considered not meaningful) | |||||||
| OCC | Office of the Comptroller of the Currency | |||||||
| Old common stock | Our common stock, par value $1.00 per share, prior to the Reclassification | |||||||
| Political organizations | Campaign committees; party committees; separate segregated funds (including trade association political action committees (“PACs”) and corporate PACs); non-connected committees (including independent expenditure-only committees (“Super PACs”), committees maintaining separate accounts for direct contributions and independent expenditures (“Hybrid PACs”), and committees other than authorized campaign committees, or those affiliated with such committees that are maintained or controlled by a candidate or federal officeholder (collectively, “Leadership PACs”)); and other tax-exempt organizations under Section 527 of the Internal Revenue Code |
|||||||
| Pre-IPO investors | The holders of our shares of old common stock immediately prior to the Reclassification | |||||||
| Reclassification | The reclassification of each outstanding share of our old common stock into 170 shares of Class B common stock |
|||||||
| Return on average risk-weighted assets | Return on average risk-weighted assets is calculated as net income divided by average risk-weighted assets. Average risk-weighted assets are calculated using the last five quarter ends. | |||||||
| RWA | Risk-weighted assets | |||||||
| SEC | United States Securities and Exchange Commission | |||||||
| Tier 1 capital ratio | Tier 1 capital, which includes Common Equity Tier 1 capital plus non-cumulative perpetual preferred equity that qualifies as additional tier 1 capital, divided by total risk-weighted assets as defined under the U.S. Basel III Standardized approach | |||||||
| Tier 1 leverage ratio | Tier 1 capital, which includes Common Equity Tier 1 capital plus non-cumulative perpetual preferred equity that qualifies as additional tier 1 capital, divided by quarterly adjusted average assets as defined under the U.S. Basel III Standardized approach | |||||||
| Total capital ratio | Total capital, which includes Common Equity Tier 1 capital, tier 1 capital, and allowance for credit losses and qualifying subordinated debt that qualifies as tier 2 capital, divided by total risk-weighted assets as defined under the U.S. Basel III Standardized approach | |||||||
| Transaction accounts | As defined in the instructions for the Call Report | |||||||
4
CAUTIONARY NOTE REGARDING FORWARD-LOOKING STATEMENTS
Unless we state otherwise or the context otherwise requires, “we,” “us,” “our,” “Chain Bridge,” “our Company,” and “the Company,” refer to Chain Bridge Bancorp, Inc., a Delaware corporation, and its consolidated subsidiary, Chain Bridge Bank, National Association. The “Bank” and “Chain Bridge Bank, N.A” refer to Chain Bridge Bank, National Association, a nationally chartered bank.
This Annual Report on Form 10-K contains forward-looking statements, which involve risks and uncertainties. You should not place undue reliance on forward-looking statements because they are subject to numerous uncertainties and factors relating to our operations and business, all of which are difficult to predict and many of which are beyond our control. Forward-looking statements include information concerning our possible or assumed future results of operations, including descriptions of our business strategy. These forward-looking statements are generally identified by the use of forward-looking terminology, including the terms “anticipate,” “believe,” “could,” “estimate,” “expect,” “intend,” “may,” “plan,” “potential,” “predict,” “project,” “should,” “target,” “will,” “would” and, in each case, their negative or other variations or comparable terminology and expressions. All statements other than statements of historical facts contained in this Annual Report on Form 10-K, including statements regarding our strategies, future operations, future financial position, future revenue, projected costs, prospects, plans, objectives of management and expected market growth are forward-looking statements. The forward-looking statements are contained in this Annual Report on Form 10-K include, but are not limited to, statements relating to:
•Changes in trade, monetary and fiscal policies of, and other activities undertaken by, governments, agencies, central banks and similar organizations, including the effects of United States federal government spending;
•The level of, or changes in the level of, interest rates and inflation, including the effects on our net interest income, noninterest income, and the market value of our investment and loan portfolios;
•The level and composition of our deposits, including our ability to attract and retain, and the seasonality of, client deposits, including those in the IntraFi Cash Service (“ICS®”) network, as well as the amount and timing of deposit inflows and outflows into early 2025;
•Our political organization clients’ fundraising and disbursement activities;
•The level and composition of our loan portfolio, including our ability to maintain the credit quality of our loan portfolio;
•Current and future business, economic and market conditions in the United States generally or in the Washington, D.C. metropolitan area in particular;
•The effects of disruptions or instability in the financial system, including as a result of the failure of a financial institution or other participants in it, or geopolitical instability, including war, terrorist attacks, pandemics and man-made and natural disasters;
•The impact of, and changes, in applicable laws, regulations, regulatory expectations and accounting standards and policies;
•Our likelihood of success in, and the impact of, legal, regulatory or other actions, investigations or proceedings related to our business;
•Adverse publicity or reputational harm to us, our senior officers, directors, employees or clients;
•Our ability to effectively execute our growth plans or other initiatives;
•Changes in demand for our products and services;
•Our levels of, and access to, sources of liquidity and capital;
•The ability to attract and retain essential personnel or changes in our essential personnel;
•Our ability to effectively compete with banks, non-bank financial institutions, and financial technology firms and the effects of competition in the financial services industry on our business;
•The effectiveness of our risk management and internal disclosure controls and procedures;
•Any failure or interruption of our information and technology systems, including any components provided by a third party;
•Our ability to identify and address cybersecurity threats and breaches;
5
•Our ability to keep pace with technological changes;
•Our ability to receive dividends from the Bank and satisfy our obligations as they become due;
•The one-time and incremental costs of operating as a public company;
•Our ability to meet our obligations as a public company, including our obligation under Section 404 of Sarbanes-Oxley; and
•The effect of our dual-class structure and the concentrated ownership of our Class B common stock, including beneficial ownership of our shares by the lineal descendants of Gerald Francis Fitzgerald, deceased, and Marjorie Gosselin Fitzgerald, their spouses or surviving spouses, children, and grandchildren, and the spouses of their children and grandchildren (the “Fitzgerald Family”).
You should not rely upon forward-looking statements as predictions of future events. We have based the forward-looking statements contained in this Annual Report on Form 10-K primarily on our current expectations and projections about future events and trends that we believe may affect our business, financial condition, results of operations and prospects. The outcome of the events described in these forward-looking statements is subject to risks, uncertainties and other factors described in the section titled “Risk Factors”. Moreover, we operate in a very competitive and rapidly changing environment. New risks and uncertainties emerge from time to time, and it is not possible for us to predict all risks and uncertainties that could have an impact on the forward-looking statements contained in this Annual Report on Form 10-K. The results, events and circumstances reflected in the forward-looking statements may not be achieved or occur, and actual results, events, or circumstances could differ materially from those described in the forward-looking statements.
The forward-looking statements made in this Annual Report on Form 10-K relate only to events as of the date on which the statements are made. We undertake no obligation to update any forward-looking statements made in this Annual Report on Form 10-K to reflect events or circumstances after the date of this Annual Report on Form 10-K or to reflect new information or the occurrence of unanticipated events, except as required by law. We may not actually achieve the plans, intentions or expectations disclosed in our forward-looking statements and you should not place undue reliance on our forward-looking statements. Our forward-looking statements do not reflect the potential impact of any future acquisitions, mergers, dispositions, joint ventures, or investments we may make.
In addition, statements that “we believe” and similar statements reflect our beliefs and opinions on the relevant subject. These statements are based upon information available to us as of the date of this Annual Report on Form 10-K. And while we believe such information provides a reasonable basis for such statements, such information may be limited or incomplete. Our statements should not be read to indicate that we have conducted an exhaustive inquiry into, or review of, all potentially available relevant information. These statements are inherently uncertain and you are cautioned not to unduly rely upon these statements. Past performance is not a guarantee of future results or returns and no representation or warranty is made regarding future performance.
6
PART I
ITEM 1. BUSINESS
Our Company
Chain Bridge Bancorp, Inc. is a Delaware-chartered bank holding company and the parent of its wholly-owned subsidiary, Chain Bridge Bank, N.A., a nationally chartered commercial bank with fiduciary powers granted by the OCC. The Company was incorporated on May 26, 2006, and the Bank opened on August 6, 2007. The Company conducts substantially all of its operations through the Bank and has no other subsidiaries.
We offer a range of commercial and personal banking services, including deposits, treasury management, payments, loans, commercial lending, residential mortgage financing, consumer loans, trusts and estate administration, wealth management, and asset custody.
Our mission is to deliver exceptional banking and trust services nationwide, blending financial strength, personalized service, and advanced technology to offer tailored solutions to businesses, non-profit organizations, political organizations, individuals, and families. Our vision is to grow responsibly by adapting our personalized service and advanced technology solutions to our clients’ evolving needs while emphasizing liquidity, asset quality, and financial strength. We aim to be recognized for our “Strength, Service, Solutions: Your Bridge to Better Banking Nationwide.”
As of December 31, 2024, we held total assets of $1.4 billion, including $410.7 million in cash and cash equivalents, of which $406.7 million were interest-bearing reserves held at the Federal Reserve. Our portfolio included $659.0 million in securities, with $321.0 million or 48.7% of that in U.S. Treasury securities. Net loans held for investment, after accounting for deferred fees and costs and allowances, totaled $308.8 million. Our total deposits stood at $1.2 billion, with stockholders’ equity at $144.2 million. Approximately 93.3% of these deposits were held in transaction accounts (as such term is defined in the instructions for the Call Report, which the Bank files with the FFIEC on a quarterly basis). Our loan-to-deposit ratio was 25.1%.
Additionally, we hold excess deposits sold one-way to other participating banks through the IntraFi Cash Service® (ICS®). For our clients that opt into the ICS® network, this service allows us to place their deposits in increments up to the FDIC insurance limits at other banks within the ICS® network. In exchange, we may elect to either receive reciprocal deposits from other banks within the ICS® network or place the deposits at other banks as “One-Way Sell®” deposits and receive a deposit placement fee. See “Management’s Discussion and Analysis of Financial Condition and Results of Operations — Financial Condition — Deposits” for more information on ICS® deposits.
Initial Public Offering
On October 4, 2024, the Company’s Class A Common Stock began trading on the NYSE under the symbol “CBNA”. We issued and sold an aggregate of 1,992,897 shares of our Class A Common Stock including 142,897 shares of Class A Common Stock sold pursuant to the underwriters’ partial exercise of their option to purchase additional shares, in our initial public offering, at a public offering price of $22.00 per share for aggregate net proceeds of $36.5 million after deducting underwriting discounts and offering expenses. The initial closing of our initial public offering occurred on October 7, 2024, and the closing for the shares issued pursuant to the underwriters’ option occurred on November 1, 2024. On October 10, 2024, the Company used a portion of the net proceeds to fully repay $10.0 million in short-term borrowings. The IPO had a positive impact on our capital position, and contributed to Tier 1 leverage, Tier 1 risk-based, and total risk-based capital ratios of 11.48%, 38.12% and 39.30%, respectively as of December 31, 2024. The Company intends to use the remainder of net proceeds for general corporate purposes, which may include supporting continued organic deposit growth and funding potential strategic expansion.
Reclassification
In connection with the IPO, on October 3, 2024, the Company filed an Amended and Restated Certificate of Incorporation with the Secretary of State of the State of Delaware, which established two new classes of common stock, the Class A Common Stock and Class B Common Stock, and reclassified and converted each outstanding share of the Company’s existing common stock, par value $1.00 per share, into 170 shares of Class B Common Stock. The Amended and Restated Certificate of Incorporation with the Secretary of State of the State of Delaware also changed the number of authorized shares of Preferred Stock from 100,000 to 10,000,000.
Our Regulatory Framework and Banking Philosophy
Chain Bridge Bank, N.A. operates under a national charter with full fiduciary powers granted by the OCC. Our national charter allows us to offer banking services across state lines without additional state banking licenses. The OCC
7
serves as our primary federal regulator, overseeing our operations and compliance with applicable federal banking laws and regulations. Our national bank fiduciary powers enable us to offer trust services broadly.
Our operations under this regulatory framework reflect a banking philosophy that emphasizes liquidity, asset quality, and financial strength. This approach guides our asset allocation strategy, risk management practices, and deposit gathering efforts.
Balance Sheet Strategy and Composition
Our balance sheet composition reflects our banking philosophy of emphasizing liquidity, asset quality, and financial strength. We aim to allocate a high proportion of our assets to interest-bearing reserves at the Federal Reserve and to securities that we believe qualify as investment grade.
Our asset allocation strategy is designed to balance liquidity maintenance with income generation. We prioritize investments in securities that we believe qualify as investment grade, with a significant portion allocated to U.S. Treasury securities. This approach reflects our focus on managing credit risk while maintaining liquidity. We strive to maintain a low proportion of assets that we consider to be illiquid.
Lending Approach and Credit Risk Management
Our lending policies are designed to manage credit risk. Our approach has historically resulted in what we consider to be low levels of non-performing loans and loan charge-offs. As of December 31, 2024, we have reported no non-performing assets since June 30, 2012. The Company has not reported any loan charge-offs since the third quarter of 2017 and has incurred a cumulative net loan charge-offs of $265 thousand since inception.
Deposit Composition and Strategy
We aim to attract transaction account deposits, particularly from commercial clients. Our investment approach for these funds is intended to be conservative, based on our interpretation of prudent banking practices and current regulatory guidelines.
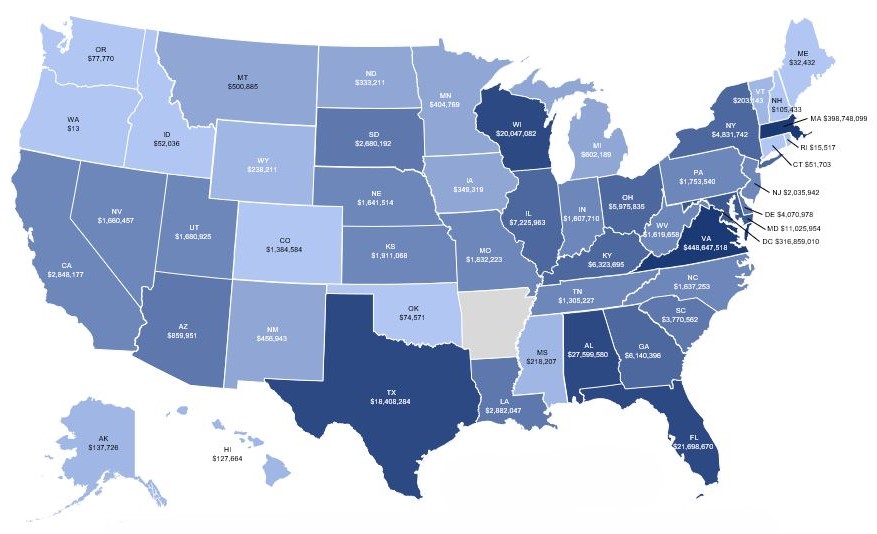
As of December 31, 2024, we served deposit clients in 49 states, the District of Columbia, and Puerto Rico. The following chart shows the distribution of the Bank’s total deposits and One-Way Sell® deposits by dollar amount across the United States as of December 31, 2024:
($ in thousands)
8
To support our strategy of attracting commercial transaction account deposits, we emphasize services designed to attract commercial clients who manage high transaction volumes. These services include digital onboarding solutions, image cash letter (“ICL”) processing and treasury management offerings that accommodate multiple users with customizable approval hierarchies. This focus aligns with our goal of attracting and retaining commercial clients with complex transactional needs.
At December 31, 2024, 93.3% of our total deposits were held in transaction accounts. For the year ended December 31, 2024, our cost of funds was 0.31%.
The composition of our deposit base and the associated cost of funds are consistent with our focus on transaction accounts. Our experience suggests that clients with these types of accounts may interact more frequently with our banking services and relationship officers compared to those with other account types. This interaction may be associated with increased use of our services, which aligns with our approach to client relationships.
Operational Model and Technology Focus
Our model emphasizes attentive, relationship-based service enhanced by technology solutions. This strategy allows the Bank to serve clients efficiently across a wide geographic area while maintaining lower overhead costs compared to some branch-based banking models.
We believe our technology-driven approach allows us to deliver banking services efficiently, with a focus on meeting the needs of commercial clients who manage high transaction volumes and have complex organizational structures. Our treasury management system is designed to handle substantial transaction volumes and accommodate complex organizational structures often found in larger commercial entities. The system features multi-user access with customizable approval hierarchies, allowing clients to tailor the system to their specific operational needs. It also offers integration capabilities with popular accounting software and includes mobile batch check deposit functionality.
Our technology infrastructure is designed to process electronic transactions efficiently, including support for industry-standard formats commonly used for large-scale deposits. This infrastructure is intended to facilitate the handling of significant transaction volumes for our more active commercial clients, including political organizations, in a timely manner. While the technologies we employ are generally available in the banking industry, we believe our approach to implementing and customizing these solutions for specific client needs may distinguish us from many institutions of comparable size. We have developed capabilities in adapting our systems to address the particular requirements of clients with high transaction volumes. This allows us to offer banking solutions that we believe are comparable to those typically associated with larger financial institutions. As payment technologies continue to evolve, we strive to maintain our technological capabilities and adapt our services to meet the changing needs of our diverse commercial client base.
Our business model operates without a traditional branch network. As of December 31, 2024, we provide in-person banking services exclusively from our headquarters and do not operate additional physical banking locations. Based on our experience, we believe many of our clients prefer to conduct their banking transactions electronically through our digital platform, which offers services such as mobile deposit, ACH, wire transfers, and bill payment. This approach allows clients to manage their banking needs from anywhere, reducing the need to visit a physical branch.
We believe our technology-driven approach enables us to provide attentive, personalized service, despite our limited physical footprint. Our relationship officers are required to be directly accessible via phone, email, and video conferencing, which is intended to ensure that we meet the needs of our clients, particularly modern businesses. This service delivery model offers broad geographic reach and the potential for a competitive advantage by combining attentive personal service with the efficiency and convenience of remote access.
By operating without a branch network, we can direct resources toward enhancing our technology infrastructure and expanding our digital services. This approach is intended to provide our clients with secure, efficient, and convenient banking solutions. However, our branch-less business model may limit our ability to expand our retail lending and deposit businesses beyond the Washington, D.C. metropolitan area, where we have a more concentrated presence.
Serving Political Organizations
We focus on clients and business segments where our experience may offer advantages, such as services for political organizations, tailored business, and residential lending and trust and wealth management. Our approach generally favors developing capabilities in less saturated sectors and avoiding highly competitive markets, like commercial real estate or mass-market consumer banking. We have historically grown organically and many of our new business opportunities have come through word-of-mouth referrals. We believe our client-focused approach has contributed to maintaining strong relationships.
9
We estimate that there are points in time when at least a majority of our deposit balances are sourced from political organizations. This estimate is subject to data limitations and identifying a client as a political organization sometimes requires judgment, and the actual number of our deposits represented by political organizations may differ from this estimate. See “Risk Factors — Operational Risks — Our reliance on estimates and risk management activities may not always prevent or mitigate risks effectively, leading to potential differences between actual results and our forecasts.”
We have experience providing deposit services to several different types of political organizations, including:
•Campaign committees
•Party committees (national, state, and local);
•Corporate and trade association political action committees (“PACs”);
•Super PACs and Hybrid PACs;
•Non-committee 527 organizations;
•Leadership PACs;
•Joint fundraising committees; and
•Presidential inaugural committees.
In addition to political organizations, we also provide deposit accounts to a variety of businesses that support the campaigns and elections industry. These businesses include vendors involved in advertising, television advertisement buying, digital marketing, public opinion polling, opposition research firms, general consulting, fundraising, and services related to treasury, legal, and compliance matters.
Seasonality
Certain aspects of our deposits fluctuate seasonally. Most of this seasonality comes from commercial depositors, primarily political organizations and their vendors that generate and spend funds around federal election cycles. Federal elections in the United States occur every two years in the fourth quarter, on the first Tuesday after the first Monday in November. Primary elections for federal offices, determined by the state and political parties, typically occur in the first, second, or third quarter of the year. Historically, our total deposits have gradually increased in quarters leading up to a federal election, followed by a decline around the election. Deposit growth tends to be stronger leading up to presidential elections, which occur every four years, compared to biennial midterm elections.
Consistent with historical trends, we experienced deposit inflows from political organizations preceding the November 2024 federal election, followed by deposit outflows in the months surrounding the election, reflecting seasonal patterns associated with the election cycle. Election outcomes can also influence the timing and magnitude of deposit movements, including post-election inflows driven by new fundraising or account activities. For further details regarding these seasonal fluctuations and their impact on our financial condition, see “Management’s Discussion and Analysis of Financial Condition and Results of Operations.”
Certain types of accounts, such as political party committee accounts, maintain funds throughout the election cycle. Other types of accounts, such as campaign committee accounts, are often established for a single campaign cycle and exhibit greater seasonality. In order to mitigate seasonality risk, we aim to maintain a relatively high level of cash reserve deposits at the Federal Reserve.
Federal election cycles also impact revenue-generating activities, such as wire transfers, payments, check processing, debit card usage, deposit placement through ICS®, and treasury management services, which also increase during this period until the end of the election cycle. Additionally, deposits from trade associations may exhibit seasonality. These associations typically bill their members annually for dues and spend the funds down over the course of the year.
Competition
The banking industry is highly competitive. We compete for loans, deposits, capital and fiduciary services with other banks and other kinds of financial institutions and enterprises, such as securities firms, insurance companies, savings and loan associations, credit unions, mortgage brokers, fintechs, and private lenders, many of which have substantially greater resources or are subject to less stringent regulations. We primarily compete for commercial deposit accounts with the country’s largest banks, which have national reach, and regional banks, some of which also have national reach and advanced technology and treasury management platforms for commercial clients. We also compete with other state, national and international financial institutions located in our market areas, as well as savings associations, savings banks and credit unions for loans and retail deposits. Competition among providers of financial products and services continues to increase, with consumers having the opportunity to select from a growing variety of traditional and nontraditional
10
alternatives, including fintech companies, which have grown significantly in recent years. The ability of non-bank financial institutions to provide services previously limited to commercial banks has intensified competition. See “Risk Factors — Other Risks Related to Our Business — There is no assurance that the Bank will be able to compete successfully with others for its business.”
Our Principal Products, Services and Markets
We offer a range of banking and trust services, including deposits, treasury management, payments, commercial lending, residential loans, mortgage financing, consumer loans, trust and estate administration, and wealth management. While our deposits come from across the United States, the majority of our loans and trust services are concentrated in the Washington, D.C. metropolitan area.
Deposit Services
As of December 31, 2024, transaction account deposit balances made up 93.3% of our total deposits. We provide a variety of commercial and personal deposit services to commercial and individual clients.
Commercial Deposit Services. We offer a suite of deposit accounts designed to meet the needs of businesses:
•Business Checking Accounts: These accounts are designed for startups, sole proprietors, and organizations with limited check-writing and deposit activity, featuring online and mobile banking capabilities.
•Commercial Analysis Checking: These accounts are designed for businesses with high transaction volumes and substantial balances, offering an earnings credit in lieu of interest to offset item processing and service charges.
•Commercial Money Market Accounts: These accounts provide competitive interest rates that increase with higher deposit balances, which is an attractive option for clients managing excess cash reserves.
Personal Banking Services. For individual clients, we offer a variety of checking and savings accounts. These accounts offer online and mobile banking, debit card controls, electronic statements and digital wallet capabilities.
We provide deposit services electronically, which allows us to avoid the costs associated with maintaining a traditional branch network, allowing us to invest more in people and technology and provide our deposit services to clients nationwide. We are also a member of the IntraFi® network of institutions, which allows our deposit clients to enroll in the ICS® program to achieve full FDIC insurance. For a discussion of the ICS® program, see “Management’s Discussion and Analysis of Financial Condition and Results of Operations.” As of December 31, 2024, we held deposits from clients across 49 states, the District of Columbia, and Puerto Rico, with approximately 23.62% of total deposits and One-Way Sell® deposits from the District of Columbia and approximately 33.44% from Virginia.
We have experience in providing deposit services to political organizations. A substantial portion of our deposit business is derived from federal and, to a lesser extent, state political organizations. We have developed a familiarity with the particular banking needs of these entities, many of which are highly regulated under federal or state law, and the compliance professionals who serve them. Our experience in processing transactions for these organizations allows us to offer services designed to meet the needs of our clients in this sector. For example, we serve our deposit clients through experienced relationship officers and seek to offer personal service and tailored solutions for account management, image cash letters, remote deposit capture, payment processing, and treasury management.
Lending
We provide lending services to consumers and commercial borrowers primarily located in the Washington, D.C. metropolitan area. As of December 31, 2024, our loan portfolio consisted of 67.2% in residential real estate loans, 17.1% in commercial real estate loans, 8.9% in commercial loans, and 6.8% in consumer loans, and approximately 83.4% of our loans were to borrowers located in the Washington, D.C. metropolitan area.
Consumer Lending. Our consumer lending primarily consists of residential mortgage financing, with a primary focus on adjustable rate mortgages. Long-term fixed-rate mortgages exceeding fifteen years are generally not retained on our balance sheet. We specialize in non-conforming jumbo mortgages designed for individuals with sophisticated financial profiles and diverse income streams, as well as construction loans for building or renovating a primary residence. As of December 31, 2024, the Bank held 55 non-conforming single-family residential jumbo mortgage loans with an aggregate balance of $98.8 million, representing 46.88% of the Bank’s total single-family residential mortgage portfolio. We also provide co-op financing, a service typically not offered by mass retail lenders.
A portion of our residential mortgage borrowers also maintain consumer deposit accounts with us. We believe this overlap is an important aspect of our strategy to deepen client relationships by offering a broad range of banking services. For certain residential mortgage clients, the ability to access both lending and deposit services within our institution may
11
enhance their overall banking experience and support the development of long-term relationships. Our ability to serve as both a lender and a depository institution for our residential mortgage clients is a component of our service offering.
Commercial Lending. We provide commercial real estate loans and commercial loans to businesses primarily located in the Washington, D.C. area. We also provide commercial real estate loans secured by income-producing properties or owner-occupied properties. We also provide commercial loans to finance a range of business needs, including expansion, equipment purchases and working capital. In the fourth quarter of 2023, we launched our own branded business credit card program, offering both secured and unsecured credit lines, helping us reduce our reliance on third-party product providers. Our secured business credit card provides businesses with a credit line backed by collateral. Our unsecured business credit card offers a line of credit without collateral, suitable for established businesses with strong credit histories. This initiative was designed to meet the needs of our commercial clients. As of December 31, 2024, the outstanding balance on our business credit cards was immaterial.
Many of our commercial borrowers maintain deposit accounts with us as part of their loan agreements, which supports our strategy of offering integrated financial services. However, our depositors and our borrowers are typically distinct client groups. Large depositors generally use their available cash to avoid incurring significant loan balances, while large borrowers tend to have minimal deposits as they focus on repaying their loans.
The deposit accounts maintained by our commercial borrowers tend to be relatively small and transactional in nature, and we believe the loss of these deposits would not materially affect our financial condition. As such, while there may be limited overlap between loan clients and depositors, we do not consider this overlap to be a significant risk to the Bank’s operations or liquidity.
We actively monitor these relationships as part of our broader risk management efforts, but we believe that any overlap in deposit and loan clients is not material and does not pose a material risk to our business.
FEC-Compliant Lending to Political Organizations
Our lending practices for political organizations are designed to comply with the regulations set forth by the FEC. These regulations require that loans to political committees be made on commercially reasonable terms and be secured by collateral owned by the borrower or the political committee itself. These requirements are intended to ensure that loans are legitimate commercial transactions and not improperly structured as contributions to political campaigns.
We occasionally extend loans to candidate committees, though such committees do not frequently borrow from us. When loans are made to candidate committees, they are structured in accordance with FEC regulations, including requiring appropriate collateral to secure the loan and mitigate repayment risks.
In addition to loans, we offer secured credit cards to a range of political committees, including authorized committees, PACs, and party committees. These credit cards are typically secured by cash deposits, which helps ensure compliance with applicable FEC regulations.
Lines of credit may be extended to national party committees. These lines of credit are generally secured by collateral, such as contributor lists, which we arrange to have appraised by independent third-party appraisers to assess whether the value of the collateral is sufficient to cover the loan amounts. In accordance with FEC requirements, the terms offered for loans to political committees are intended to align with those available to non-political clients, with the goal of ensuring that these transactions are conducted on a commercially reasonable basis.
We also provide letters of credit to our commercial borrowers, including political organizations, to assist them in meeting the security deposit requirements for their office leases. These letters of credit are issued in accordance with our standard lending practices and are typically supported by collateral or other security arrangements consistent with commercial lending norms.
Trust and Wealth Management Services
Our Trust & Wealth Department commenced operations in the third quarter of 2020 after the approval by the OCC of the Bank’s application for full fiduciary powers. Our trust offerings serve individuals, families, charitable organizations, and businesses. Our Trust & Wealth Department offers a range of fiduciary services, including:
•Serving as trustee, investment manager with sole or joint discretion, executor, administrator, registrar of stocks and bonds, and guardian of estates, management of hard-to-value assets such as real estate, closely held businesses, mineral interests, loans and notes, life insurance, and tangible assets like collectibles, and offering specialized trusts such as special needs trusts, settlement protection trusts, land trusts, and charitable trusts.
•Providing wealth management services, including investment management, financial planning, and personalized strategies integrating investments, cash flow, risk management, and estate planning.
12
•Providing custodial services for both publicly traded and unique and hard-to-value assets to individual investors, trust administrators, nonprofits, and retirement account holders.
In 2023, we initiated a pilot of the Black Diamond Wealth Platform, which is designed to enhance client experiences by providing a dashboard that integrates information from our trust accounting system and financial planning software. The platform allows clients to access more detailed information about their financial status, such as asset allocation, account activity, portfolio performance, and projected income, for both individual accounts and consolidated portfolios. We have completed the initial rollout of the platform to our current clients, but work continues as we incorporate additional features.
Although we primarily provide trust and wealth management services to clients in the Washington, D.C. area, our national banking charter and fiduciary powers enable us to provide these services in the majority of states, differentiating us from many other financial institutions. However, some states have physical presence requirements for trust services, and the interplay between federal and state regulations in this area continues to evolve. We consider these factors as we serve clients across jurisdictions.
Our Trust & Wealth Department is subject to the supervision, examination and regulation of the OCC, which requires us to adhere to federal regulations and industry standards pertinent to fiduciary activities. In addition, our fiduciary activities are governed by the National Bank Act, which creates a statutory lien for funds our clients hold in trust and custodial accounts, and prohibits the use of trust and custodial assets for the Bank’s business activities.
Risk Management
We believe that effective risk management and control processes are essential to the Bank’s safety and soundness, our ability to address the challenges that we face and, ultimately, our long-term corporate success. Generally speaking, risk is the potential that events, expected or unanticipated, may have an adverse effect on our current or projected earnings or financial condition or on our franchise value. Consistent with the risk assessment system used by the OCC, we evaluate and monitor the following categories of risk:
•Credit risk. Credit risk refers to the risk arising from an obligor’s failure to perform as agreed. See “Management’s Discussion and Analysis of Financial Condition and Results of Operations—Financial Condition—Credit Policies and Procedures” for a discussion of how we seek to manage credit risk.
•Interest rate risk. Interest rate risk refers to the risk arising from movements in interest rates. See “Management’s Discussion and Analysis of Financial Condition and Results of Operations—Interest Rate Sensitivity and Market Risk” for a discussion of how we seek to manage interest rate risk.
•Liquidity risk. Liquidity risk refers to the risk arising from our inability to meet our obligations when they come due. Liquidity risk also includes the risk of being unable to access funding sources or manage funding levels, or failing to recognize or address changes in market conditions that affect our ability to liquidate assets quickly and with minimal loss in value. See “Management’s Discussion and Analysis of Financial Condition and Results of Operations—Liquidity and Capital Management—Liquidity Risk Management” for a discussion of how we seek to manage liquidity risk.
•Price risk. Price risk refers to the risk arising from changes in the value of assets or liabilities accounted for on a mark-to-market basis. To manage price risk, we monitor our investment portfolio and generally attempt to avoid activities that would incur additional price risk, such as market-making, dealing, trading, or otherwise taking positions in futures, foreign exchange, equities, commodities, or other speculative markets.
•Operational risk. Operational risk refers to the risk arising from inadequate or failed internal processes or systems, the misconduct or errors of people or adverse external events. We seek to mitigate operational risks by expanding our operations team and training; working with our vendors to use antifraud protections; establishing security procedures for our clients; and engaging in periodic independent audits of our operations and operating controls. We also seek to mitigate operational risks related to misconduct by employees or contractors by implementing internal controls, including dual authorization for monetary transactions, conducting background and credit checks for new hires, screening contractors and third parties providing critical services using a vendor management process, and offering whistleblower protections to our employees to encourage the reporting of misconduct.
•Compliance risk. Compliance risk refers to the risk arising from violations of, or nonconformance with, laws, rules, regulations, prescribed practices, policies and procedures, or ethical standards. We have implemented a compliance training program for our employees that includes policies, training, monitoring and change management. We engage an outside firm to monitor our compliance functions on a quarterly basis.
•Strategic risk. Strategic risk refers to the risk arising from adverse business decisions, improper implementation of decisions, or lack of responsiveness to changes in the banking industry and operating environment. Our Board is
13
charged with overseeing our corporate strategy, and our Risk Committee oversees strategic risks and the control processes with respect to such risks.
We also seek to monitor our exposure to cyber risk, which generally refers to the risk arising from inadequate or failed information technology systems, vulnerabilities to internal information technology networks, engineered breaches of client information or inadequate information technology policies and procedures. Given the rapidly changing cybersecurity landscape, we evaluate our cyber risk management practices regularly, which may include testing the security of our information technology infrastructure, incident response planning, employee training, engaging third parties to conduct independent reviews and audits, scanning for internal vulnerabilities and adopting measures designed to help our clients stay protected against cybersecurity threats.
Our Board, both directly and through its committees, is responsible for overseeing our risk management processes. In particular, our Risk Committee oversees our enterprise-wide risk management activities, our financial and operational risks (including, without limitation, capital adequacy, compliance, credit, liquidity, market, operational, strategic, asset and reputational risks and the control processes with respect to such risks), and our risk appetite and tolerance. In addition, the Bank’s Information Technology Committee oversees the Bank’s cybersecurity initiatives and strives to ensure that the Bank’s information technology infrastructure aligns with strategic goals while managing related risks, particularly cybersecurity threats. The Information Technology Committee also reviews and updates the Bank’s cybersecurity policies, evaluates information technology controls, and monitors the performance of internal and third-party IT service providers as part of its efforts to enhance the Bank’s defense mechanisms.
Intellectual Property
Our intellectual property is important to the success of our business. We own a variety of trademarks, service marks, trade names, logos and other intellectual property, including the trademarks “Chain Bridge Bank,” “Chain Bridge Bank, N.A.,” “Chain Bridge Bank, N.A. Trust & Wealth,” and “Chain Bridge Bank, N.A. Mortgage,” which we have registered with the United States Patent and Trademark Office. We intend to protect the use of our trademarks and other intellectual property nationwide.
Human Resources
As of December 31, 2024, we employed 84 full-time employees. None of our employees is party to a collective bargaining agreement. We consider our relationship with our employees to be excellent and have not experienced interruptions of operations due to labor disagreements.
Our success depends on our ability to attract, develop and retain qualified professionals. We offer competitive compensation and benefits designed to attract and retain top talent. We offer a short-term cash incentive compensation plan (the “Incentive Compensation Plan”) for which all employees of the Bank as of the end of the fiscal year are eligible. The Incentive Compensation Plan focuses on both financial results and risk management and is designed to incentivize prudent and profitable growth by rewarding participants based on the performance of the Company as a whole, rather than individual achievement, in order to promote teamwork and collaboration among employees. We also administer a long-term cash incentive plan to incentivize and retain key employees of the Bank and encourage participants to contribute to the long-term increase of the Company’s retained earnings.
The Company uses talent development and succession planning to promote leadership continuity and operational stability. We prioritize internal promotion to maintain cultural continuity and minimize leadership transition risks. Management invests in human capital in several specific areas, such as: encouraging participation in leadership and management training programs; providing required annual skills training focusing on areas such banking, finance, technology and regulatory compliance; and supporting continuous professional development by offering educational benefits for employees to gain additional relevant expertise and certifications.
The Company seeks to foster a strong and collaborative workplace culture through regular all-staff meetings led by our CEO that provide ongoing training, discussions on Bank operations and strategic initiatives, employee recognition, and an open forum for questions. We believe our leadership’s commitment to a positive tone at the top cultivates an inclusive and engaged workforce contributing to low staff turnover and encouraging innovation and teamwork across departments. We believe this translates to value added for our clients and shareholders.
Supervision and Regulation
The Company and the Bank are subject to extensive regulation under federal and state law. The following information describes certain aspects of that regulation applicable to the Company and the Bank and does not purport to be complete. The costs of compliance with the regulatory regime and supervisory framework applicable to the Company and the Bank are significant. The level of regulation and oversight over financial services activities, including the regulatory enforcement environment applicable to banks and bank holding companies, has in the past increased, and may in the future
14
increase. The laws, regulations and supervisory guidance applicable to the Company and the Bank are subject to frequent and ongoing change. A change in applicable laws, regulations or policies, or a change in the way such laws, regulations, or policies are interpreted or enforced by regulatory agencies or courts, may have a material impact on the business, operations, and earnings of the Company and the Bank. The likelihood and timing of any future changes, and the effect of such changes on the Company and the Bank, are not determinable at this time with any degree of certainty.
Chain Bridge Bancorp, Inc.
The Company is a bank holding company organized under the laws of Delaware within the meaning of the BHC Act, and is registered as such with the Federal Reserve. As a bank holding company, the Company is subject to supervision, regulation, and examination by the Federal Reserve and is required to file various reports with the Federal Reserve, including FR Y-9SP (Parent Company Only Financial Statements for Small Holding Companies).
Under the BHC Act, a bank holding company may elect to become a financial holding company and thereby engage in a broader range of financial and other activities than are permissible for traditional bank holding companies. The Company has not elected to become a financial holding company and has no immediate plans to become a financial holding company.
Chain Bridge Bank, National Association
The Bank is a national bank chartered under the laws of the United States and is subject to supervision, regulation, periodic examination, enforcement authority and oversight by the OCC, Charter Number 24755, and is required to file Call Reports on a quarterly basis with the FFIEC and various other reports and additional information with the OCC. The OCC has primary supervisory and regulatory authority over the operations of the Bank. The OCC has broad enforcement powers over national banks, such as the Bank, including the power to impose fines and other civil and criminal penalties and to appoint a conservator or receiver if any of a number of conditions are met. In addition to its supervisory and regulatory oversight over banking operations, the OCC also undertakes examinations and supervision of the fiduciary activities of the Bank, as described further under “— Permitted Activities” below.
As the Bank is a member of the FDIC and accepts FDIC-insured deposits from the public, it is subject to additional regulatory oversight by the FDIC. As a result, the Bank is subject to the FDIC’s deposit insurance requirements. The Bank’s FDIC membership is confirmed under Certificate Number 58595.
Depository institutions, including the Bank, are subject to extensive federal regulations that significantly affect their businesses and activities. Regulatory bodies have broad authority to implement standards and initiate proceedings designed to prohibit depository institutions from engaging in unsafe and unsound banking practices. The standards relate generally to operations and management, asset quality, interest rate exposure, and capital. The bank regulatory agencies are authorized to take action against institutions that fail to meet such standards.
As required for national banks, the Bank is a member of the Federal Reserve and has subscribed for stock in the Federal Reserve in an amount equal to 6% of its capital and surplus, of which 3% was paid upon becoming a member of the Federal Reserve and 3% is held in reserve and callable by the Federal Reserve.
The Dodd-Frank Act
The Dodd-Frank Wall Street Reform and Consumer Protection Act of 2010 (the “Dodd-Frank Act”), signed into law in July 2010, significantly restructured the financial regulatory regime in the United States and has had a broad impact on the financial services industry as a result of the significant regulatory and compliance changes required under the act.
The Economic Growth, Regulatory Relief and Consumer Protection Act of 2018 (the “EGRRCPA”), which became effective May 24, 2018, amended the Dodd-Frank Act to provide regulatory relief for certain smaller and regional financial institutions, such as the Company and the Bank. The EGRRCPA, among other things, provides financial institutions with less than $10 billion in total consolidated assets with relief from certain capital requirements. The EGRRCPA also expanded the category of bank holding companies that may rely on the Federal Reserve’s Small Bank Holding Company Policy Statement (the “SBHC Policy Statement”) by raising the maximum amount of consolidated assets a qualifying bank holding company may have from $1 billion to $3 billion. In addition to meeting the asset threshold, a bank holding company must not engage in significant nonbanking activities, not conduct significant off-balance sheet activities, and not have a material amount of debt or equity securities outstanding and registered with the SEC (subject to certain exceptions). The Federal Reserve may, in its discretion, exclude any bank holding company from the application of the SBHC Policy Statement if such action is warranted for supervisory purposes.
Deposit Insurance
The Bank accepts deposits that are insured by the FDIC up to the applicable limits. Under the FDIA, the FDIC may terminate the insurance of an institution’s deposits upon a finding that the institution has engaged in unsafe or unsound
15
practices; is in an unsafe or unsound condition to continue operations; or has violated any applicable law, regulation, rule, order or condition imposed by the FDIC. We do not know of any practice, condition or violation that might lead to termination of deposit insurance at the Bank. The FDIC’s DIF is funded by assessments on insured depository institutions, including the Bank, which are subject to adjustment by the FDIC.
On October 18, 2022, the FDIC adopted a final rule to increase base deposit insurance assessment rate schedules uniformly by two basis points beginning in the first quarterly assessment period of 2023. The increase is being instituted to account for extraordinary growth in insured deposits during the first and second quarters of 2020, which caused a substantial decrease in the “designated reserve ratio” of the DIF to total industry deposits. The FDIC has indicated that the new assessment rate schedules will remain in effect until the DIF reserve ratio meets or exceeds 2%.
Capital Requirements
The Federal Reserve, the OCC, and the FDIC have issued substantially similar capital requirements applicable to all banks and bank holding companies. In addition, those regulatory agencies may from time to time require that a banking organization maintain capital above the minimum levels because of its financial condition or actual or anticipated growth.
As a bank holding company with less than $3 billion in total consolidated assets, the Company is currently treated as a “small bank holding company” under the Federal Reserve’s SBHC Policy Statement and is exempt from the Federal Reserve’s consolidated risk-based capital and leverage rules at the holding company level. Although the Company expects to continue to be treated as “small bank holding company” under the SBHC Policy Statement, the Federal Reserve has significant discretion to determine whether a publicly traded bank holding company (or any bank holding company) may continue to rely on the SBHC Policy Statement. If the Company continues to be treated as a “small bank holding company,” the Company’s capital adequacy will be evaluated at the bank level and on a parent-only basis, and it would not be subject to consolidated capital standards for regulatory purposes. If the Company in the future is advised by the Federal Reserve that it may no longer rely on the SBHC Policy Statement, the Company will become subject to the Federal Reserve’s consolidated capital standards applicable to bank holding companies. The Company believes that it would be able to satisfy the Federal Reserve’s consolidated capital rules.
The Bank is subject to the rules implementing the Basel III capital framework and certain related provisions of the Dodd-Frank Act (the “Basel III Capital Rules”). Under the Basel III Capital Rules, banks must hold a capital conservation buffer above the adequately capitalized risk-based capital ratio of 2.50% for all ratios except the Tier 1 leverage ratio. The Basel III Capital Rules, effective January 1, 2015, require the Bank to comply with the following minimum capital ratios: (i) a ratio of common equity Tier 1 capital to risk-weighted assets of at least 4.50%, plus a 2.50% “capital conservation buffer” (effectively resulting in a minimum ratio of common equity Tier 1 capital to risk-weighted assets of 7.00%); (ii) a ratio of Tier 1 capital to risk-weighted assets of at least 6.00%, plus the 2.50% capital conservation buffer (effectively resulting in a minimum Tier 1 capital ratio of 8.50%); (iii) a ratio of total capital to risk-weighted assets of at least 8.00%, plus the 2.50% capital conservation buffer (effectively resulting in a minimum total capital ratio of 10.50%); and (iv) a leverage ratio of 4.00%, calculated as the ratio of Tier 1 capital to average assets (the “Tier 1 Leverage ratio”). The capital conservation buffer is designed to absorb losses during periods of economic stress. Banking institutions with a ratio of common equity Tier 1 capital to risk-weighted assets above the minimum but below the conservation buffer face constraints on dividends, equity repurchases, and compensation, based on the amount of the shortfall.
With respect to banks, the “prompt corrective action” regulations pursuant to Section 38 of the FDIA require, among other things, that federal bank regulators take “prompt corrective action” with respect to institutions that do not meet minimum capital requirements. For this purpose, the law establishes five capital categories: well capitalized, adequately capitalized, undercapitalized, significantly undercapitalized and critically undercapitalized. At each successive lower capital category, an insured depository institution is subject to more restrictions and prohibitions, including restrictions on growth, restrictions on interest rates paid on deposits, restrictions or prohibitions on payment of dividends, and restrictions on the acceptance of brokered deposits. To be well capitalized under these regulations, a bank must have the following minimum capital ratios: (i) a common equity Tier 1 capital ratio of at least 6.50%; (ii) a Tier 1 capital to risk-weighted assets ratio of at least 8.00%; (iii) a total capital to risk-weighted assets ratio of at least 10.00%; and (iv) a Tier 1 Leverage ratio of at least 5.00%.
In September 2019, the federal banking agencies jointly issued a final rule required by the EGRRCPA that permits qualifying banks and bank holding companies that have less than $10 billion in consolidated assets to elect to be subject to a 9% leverage ratio that would be applied using less complex leverage calculations (commonly referred to as the community bank leverage ratio or “CBLR”). Under the rule, which became effective on January 1, 2020, banks and bank holding companies that opt into the CBLR framework and maintain a CBLR of greater than 9% are not subject to other risk-based and leverage capital requirements under the Basel III Capital Rules and would be deemed to have met the well-capitalized ratio requirements under the “prompt corrective action” framework. The Bank has not opted into the CBLR framework.
16
Enforcement Actions and Receivership
In addition to measures taken under the “prompt corrective action” regulations, insured banks may be subject to potential enforcement actions by the federal banking agencies for unsafe or unsound practices in conducting their businesses or for violations of any law, rule, regulation, or condition imposed in writing by the agency or any written agreement with the agency. Enforcement actions may include the imposition of a conservator or receiver, the issuance of a cease-and-desist order that can be judicially enforced, the termination of insurance of deposits (in the case of a depository institution), the imposition of civil money penalties, the requirement to make restitution payments to clients who have experienced an economic loss due to bank actions, the issuance of directives to increase capital, the issuance of formal and informal agreements, the issuance of removal, and prohibition orders against institution-affiliated parties. The enforcement of such actions through injunctions or restraining orders may be based upon a judicial determination that the agency would be harmed if such equitable relief was not granted.
If the FDIC is appointed the conservator or receiver of the Bank, the FDIC has the power: (1) to transfer any of the Bank’s assets and liabilities to a new obligor without the approval of the Bank’s creditors; (2) to enforce the terms of the Bank’s contracts pursuant to their terms; or (3) to repudiate or disaffirm any contract or lease to which the Bank is a party, the performance of which is determined by the FDIC to be burdensome and the disaffirmation or repudiation of which is determined by the FDIC to promote the orderly administration of the Bank. In addition, the claims of holders of U.S. deposit liabilities and certain claims for administrative expenses of the FDIC against the Bank would be afforded priority over other general unsecured claims against the Bank, including claims of debt holders and depositors in non-U.S. offices, in the liquidation or other resolution of the Bank. As a result, whether or not the FDIC ever sought to repudiate any debt obligations of the Bank, the debt holders and depositors in non-U.S. offices would be treated differently from, and could receive substantially less, if anything, than the depositors in the U.S. offices of the Bank.
Dividends
The Company’s ability to pay dividends or repurchase shares of its common stock is subject to restrictions set forth in the DGCL. The DGCL provides that a Delaware corporation may pay dividends or repurchase its shares either (i) out of the corporation’s surplus (as defined by Delaware law) or (ii) if there is no surplus, out of the corporation’s net profits for the fiscal year in which the dividend is declared and/or the preceding fiscal year. It is the Federal Reserve’s policy, however, that bank holding companies should generally pay dividends on common stock only out of income available over the previous four quarters, and only if prospective earnings retention is consistent with the organization’s expected future needs and financial condition. Federal Reserve policy requires that a bank holding company must notify the Federal Reserve if its dividends or repurchase or redemption of shares would cause a net reduction in the amount of such capital instrument outstanding at the beginning of the quarter in which the redemption or repurchase occurs. It is also the Federal Reserve’s policy that bank holding companies should not maintain dividend levels or repurchase shares in amounts that would undermine their ability to be a source of strength to their banking subsidiaries. The Federal Reserve also discourages dividend payment ratios that are at maximum allowable levels unless both asset quality and capital are very strong. In addition, if the Company does not maintain an adequate capital conservation buffer under the Basel III Capital Rules, its ability to pay dividends to or repurchase shares from stockholders may be restricted.
The Bank is a legal entity that is separate and distinct from the Company. The Company’s principal source of cash flow is dividends it receives from the Bank. Statutory and regulatory limitations apply to the Bank’s payment of dividends to the Company. As a general rule, the amount of a dividend may not exceed, without prior regulatory approval, the sum of net income in the calendar year to date and the retained net earnings of the immediately preceding two calendar years. A depository institution may not pay any dividend if payment would cause the institution to become “undercapitalized” or if it already is “undercapitalized.” The OCC may prevent the payment of a dividend if it determines that the payment would be an unsafe and unsound banking practice. The OCC also has advised that a national bank should generally pay dividends only out of current operating earnings.
Permitted Activities
As a bank holding company, the Company is limited generally to managing or controlling banks, furnishing services to or performing services for its subsidiaries, and engaging in other activities that the Federal Reserve determines by regulation or order to be so closely related to banking or managing or controlling banks as to be a proper incident thereto. Other than its ownership and management of the Bank, the Company does not engage in any other material business.
The Bank is authorized to engage in activities permissible for national banks under federal law. On March 5, 2020, the OCC granted the Bank separate authorization to perform fiduciary activities. The Bank initiated these activities on September 18, 2020 with the opening of its Trust & Wealth Department. The Bank is authorized to perform a range of fiduciary services, including serving as trustee, investment manager with sole or joint discretion, executor, administrator, registrar of stocks and bonds, and guardian of estates. Some states have physical presence requirements for trust services,
17
and the interplay between federal and state regulations in this area continues to evolve. The Bank’s fiduciary activities are subject to the supervision, examination and regulation of the OCC, which, among other things, requires adherence to conflict of interest rules, rigorous record-keeping requirements, and regular audits and internal controls to maintain the integrity of fiduciary activities.
Banking Acquisitions; Changes in Control
The BHC Act requires, among other things, the prior approval of the Federal Reserve in any case where a bank holding company proposes to (i) acquire direct or indirect ownership or control of more than 5% of the outstanding voting stock of any bank or bank holding company (unless it already owns a majority of such voting shares), (ii) acquire all or substantially all of the assets of another bank or bank holding company, or (iii) merge or consolidate with any other bank holding company. In determining whether to approve a proposed bank acquisition, the Federal Reserve will consider, among other factors, the effect of the acquisition on competition, the effect of the transaction on the convenience and needs of the community to be served, and the projected capital ratios and levels on a post-acquisition basis, as well as the acquiring institution’s performance under the CRA and its compliance with fair housing and other consumer protection laws.
In addition, Section 18(c) of the FDIA, commonly known as the “Bank Merger Act,” requires the prior written approval of the OCC before any national bank may (i) merge or consolidate with, (ii) purchase or otherwise acquire the assets of or (iii) assume the deposit liabilities of another bank if the resulting institution is to be a national bank. In determining whether to approve a proposed merger transaction, the OCC must consider the effect on competition, the financial and managerial resources and future prospects of the existing and resulting institutions, the convenience and needs of the communities to be served, and the effectiveness of each insured depository institution involved in the proposed merger transaction in combating money-laundering activities.
In acting on any application by a banking organization to make an investment or acquisition subject to its approval, federal banking regulators have substantial discretion in whether or not to grant any approval or non-objection. If the Company or the Bank were to fail to meet certain regulatory criteria or expectations, it could have a material negative effect on the Company’s or the Bank’s ability to obtain the approvals and non-objections necessary to engage in investments or acquisitions.
Subject to certain exceptions, the BHC Act and the CIBC Act, together with their applicable regulations, require Federal Reserve approval (or, depending on the circumstances, no notice of disapproval) prior to any person or company acquiring “control” of a bank or bank holding company. A conclusive presumption of control exists if an individual or company acquires the power, directly or indirectly (including, in the case of the Bank, through Chain Bridge), to direct the management or policies of an insured depository institution or to vote twenty-five percent (25%) or more of any class of voting securities (including, in the case of Chain Bridge, the Class A common stock) of any insured depository institution. A rebuttable presumption of control exists if a person or company acquires ten percent (10%) or more but less than twenty-five percent (25%) of any class of voting securities (including, in the case of Chain Bridge, the Class A common stock) of an insured depository institution and either the institution has registered its securities with the SEC under Section 12 of the Securities Exchange Act of 1934, as amended (the “Exchange Act”), or no other person will own a greater percentage of that class of voting securities immediately after the acquisition.
Source of Strength
Federal Reserve policy has historically required bank holding companies to act as a source of financial and managerial strength to their subsidiary banks. The Dodd-Frank Act codified this policy as a statutory requirement. Under this requirement, the Company is expected to commit resources to support the Bank, including at times when the Company may not be in a financial position to provide such resources. Any capital loans by a bank holding company to any of its subsidiary banks are subordinate in right of payment to depositors and to certain other indebtedness of such subsidiary banks. In the event of a bank holding company’s bankruptcy, any commitment by the bank holding company to a federal bank regulatory agency to maintain the capital of a subsidiary bank will be assumed by the bankruptcy trustee and entitled to priority of payment.
The Federal Deposit Insurance Corporation Improvement Act
Under FDICIA, the federal bank regulatory agencies possess broad powers to take prompt corrective action to resolve problems of insured depository institutions. The extent of these powers depends upon whether the institution is “well capitalized,” “adequately capitalized,” “undercapitalized,” “significantly undercapitalized,” or “critically undercapitalized,” as defined by FDICIA.
As required by FDICIA, the federal bank regulatory agencies also have adopted Interagency Guidelines Prescribing Safety and Soundness Standards relating to, among other things, internal controls and information systems, internal audit
18
activities, loan documentation, credit underwriting, and interest rate exposure. In general, the guidelines require appropriate systems and practices to identify and manage the risks and exposures specified in the guidelines. In addition, the agencies adopted regulations that authorize, but do not require, an institution that has been notified that it is not in compliance with safety and soundness standards to submit a compliance plan. If, after being so notified, an institution fails to submit an acceptable compliance plan, the agency must issue an order directing action to correct the deficiency and may issue an order directing other actions of the types to which an undercapitalized institution is subject under the prompt corrective action provisions described above.
Transactions with Affiliates
Sections 23A and 23B of the Federal Reserve Act and Regulation W establish certain quantitative limits and other requirements for loans, purchases of assets, and certain other transactions between the Bank and its “affiliates,” including the Company. Among other requirements, loans or extensions of credit to, or other covered transactions with, an affiliate, to the extent permitted, must be on terms and conditions that are substantially the same, or at least as favorable to the Bank, as those prevailing for comparable nonaffiliated transactions.
Loans to executive officers, directors, or any person who, directly or indirectly, or acting through or in concert with one or more persons, owns, controls or has the power to vote more than 10% of any class of voting securities of a bank and their related interests, are subject to Sections 22(g) and 22(h) of the Federal Reserve Act and their corresponding regulation (Regulation O). Among other things, these loans must be made on terms (including interest rates charged and collateral required) substantially the same as those offered to unaffiliated individuals or be made as part of a benefit or compensation program and on terms widely available to employees, and must not involve a greater than normal risk of repayment. In addition, the amount of loans a bank may make to these persons is subject to both quantitative limits and procedural requirements.
Consumer Financial Protection
The Company is subject to a number of federal and state consumer protection laws that extensively govern its relationship with its clients. These laws include the ECOA, the Fair Credit Reporting Act, the Truth in Lending Act, the Truth in Savings Act, the Electronic Fund Transfer Act, the Expedited Funds Availability Act, the Home Mortgage Disclosure Act, the FHA, the Real Estate Settlement Procedures Act, the Fair Debt Collection Practices Act, the Service Members Civil Relief Act, laws governing flood insurance, federal and state laws prohibiting unfair and deceptive business practices, foreclosure laws, and various regulations that implement some or all of the foregoing. These laws and regulations mandate certain disclosure requirements and regulate the manner in which financial institutions must deal with clients when taking deposits, making loans, collecting loans, and providing other services. For example, mortgage lenders are required to make a reasonable and good faith determination based on verified and documented information that a consumer applying for a mortgage loan has a reasonable ability to repay the loan according to its terms, either by considering underwriting factors prescribed by Regulation Z or by originating loans that meet the definition of a “qualified mortgage.” If the Company fails to comply with these laws and regulations, it may be subject to various penalties. Failure to comply with consumer protection requirements may also result in failure to obtain any required bank regulatory approval for merger or acquisition transactions or in being prohibited from engaging in such transactions even if approval is not required.
The Dodd-Frank Act centralized responsibility for consumer financial protection by creating a new agency, the CFPB, and giving it responsibility for implementing, examining, and enforcing compliance with federal consumer protection laws for financial institutions, as well as their affiliates, with more than $10 billion of assets and, to a lesser extent, smaller institutions. The CFPB focuses on (i) risks to consumers and compliance with the federal consumer financial laws, (ii) the markets in which firms operate and risks to consumers posed by activities in those markets, (iii) depository institutions that offer a wide variety of consumer financial products and services, and (iv) non-depository companies that offer one or more consumer financial products or services. The CFPB has broad rule-making authority for a wide range of consumer financial laws that apply to all banks, including, among other things, the authority to prohibit “unfair, deceptive or abusive” acts and practices. Abusive acts or practices are defined as those that materially interfere with a consumer’s ability to understand a term or condition of a consumer financial product or service or that take unreasonable advantage of a consumer’s (i) lack of financial savvy, (ii) inability to protect himself in the selection or use of consumer financial products or services, or (iii) reasonable reliance on a covered entity to act in the consumer’s interests. The CFPB can issue cease-and-desist orders against banks and other entities that violate consumer financial laws. The CFPB may also institute a civil action against an entity in violation of federal consumer financial law in order to impose a civil penalty or injunction.
Because the Company and the Bank have less than $10 billion in assets, most consumer protection aspects of the Dodd-Frank Act will continue to be applied to the Company by the Federal Reserve and to the Bank by the OCC. However, the CFPB may include its own examiners in regulatory examinations by a smaller institution’s principal
19
regulators and may require smaller institutions to comply with certain CFPB reporting requirements. In addition, regulatory positions taken by the CFPB and administrative and legal precedents established by CFPB enforcement activities, including in connection with supervision of larger bank holding companies and banks, could influence how the Federal Reserve and OCC apply consumer protection laws and regulations to financial institutions that are not directly supervised by the CFPB. The precise effect of the CFPB’s consumer protection activities on the Company and the Bank cannot be determined with certainty.
Community Reinvestment Act
The CRA requires the appropriate federal banking agency, in connection with its examination of a bank, to assess the bank’s record in meeting the credit needs of the communities served by the bank, including low- and moderate-income neighborhoods. Furthermore, such assessment is also required of banks that have applied, among other things, to merge or consolidate with or acquire the assets or assume the liabilities of an insured depository institution, or to open or relocate a branch. In the case of a bank holding company applying for approval to acquire a bank or bank holding company, the record of each subsidiary bank of the applicant bank holding company is subject to assessment in considering the application. Under the CRA, institutions are assigned a rating of “outstanding,” “satisfactory,” “needs to improve,” or “substantial non-compliance.” The Bank was rated “outstanding” in its most recent CRA evaluation received on December 6, 2021.
On October 24, 2023, the federal bank regulatory agencies issued a final rule to modernize their respective CRA regulations. The revised rules substantially alter the methodology for assessing compliance with the CRA, with material aspects taking effect January 1, 2026 and revised data-reporting requirements taking effect January 1, 2027. The final rule is currently enjoined while a federal court considers a lawsuit challenging the rule. Among other things, the revised rules evaluate lending outside traditional assessment areas generated by the growth of non-branch delivery systems, such as online and mobile banking, apply a metrics-based benchmarking approach to assessment, and clarify eligible CRA activities. The final rules, if implemented, would likely make it more challenging or costly for the Bank to maintain its current rating of “outstanding” or receive a rating of at least “satisfactory” on its CRA evaluation. See “Risk Factors — Legal, Regulatory and Compliance Risks — The Bank is subject to numerous ‘fair and responsible banking’ laws and regulations designed to protect consumers, which increase our compliance costs and subject us to potential legal liability or reputational damage.”
Anti-Money Laundering Legislation
The Company is subject to several federal laws that are designed to combat money laundering, terrorist financing, and transactions with persons, companies or foreign governments designated by U.S. authorities (the “AML laws”). This category of laws includes the Bank Secrecy Act of 1970, the Money Laundering Control Act of 1986, the USA PATRIOT Act of 2001, and the Anti-Money Laundering Act of 2020.
The AML laws and their implementing regulations require insured depository institutions, broker-dealers, and certain other financial institutions to have policies, procedures, and controls to detect, prevent, and report potential money laundering and terrorist financing. The AML laws and their regulations also provide for information sharing, subject to conditions, between federal law enforcement agencies and financial institutions, as well as among financial institutions, for counter-terrorism purposes. Federal banking regulators are required, when reviewing bank holding company acquisition and bank merger applications, to take into account the effectiveness of the anti-money laundering activities of the applicants.
Office of Foreign Assets Control
The U.S. Treasury Department’s Office of Foreign Assets Control (“OFAC”) is responsible for administering and enforcing economic and trade sanctions against specified foreign parties, including countries and regimes, foreign individuals, and other foreign organizations and entities. OFAC publishes lists of prohibited parties that are regularly consulted by the Company in the conduct of its business in order to assure its compliance. The Company is responsible for, among other things, blocking the accounts of, and transactions with, prohibited parties identified by OFAC, avoiding unlicensed trade and financial transactions with such parties, and reporting blocked transactions after their occurrence. Failure to comply with OFAC requirements could have serious legal, financial, and reputational consequences for the Company.
Privacy Legislation
Several recent laws, including the Right to Financial Privacy Act of 1978, and related regulations issued by the federal bank regulatory agencies also provide new protections against the transfer and use of customer information by financial institutions. A financial institution must provide to its customers information regarding its policies and procedures with respect to the handling of customers’ personal information. Each institution must conduct an internal risk assessment
20
of its ability to protect customer information. These privacy provisions generally prohibit a financial institution from providing a customer’s personal financial information to unaffiliated parties without prior notice to and approval from the customer.
In October 2024, the CFPB adopted a rule that requires a provider of payment accounts or products, such as the Bank, to make certain data available to consumers upon request regarding the products or services they obtain from the provider. The proposed rule is intended to give consumers control over their financial data, including with whom it is shared, and encourage competition in the provision of consumer financial products and services. For banks with over $850 million and less than $1.5 billion in total assets, such as the Bank, compliance with the rule is required by April 1, 2030.
Incentive Compensation
In June 2010, the federal bank regulatory agencies issued final Interagency Guidance on Sound Incentive Compensation Policies intended to ensure that the incentive compensation policies of financial institutions do not undermine the safety and soundness of such institutions by encouraging excessive risk-taking. The Interagency Guidance on Sound Incentive Compensation Policies is based upon the key principles that a financial institution’s incentive compensation arrangements should (i) provide incentives that do not encourage risk-taking beyond the institution’s ability to effectively identify and manage risks, (ii) be compatible with effective internal controls and risk management, and (iii) be supported by strong corporate governance, including active and effective oversight by the financial institution’s board of directors.
The Dodd-Frank Act requires the federal banking agencies and the SEC to adopt rules on incentive-based payment arrangements at specified regulated entities, including banks, having at least $1 billion in total assets. The federal banking agencies issued such proposed rules in March 2011 and issued a revised proposed rule in June 2016.
The Federal Reserve reviews, as part of the regular risk-focused examination process, the incentive compensation arrangements of financial institutions, such as the Company, that are not “large complex banking organizations.” These reviews are tailored to each financial institution based on the scope and complexity of the institution’s activities and the prevalence of incentive compensation arrangements. The findings of the supervisory initiatives are included in reports of examination. Deficiencies are incorporated into the institution’s supervisory ratings, which can affect the institution’s ability to make acquisitions and take other actions. Enforcement actions may be taken against a financial institution if its incentive compensation arrangements, or related risk management control or governance processes, pose a risk to the institution’s safety and soundness and the financial institution is not taking prompt and effective measures to correct the deficiencies.
In accordance with an SEC rule, securities exchanges have adopted rules mandating, in the case of a restatement, the recovery or “clawback” of excess incentive-based compensation paid to current or former executive officers and requiring listed issuers to disclose any recovery analysis where recovery is triggered by a restatement.
Ability-to-Repay and Qualified Mortgage Rule
Pursuant to the Dodd-Frank Act, the CFPB issued a final rule, effective in January 2014, amending Regulation Z as implemented by the Truth in Lending Act, requiring mortgage lenders to make a reasonable and good faith determination based on verified and documented information that a consumer applying for a mortgage loan has a reasonable ability to repay the loan according to its terms. Mortgage lenders are required to determine consumers’ ability to repay in one of two ways. The first alternative requires the mortgage lender to consider eight specified underwriting factors when making the credit decision. Alternatively, the mortgage lender can originate “qualified mortgages,” which are entitled to a presumption that the creditor making the loan satisfies the ability-to-repay requirements. In general, a “qualified mortgage” is a mortgage loan without negative amortization, interest-only payments, balloon payments, or a term exceeding 30 years and must meet certain price-based thresholds, and the points and fees paid by a consumer cannot exceed 3% of the total loan amount. Qualified mortgages that are “higher priced” (e.g., subprime loans) garner a rebuttable presumption of compliance with the ability-to-repay rules, while qualified mortgages that are not “higher priced” (e.g., prime loans) are given a safe harbor of compliance. The Bank is predominantly an originator of compliant qualified mortgages.
Cybersecurity
In March 2015, federal regulators issued two related statements regarding cybersecurity. One statement indicates that financial institutions should design multiple layers of security controls to establish lines of defense and to ensure that their risk management processes also address the risk posed by compromised customer credentials, including security measures to reliably authenticate customers accessing the internet-based services of the financial institution. The other statement indicates that a financial institution’s management is expected to maintain sufficient business-continuity-planning processes to ensure the rapid recovery, resumption, and maintenance of the institution’s operations after a cyberattack involving destructive malware. A financial institution is also expected to develop appropriate processes to enable recovery
21
of data and business operations and to address rebuilding network capabilities and restoring data if the institution or its critical service providers fall victim to this type of cyberattack. If the Company fails to observe the regulatory guidance, it could be subject to various regulatory sanctions, including financial penalties.
Effective April 1, 2022, the OCC, the Federal Reserve, and the FDIC issued a joint rule imposing upon banking organizations and their service providers notification requirements for significant cybersecurity incidents. Specifically, the rule requires banking organizations to notify their primary federal regulator as soon as possible and no later than 36 hours after the discovery of a “computer-security incident” that rises to the level of a “notification incident” as those terms are defined in the rule. Banks’ service providers are required under that rule to notify any affected bank to or on behalf of which the service provider provides services “as soon as possible” after determining that it has experienced an incident that materially disrupts or degrades, or is reasonably likely to materially disrupt or degrade, covered services provided to such bank for as much as four hours.
Additionally, effective December 9, 2022, amendments to the Gramm-Leach-Bliley Act of 1999 Safeguards Rule went into effect. That rule requires financial institutions to: (i) appoint a qualified individual to oversee and implement their information security programs; (ii) implement additional criteria for information security risk assessments; (iii) implement safeguards identified by assessments, including access controls, data inventory, data disposal, change management, and monitoring, among other things; (iv) implement information system monitoring in the form of either “continuous monitoring” or “periodic penetration testing”; and (v) implement additional controls, including training for security personnel, periodic assessment of service providers, written incident response plans, and periodic reports from the qualified individual to the board of directors. Additionally, multiple states and Congress are considering laws or regulations which could create new individual privacy rights and impose increased obligations on companies handling personal data.
The Company’s systems and those of its clients and third-party service providers are under constant threat. Risks and exposures related to cybersecurity attacks are expected to remain high for the foreseeable future due to the rapidly evolving nature and sophistication of these threats, as well as due to the expanding use of internet banking, mobile banking, and other technology-based products and services by the Company and its clients.
Future Legislation and Regulation
Congress may enact legislation from time to time that affects the regulation of the financial services industry, and state legislatures may enact legislation from time to time affecting the regulation of financial institutions chartered by or operating in those states. Federal and state regulatory agencies also periodically propose and adopt changes to their regulations or change the manner in which existing regulations are applied. The substance or impact of pending or future legislation or regulation, or the application thereof, cannot be predicted, although the enactment of proposed legislation could impact the regulatory structure under which the Company and the Bank operate and may significantly increase costs, impede the efficiency of internal business processes, require an increase in regulatory capital, require modifications to business strategy, and limit the ability to pursue business opportunities in an efficient manner. A change in statutes, regulations or regulatory policies applicable to the Company or the Bank could have a material adverse effect on the business, financial condition, and results of operations of the Company and the Bank.
Additional Information
The Company maintains an investor relations website at https://ir.chainbridgebank.com/ where it provides access, free of charge, to its Annual Report on Form 10-K, Quarterly Reports on Form 10-Q, Current Reports on Form 8-K, and all amendments to these reports as soon as reasonably practicable after they are electronically filed with, or furnished to, the SEC. In addition, materials filed with the SEC are available at www.sec.gov. References to these websites do not constitute incorporation by reference of the information contained therein and should not be considered part of this document.
ITEM 1A. RISK FACTORS
The material risks and uncertainties that management currently believes may have a material adverse effect on us are described below. These risk factors are not guarantees of future outcomes and should be read carefully, as they could, individually or collectively, materially adversely affect our business, financial condition, results of operations, liquidity, cash flows, and the market price, trading volume, or liquidity of our equity securities, including our Class A Common Stock, depending on circumstances that may evolve over time.
Additionally, these risks and uncertainties are not exhaustive, and new or unforeseen risks may emerge, or existing risks may become more significant, due to changes in our business, financial condition, or external conditions, including but not limited to the economic, regulatory, political, technological, and market environment. Any of the risks described below, as well as additional risks that are not currently known to us, that we presently do not deem material, or that may later become material, could potentially, individually or in the aggregate, have a material adverse effect on our business,
22
financial condition, results of operations, cash flows, and the trading price, volatility, or liquidity of our Class A Common Stock, though the occurrence, timing, or impact of such effects cannot be predicted with certainty.
Further, to the extent that any information in this Annual Report on Form 10-K constitutes forward-looking statements, the risk factors below are intended to serve as cautionary statements within the meaning of the Private Securities Litigation Reform Act of 1995 (“PSLRA”), Section 27A of the Securities Act of 1933, as amended, and Section 21E of the Securities Exchange Act of 1934, as amended, identifying certain key factors that could cause actual results to differ materially from those expressed in any forward-looking statements. Forward-looking statements by their nature involve inherent risks and uncertainties, and we can provide no assurance that our expectations, projections, or assumptions will prove to be accurate or that any specific outcome will occur. Investors are cautioned not to place undue reliance on any forward-looking statements, as actual results may vary significantly due to factors within or beyond our control. See “Cautionary Note Regarding Forward-Looking Statements” for additional details on these limitations.
Summary Risk Factors
Some of the more significant challenges and risks relating to an investment in our Company include, among other things, the following:
•Changes in interest rates may adversely affect our earnings and financial condition.
•Increases in interest rates have in the past resulted in, and could in the future result in, unrealized losses on our investment securities portfolio.
•If the average interest rate we pay on our deposits increases, our cost of funds would rise.
•Increases in interest rates could result in a decrease in the market value of our loans.
•Liquidity risks could adversely affect our business, financial condition and results of operations.
•Loss of deposits could increase our funding costs or require us to sell assets or borrow.
•Our deposits are concentrated in political organizations, which can vary significantly in volume due to seasonality or changes in political activity or campaign finance laws.
•Our deposit base is concentrated among a small number of clients.
•Our deposit base is highly concentrated among entities affiliated with the U.S. Republican Party.
•Our deposits are concentrated in uninsured deposits.
•Chain Bridge Bancorp, Inc.’s liquidity is dependent on dividends from the Bank.
•We may need to raise additional capital in the future, and such capital may not be available when needed or at all.
•Our results of operations and financial condition would be adversely affected if the Bank’s allowance for credit losses is insufficient to absorb actual losses or needs to be increased.
•Losses related to a single large loan could have a significant impact on the Bank’s financial condition and results of operations.
•The Bank relies upon independent appraisals to determine the value of the real estate that secures a significant portion of its loans, and the values indicated by such appraisals may not be realizable if the Bank is compelled to foreclose upon such loans.
•Our business may be adversely affected by conditions in the financial markets and economic conditions generally.
•The geographic concentration of our business in the Washington, D.C. metropolitan area makes our business highly susceptible to local economic conditions and reductions or changes in government spending.
•Our investment securities portfolio exposes us to risks beyond our market area.
•Our significant investment in securities held to maturity exposes us to risks that may adversely affect our business, financial condition or results of operations.
•There can be no assurance that we will be able to maintain or increase our current levels of transaction accounts, non-interest-bearing demand deposits, and level of profitability or growth.
•We place a significant portion of our clients’ deposits with other banks through the ICS® network, which exposes us to risks that may adversely affect our business, financial condition or results of operations.
•Our Trust & Wealth Department exposes us to certain risks and there can be no assurance the department will contribute meaningfully to our revenues or become profitable on a standalone basis.
•We may be adversely affected by changes in the actual or perceived soundness or condition of other financial institutions.
•There is no assurance that the Bank will be able to compete successfully with others for its business.
•We could fail to attract, retain or motivate skilled and qualified personnel, including our senior management, other key employees or directors, which could adversely affect our business.
23
•Certain clients, including our political organization clients, may be subject to, and are particularly sensitive to, negative publicity, which may subject us to enhanced reputational risk.
•Fulfilling our public company financial reporting and other regulatory obligations and being a public company will be expensive and time consuming and may strain our resources.
•We are subject to operational risk, which could adversely affect our business and reputation and create material legal and financial exposure.
•Operational risks associated with funds transfer activities could materially and adversely affect our business, financial condition, and results of operations.
•The occurrence of fraudulent activity, breaches or failures of our information security controls or cybersecurity-related incidents could have a material adverse effect on our business, financial condition, results of operations, and reputation.
•We also face risks related to cyberattacks and other security breaches involving external, third-party vendors and counterparties.
•Our operations rely on certain external vendors, and our use of these vendors is subject to increasing regulatory requirements and attention.
•The development and use of artificial intelligence present risks and challenges that may adversely impact our business.
•We depend on the accuracy and completeness of information about clients and counterparties.
•Our reliance on estimates and risk management activities may not always prevent or mitigate risks effectively, leading to potential differences between actual results and our forecasts.
•Government regulation significantly affects our business and may result in higher costs and lower stockholder returns.
•Litigation and regulatory actions, including possible enforcement actions, could subject us to significant fines, penalties, judgments, restrictions on our business activities or reputational harm.
•The Bank’s primary regulator has broad powers to place limitations on the conduct of a bank’s business, or to close an institution.
•The Bank is subject to extensive and evolving requirements under anti-money laundering and sanctions laws.
•The Bank is subject to numerous “fair and responsible banking” laws and regulations designed to protect consumers, which increase our compliance costs and subject us to potential legal liability or reputational damage.
•We engage in lending secured by real estate and may be forced to foreclose on the collateral and own the underlying real estate, subjecting us to potential costs, risks and consumer protection laws.
•Any violation of laws regarding, or incidents involving, the privacy, information security and protection of personal, confidential or proprietary information could damage our reputation and otherwise adversely affect our business.
•Increases in FDIC insurance premiums could adversely affect our earnings and results of operations.
•The Federal Reserve may require the Company to commit capital resources to support the Bank at a time when our resources are limited, which may require us to borrow funds or raise capital on unfavorable terms.
•Changes in our accounting policies or in accounting standards could materially affect how we report our financial results and condition.
•The dual-class structure of our common stock has the effect of limiting your ability to influence corporate matters and may adversely affect the market for our Class A common stock.
•Members of the Fitzgerald Family and other holders of Class B common stock could aggregate their holdings and sell a controlling interest in us to a third party in a private transaction.
•Conflicts of interest and other disputes may arise between the members of the Fitzgerald Family and us that may be resolved in a manner unfavorable to us and our other stockholders.
•An acquisition of another banking institution could increase operational and regulatory risks, and adversely affect our financial condition and stock price and, if paid for with our Class A Common Stock, could dilute existing stockholders.
•An investment in our common stock is not an insured deposit.
•If the Bank fails or is put into receivership or conservatorship by the FDIC and its primary regulator, investors will likely lose their entire investment in the Company.
In addition, an investment in shares of our common stock involves certain risks related to our common stock, including related to the market price, dilution, our ability to issue preferred stock, our dividend policy, our status as an
24
“emerging growth company” and “smaller reporting company,” analyst research and recommendations, factors that may discourage or delay acquisition attempts for us, and the exclusive forum provisions in our Charter and Bylaws.
Interest Rate Risk
Changes in interest rates may adversely affect our earnings and financial condition.
Changes in interest rates may adversely affect our earnings and financial condition in ways that cannot be predicted with certainty. Interest rates are highly sensitive to numerous factors beyond our control, including inflation, unemployment, changes in the money supply, international events, events in world financial markets, competition, general economic conditions, tariffs, and monetary and fiscal policies of various governmental and regulatory authorities, including the Federal Reserve.
Our operating income and net income depend to a great extent on net interest margin (i.e., the difference between the interest yields earned on cash, loans, securities and other interest-bearing assets and the interest rates paid on interest-bearing deposits, borrowings and other liabilities). Net interest margin is affected by changes in market interest rates because different types of assets and liabilities may react differently, and at different times, to market interest rate changes. For example, when interest-bearing liabilities mature or reprice more quickly than interest-earning assets in a period, an increase in market rates of interest could reduce net interest income. Similarly, when interest-earning assets mature or reprice more quickly than interest-bearing liabilities, falling interest rates could reduce net interest income. Additionally, because a significant majority of our funding consists of non-interest-bearing deposits and a substantial amount of our assets are invested in cash and cash equivalents, a decrease in short-term interest rates would be expected to immediately reduce our interest income without a corresponding reduction in our interest expense, which would reduce our net interest income. While we have recently benefited from elevated short-term rates, the Federal Reserve began reducing its target federal funds rate in September 2024, and ongoing or further declines in the Interest on Reserve Balances (IORB) rate would be expected to adversely affect our net interest income unless offset by other factors. These conditions would be expected to adversely affect our business, results of operations and financial condition.
A substantial portion of our assets is invested in interest-bearing reserves at the Federal Reserve. If the Federal Reserve decreases the interest it pays on these reserves, or ceases to pay interest on these reserves entirely, our net interest income could be adversely affected. This risk may potentially be exacerbated if the Federal Reserve requires banks to maintain minimum levels of reserves. Further, a reduction in the interest rate paid on these reserves or in the accessibility of these reserves could compel us to seek alternative, potentially higher-risk investments to generate interest income, which might adversely affect our business, results of operations, or financial condition if such investments underperform or increase our risk exposure.
Increases in interest rates will likely also adversely affect the market value of our investment and loan portfolios. If we are required to sell securities at a discount prior to their maturity, our unrealized losses would then turn into realized losses. See “Interest rates have in the past resulted in, and could in the future result in, unrealized losses on our investment securities portfolio.” Decreases in the market value of our loan portfolio could potentially become realized losses if we were to sell loans or if our bank were to be acquired. See “Increases in interest rates could result in a decrease in the market value of our loans.”
We attempt to manage risk from changes in market interest rates by adjusting the rates, maturities, repricing schedules, and balances of various types of interest-earning assets and interest-bearing liabilities. However, interest rate risk management techniques are imprecise and may not effectively mitigate these risks. Moreover, we currently do not employ interest rate derivatives to hedge this risk, relying exclusively on portfolio adjustments, which may prove insufficient against rapid or significant rate fluctuations. As a result, a rapid increase or decrease in interest rates could potentially have an adverse effect on our net interest margin and results of operations. Market interest rates for types of products and services in our market may also fluctuate significantly over time due to competition and local or regional economic conditions. Our interest rate risk management process relies on numerous assumptions, including projections of interest rate trends and asset-liability repricing behaviors, which may be inaccurate due to unforeseen market shifts or external factors beyond our control. Furthermore, should we employ derivatives in the future, their implementation costs or ineffective hedging could potentially further complicate risk management. Consequently, there can be no assurance that we will successfully manage our interest rate risk exposure, and actual outcomes may differ materially from our expectations due to factors within or beyond our control.
25
Increases in interest rates have in the past resulted in, and could in the future result in, unrealized losses on our investment securities portfolio.
We allocate a substantial portion of our assets in investment securities. As of December 31, 2024, approximately 47% of our total assets were held in an investment securities portfolio consisting primarily of U.S. Treasury securities, municipal bonds, and investment-grade corporate bonds—asset classes that are inherently sensitive to changes in interest rates. When interest rates rise, the fair value of fixed-income securities typically declines due to the inverse relationship between interest rates and bond prices. As a result, interest rate increases have recently led to, and could in the future lead to, greater unrealized losses in our investment portfolio. We recognize changes in the estimated fair value of these securities through other comprehensive income unless the securities are sold, at which point any realized gain or loss is recorded in net income. As of December 31, 2024, our net unrealized losses on available-for-sale securities, after tax, totaled $5.5 million, while net unrealized losses on held-to-maturity securities, after tax, amounted to $17.1 million—a combined total representing 14.87% of our Tier 1 capital. If we were required to liquidate a substantial portion of our investment securities portfolio, we could be forced to sell securities at a loss, which could materially reduce our earnings, adversely affect our regulatory capital ratios, and negatively impact our business and financial condition.
If the average interest rate we pay on our deposits increases, our cost of funds would rise.
A significant majority of our funding consists of non-interest-bearing deposits. As of December 31, 2024, over 70% of our liabilities consisted of non-interest-bearing deposits. During periods of high or increasing interest rates, our clients have in the past shifted, and may in the future shift, their funds to accounts or financial institutions that offer higher interest rates. Further, we estimate that there are periods when a majority of our deposit balances are sourced from political organizations, which cause our deposit balances to fluctuate due to the seasonality of fundraising and spending around elections, and following elections our political organization clients have in the past shifted, and may in the future shift, their funds from non-interest-bearing accounts to interest bearing accounts. See “Our deposits are concentrated in political organizations, which can vary significantly in volume due to seasonality or changes in political activity or campaign finance laws.” Such movements increase our cost of funds and adversely affect our business, financial condition or results of operations and could cause our current business strategy to become unprofitable. Further, to the extent clients withdraw their deposits and move their funds to competitors or alternative investments, we would lose a lower-cost source of funding, which would be expected to adversely affect our business, financial condition or results of operations. See “— Liquidity Risk — Loss of deposits could increase our funding costs or require us to sell assets or borrow.”
Increases in interest rates could result in a decrease in the market value of our loans.
As of December 31, 2024, variable rate loans, which include floating and adjustable rate structures, comprised 70.8% of our loan portfolio. Our variable rate loans primarily consist of adjustable-rate residential real estate loans with initial fixed-rate periods of three, five, seven, or ten years, which, depending on the loan program, reprice every one, three, or five years after the initial fixed-rate period ends, and so a substantial part of our loan portfolio remains sensitive to interest rate changes for extended periods.
When interest rates rise, the market value of loans with longer fixed-rate periods decreases. Unlike our available-for-sale investment securities, our loans are carried at amortized cost on our balance sheet. As a result, increases in interest rates create unrealized losses in our loan portfolio that are not immediately reflected in our financial statements.
These unrealized losses could become realized if we were to sell loans or if the Bank were to be acquired. Additionally, the reduced market value of our loan portfolio in a rising rate environment could negatively impact the economic value of our equity, even if not immediately apparent from our reported financial results. This could potentially affect our ability to raise capital or impact our valuation in a merger or acquisition. See Note 12, “Fair Value Measurements” to our audited consolidated financial statements included elsewhere in this Annual Report on Form 10-K for further information regarding the estimated fair value of our loan portfolio as of December 31, 2024.
Liquidity Risk
Liquidity risks could adversely affect our business, financial condition and results of operations.
Liquidity risk is the risk that we will not be able to meet our obligations, including financial and loan commitments, as they come due and is inherent in our operations. An inability to raise funds through deposits, borrowings, the sale of investment securities and from other sources could have a substantial negative effect on our liquidity.
26
Our most important source of funds consists of our clients’ deposits. Deposit balances can decrease for a variety of reasons, and if clients move money out of deposits for any reason, we could lose a relatively low-cost source of funds, or we may need to sell assets or borrow for liquidity. See “Loss of deposits could increase our funding costs or require us to sell assets or borrow.” Further, we estimate that there are periods when a majority of our deposit balances are sourced from political organizations, which cause our deposit balances to fluctuate due to the seasonality of fundraising and spending around elections. See “Our deposits are concentrated in political organizations, which can vary significantly in volume due to seasonality or changes in political activity or campaign finance laws.”
Our primary source of liquidity is our account at the Federal Reserve, which held $406.7 million at December 31 2024, which supports our daily and ongoing activities. We also maintain secured lines of credit with the Federal Home Loan Bank (the “FHLB”) and the Federal Reserve’s discount window, which require us to pledge collateral to establish credit availability. Because we have no collateral pledged to support borrowings under our secured line of credit with the FHLB or the Federal Reserve’s discount window, we would need to identify and pledge collateral before we could use the FHLB or the Federal Reserve’s discount window as a source of additional liquidity, and our access to additional liquidity may be delayed or unavailable when needed. Another source of liquidity is the principal and interest payments we receive on our loans and investment securities. Cash on hand, cash at third-party banks and available-for-sale debt securities are our most liquid assets. Our investment portfolio is composed of investment-grade securities. Our access to funding sources in amounts adequate to finance or capitalize our activities or on terms that are acceptable to us could be impaired by factors that affect us directly or the financial services industry or economy in general, such as disruptions in the financial markets or negative views and expectations about the prospects for the financial services industry. Economic conditions and a loss of confidence in financial institutions may increase our cost of funding and limit access to certain customary sources of capital, including inter-bank borrowings and borrowings from the discount window of the Federal Reserve.
Any decline in available funding, or inability to access our available funding in a timely manner, could adversely impact our ability to continue to implement our business plan, including originating loans, investing in securities, meeting our expenses or fulfilling obligations such as repaying our borrowings and meeting deposit withdrawal demands, any of which could have a material adverse effect on our business, financial condition and results of operations.
Loss of deposits could increase our funding costs or require us to sell assets or borrow.
Like many banking companies, we rely on client deposits to provide a considerable portion of our funding, and we continue to seek client deposits to maintain this funding base. We accept deposits directly from consumer and commercial clients and, as of December 31, 2024, we had $1.2 billion in total deposits. If we are unable to sufficiently maintain or grow our deposits to meet liquidity objectives, we may be subject to paying higher funding costs or unable to satisfy our funding needs.
Our deposits may be subject to dramatic fluctuations in availability or price due to certain factors outside our control, such as a loss of confidence by clients in us or the banking sector generally, client perceptions of our financial health and general reputation, increasing competitive pressures from other financial services firms for consumer or commercial client deposits, changes in interest rates and returns on other investment classes, which could result in significant outflows of deposits within short periods of time or significant changes in pricing necessary to maintain current client deposits or attract additional deposits. Notably, we estimate that there are periods when our deposits received from political organizations constitute at least a majority of our total deposits, and these deposits are generally more seasonal than typical commercial or consumer deposits, aligning with the cycle of federal election campaigns. See “Our deposits are concentrated in political organizations, which can vary significantly in volume due to seasonality or changes in political activity or campaign finance laws.” Further, as of December 31, 2024, we estimate that approximately 68.6% of our total deposits were not insured by the FDIC, and these uninsured deposits may be more likely to be withdrawn if we experience, or are perceived to experience, financial distress or during periods of real or perceived stress or instability in financial markets more generally. See “Our deposits are concentrated in uninsured deposits.” In addition, if our competitors raise the rates they pay on deposits, our funding costs may increase, either because we raise our rates to avoid losing deposits or because we lose deposits and must rely on more expensive sources of funding. Also, clients typically move money from bank deposits to alternative investments during high or rising interest rate environments. Checking and savings account balances and other forms of client deposits may decrease when clients perceive alternative investments as providing a better risk/return trade-off. Our clients could take their money out of the Bank and put it in alternative investments, causing us to lose a lower-cost source of funding. Clients may also move non-interest-bearing deposits to interest-bearing accounts, increasing the cost of those deposits. Obtaining adequate funding to meet our deposit obligations may be more challenging during periods of elevated prevailing interest rates, such as the present, and our ability to attract depositors during a time of actual or perceived distress or instability in the marketplace may be limited. Higher funding costs could reduce our net
27
interest margin and net interest income and could have a material adverse effect on our business, financial condition and results of operations.
Our deposits are concentrated in political organizations, which can vary significantly in volume due to seasonality or changes in political activity or campaign finance laws.
As of December 31, 2024, we estimate that ten of our 14 clients with individual deposit balances exceeding 1.0% of our total deposits were political organization clients, representing 32.22% of our total deposits. These deposits exhibit more seasonality than typical commercial or consumer deposits. Federal election cycles influence our deposit levels and revenues. In the quarters leading up to federal elections, especially presidential elections, our deposits, net interest income, and non-interest income generally increase. Conversely, in the quarters immediately before, during, and after a federal election, we usually experience an outflow of political organization deposits, causing revenue to decline until clients resume fundraising for the next election cycle. The precise amount and timing of these outflows remain uncertain and may differ from historical patterns. Post-election fundraising activities are generally influenced by the outcome of the federal elections. Even within our classification of political organizations, some types may exhibit more seasonality. For instance, certain party committee accounts may maintain funds throughout election cycles, while some campaign committees may have accounts that are only established for a single campaign. During periods of high interest rates this seasonality may be exacerbated. We may underestimate the proportion of our deposits subject to seasonality, potentially leading to higher than expected deposit outflows. If our deposit levels decline due to seasonality and we replace them with higher-cost deposits or borrowings, sell investment securities at a discount before maturity, or reduce our interest-bearing assets, our net interest margin, earnings, and earnings per share could be adversely affected.
Given our concentration in political organizations deposits, which exhibit pronounced seasonality, we often maintain a higher proportion of assets in highly liquid investments, such as interest-bearing reserve balances at the Federal Reserve or short term U.S. Treasury securities, to fund anticipated withdrawals and mitigate liquidity risk. However, these highly liquid, zero-risk-weighted investments generally yield lower returns than fully risk-weighted, less liquid assets, such as commercial or consumer loans.
During periods of seasonal deposit growth, our balance sheet may expand to a level that requires us to actively manage the Bank’s Tier 1 leverage ratio. In the past, we have managed our Tier 1 leverage ratio by placing certain deposits at other financial institutions as One-Way Sell® deposits through the ICS® network, thereby keeping them off our balance sheet. However, there is no assurance that this strategy will continue to be available or effective in the future. See “— Other Risks Related to Our Business — We place a significant portion of our clients’ deposits with other banks through the ICS® network, which exposes us to risks that may adversely affect our business, financial condition, or results of operations.” If we are unable to manage our Tier 1 leverage ratio by using the ICS® network, we may need to restrict our growth or raise additional capital.
Our ability to raise additional capital will depend on market conditions, economic factors, and other external factors, many of which are outside our control. Consequently, there can be no assurance that we will be able to raise additional capital, whether through equity issuance or by debt financing, on acceptable terms. See “— We may need to raise additional capital in the future, and such capital may not be available when needed or at all.” If we are required to curtail our growth, or if we cannot raise additional capital when needed or on acceptable terms, our results of operations and long-term strategic objectives could be adversely impacted. See “— Legal, Regulatory and Compliance Risks — Government regulation significantly affects our business and may result in higher costs and lower stockholder returns.” As of December 31, 2024, the Bank’s Tier 1 leverage ratio was 9.57% and our One-Way Sell® deposits totaled $63.3 million. If these deposits were included on our balance sheet as of December 31, 2024, we estimate that the Bank’s Tier 1 leverage ratio would have been 8.64%, which exceeds the 5.00% Tier 1 leverage ratio required to be considered “well capitalized” under applicable federal banking regulations.
The level of political organization deposits may also be adversely affected by changes in political activity or campaign finance laws. For example, following the U.S. Supreme Court’s decision in Citizens United v. Federal Election Commission in 2010, we experienced significant deposit inflows from Super PACs, which are permitted to accept unlimited contributions for the purpose of making independent expenditures. Any changes in political contributions or spending, including as a result of a change in campaign finance laws that restrict our clients’ ability to accept contributions or spend funds, could reduce our deposit inflows and adversely affect our business, financial condition, or results of operations.
28
Our deposit base is concentrated among a small number of clients.
A significant portion of our total deposits are attributable to a fraction of our deposit accounts, particularly during periods of high deposits due to seasonality. As of December 31, 2024, there were two clients with individual deposit balances exceeding 5.0% of our total deposits, accounting for 16.2% of our total deposits, and there were 14 clients with individual deposit balances exceeding 1.0% of our total deposits, accounting for 38.3% of our total deposits.
Approximately 80% of our total deposit balances were from commercial entities, including businesses, political organizations, trade associations, and nonprofit organizations. These deposit clients are typically intermediated by personal relationships between Bank officers and the commercial client account signers, and therefore can require significant investments of time and resources to maintain. Any deterioration in such relationships, particularly those associated with significant deposit size, could lead to an outflow of deposits and compel us to liquidate interest-earning assets, which could lead to a decline in our earnings. Changes in personnel in these relationships, whether at the Bank or on the part of the client, could cause the relationship to deteriorate and the depositor to leave the Bank.
Further, a concentrated number of firms provide treasury, legal or regulatory compliance services for political organizations. As part of their advisory services, these firms often open deposit accounts with the Bank on behalf of their client or recommend that their clients open up their deposit account with the Bank. These firms are a significant source of our deposits, including through deposit referrals. As of December 31, 2024, of our 14 clients with individual deposit balances exceeding 1.0% of our total deposits, eight clients representing 25.94% of our total deposits opened their deposit accounts through firms that provide these services for political organizations. The concentration of deposits associated with these firms may be higher than the figures provided suggest, as our method of tracking these relationships may not capture all relevant connections. If our relationships with these firms deteriorate or if our reputation among these firms suffers and they no longer recommend us, we could experience a reduction in new clients from these firms, potentially leading to an outflow of deposits from existing clients and a failure to acquire new clients through these firms in the future. Additionally, we are not very well known outside of the commercial sectors we primarily serve, especially political organizations, and have little consumer brand recognition in the Washington, D.C. metropolitan area market and no consumer brand recognition in other markets. As a result, our deposit base and earnings may continue to be heavily dependent on our commercial deposit clients for the foreseeable future. The loss of even one of these key relationships could have a material adverse effect on our deposit base and financial condition.
Our deposit base is highly concentrated among entities affiliated with the U.S. Republican Party.
Our deposit base is highly concentrated among organizations affiliated with the U.S. Republican Party. We have been the depository bank for every Republican presidential nominee since the 2008 federal election cycle, and substantially all of our political organization deposits, come from entities affiliated with the Republican Party. This concentration exposes us to certain risks that could adversely affect business, financial condition, or reputation.
Our deposit base is vulnerable to changes in the Republican Party’s candidates, political fortunes, strategies, or fundraising. Any event that negatively impacts the Republican Party, including its ability to raise funds or its popular support, could lead to significant deposit outflows or impact future deposit inflows. For example, controversies, leadership changes, or shifts in party strategy or donor behavior affecting the Republican Party could adversely affect our deposit levels. Changes in campaign finance laws or regulations that affect the Republican Party or its fundraising methods could also adversely impact our deposit levels. Further, our political organization deposits exhibit seasonality based on election cycles, and our concentration in Republican-affiliated organizations, particularly our involvement with presidential campaigns, may exacerbate this effect, as we may experience more pronounced deposit inflows and outflows based on Republican primary and general election timelines or outcomes. In addition, while we have previously provided banking services to certain key Republican political organizations during election cycles in the past, there is no assurance that we will be selected to provide such services in the future. Any significant reduction in deposits from Republican-affiliated organizations could materially and adversely affect our liquidity, financial condition, and results of operations. Our ability to replace these deposits with alternative sources, if necessary, may be limited and could result in higher funding costs or require us to sell securities prior to maturity, potentially at a loss.
Our association with Republican-affiliated organizations may impact our ability to attract or retain clients with different political affiliations. It could also expose us to public relations challenges, including negative media coverage, social media criticism or potential boycotts from supporters of other political viewpoints. Our focus on serving Republican-affiliated organizations may also limit our ability to diversify our political organization deposit base, as Democratic-affiliated organizations have generally established, and may in the future establish, banking relationships elsewhere. Our
29
high concentration of deposits from Republican-affiliated organizations may also attract increased regulatory scrutiny, potentially leading to additional compliance burdens or restrictions on our activities.
Under campaign finance laws and regulations, including Federal Election Commission (“FEC”) regulations, our political organization clients that are registered with the FEC must regularly disclose their financial activities, including details of their deposits and loans with us. This mandated transparency means that our banking relationships with these clients, including deposit levels, loan amounts, and transaction patterns, may be publicly accessible. Such visibility could make our deposit base more susceptible to fluctuations based on public scrutiny, political events, or changes in campaign finance laws. Competitors, journalists, watchdog groups, and opposing political entities can easily monitor and analyze these disclosures, potentially using this information to our disadvantage. Given our concentration in Republican-affiliated organizations, we may become a particular target for activist groups or politically motivated campaigns. These groups may use the publicly available information to pressure us, our clients, or our business partners, potentially through boycotts, negative publicity campaigns, or other means. Sudden changes in deposit levels could signal shifts in political fortunes or campaign strategies, attracting unwanted attention or speculation.
As a public company, we may also face a heightened risk of being targeted by politically motivated groups or activist investors seeking to influence our business practices or client relationships. Such groups or activists may attempt to use stockholder resolutions, proxy contests, public campaigns, media pressure, or other means to force changes in our operations or governance. For example, they may pressure us to alter our business model, sever relationships with certain Republican candidates or committees, adopt specific political stances, or increase disclosures beyond regulatory requirements. While our dual-class stock structure is designed in part to mitigate certain risks, there can be no assurances that our dual-class stock structure will provide complete protection against potential pressures by such groups or activists. Further, even if these efforts are not successful, they could still result in significant legal expenses, consume management’s time and attention, and potentially alienate some of our depositors, employees, or business partners, and could result in negative publicity or reputational damage.
Our deposits are concentrated in uninsured deposits.
As of December 31, 2024, we estimate that approximately $857.8 million, or approximately 68.6% of our total deposits, were not insured by the FDIC. These uninsured deposits may be more likely to be withdrawn if we experience, or are perceived to experience, financial distress or during periods of real or perceived stress or instability in financial markets more generally. For example, bank failures have caused ongoing concerns about the liquidity of the financial services industry, which could increase deposit outflows due to concerns that deposits held at the Bank exceed the FDIC’s $250,000 per client insurance limit. These concerns may be exacerbated by negative media attention and the rapid spread of rumors, concerns and information, including misinformation on social media, that could cause panic among investors, depositors, clients and the general public. If many clients withdraw their deposits, it could have a material adverse effect on our business, financial condition and results of operations, including by forcing us to seek alternative funding sources, requiring us to sell securities at a loss and limiting our ability to make new investments or loans. See “Loss of deposits could increase our funding costs or require us to sell assets or borrow.”
We do not maintain policies or internal limits regarding our concentration in uninsured deposits. Our estimated uninsured deposits increased to approximately $857.8 million, or 68.6% of our total deposits, as of December 31, 2024 from approximately $648.0 million, or approximately 58.3% of our total deposits, as of December 31, 2023. Although we have implemented policies and employ strategies to manage our liquidity, as discussed in “Management’s Discussion and Analysis of Financial Condition and Results of Operations — Liquidity and Capital Management — Liquidity Management,” there can be no assurances that we will be able to successfully manage our liquidity risk, including the risk that our concentration in uninsured deposits may expose us to an increased risk of deposit outflows.
We participate in the ICS® network to provide our clients with additional FDIC insurance coverage for their uninsured balances. For our clients that opt into the ICS® network, this service allows us to place their deposits in increments up to the FDIC insurance limits at other banks within the ICS® network. However, there can be no assurance that the availability of the ICS® network will limit outflows of our uninsured deposits or that the network will continue to exist, our participation in the ICS® network itself exposes us to risk. Further, clients may still withdraw funds despite additional coverage, particularly in times of heightened market uncertainty. See “— We place a significant portion of our clients’ deposits with other banks through the ICS® network, which exposes us to risks that may adversely affect our business, financial condition or results of operations.”
30
Chain Bridge Bancorp, Inc.’s liquidity is dependent on dividends from the Bank.
Chain Bridge Bancorp, Inc. is a legal entity separate and distinct from our bank subsidiary, Chain Bridge Bank, N.A. Dividends from the Bank provide virtually all of Chain Bridge Bancorp, Inc.’s operating cash flow. Various federal and state laws and regulations limit the amount of dividends that our Bank may pay to Chain Bridge Bancorp, Inc. For example, under applicable regulations, the Bank may not, without prior regulatory approval, declare dividends in excess of the sum of the current year’s net profits plus the retained net profits from the prior two years or in excess of the sum of the Bank’s retained earnings and current period net income. See “— Risks Related to Our Common Stock — We do not intend to pay dividends on our common stock for the foreseeable future, and our future ability to pay dividends is subject to restrictions.” Also, Chain Bridge Bancorp, Inc.’s right to participate in a distribution of assets upon a subsidiary’s liquidation or reorganization is subject to the prior claims of the subsidiary’s creditors. In the event the Bank is unable to pay dividends to Chain Bridge Bancorp, Inc., we may not be able to service any debt we may incur, pay obligations or pay dividends on our common stock. The inability to receive dividends from the Bank could affect Chain Bridge Bancorp, Inc.’s liquidity and have a material adverse effect on our business, financial condition and results of operations.
We may need to raise additional capital in the future, and such capital may not be available when needed or at all.
We are currently well-capitalized and have no holding company debt, but we may still require additional capital to support our Bank’s future growth. If deposit growth or other factors increase our Bank’s deposit and asset levels, including due to seasonality, we may need additional capital to maintain a Tier 1 leverage ratio at levels we consider appropriate.
We have previously borrowed from an unsecured revolving line of credit with a third-party commercial bank and used the proceeds to purchase stock in the Bank to increase its regulatory capital. In October 2024, we used a portion of the net proceeds of our initial public offering to repay that $10.0 million line of credit in full, after which the line of credit was closed. We may not be able to secure a new line of credit on similar terms in the future, or at all.
Issuing additional common stock could dilute our existing stockholders’ earnings per share (“EPS”) and potentially reduce book value per share (“BVPS”), particularly if the issuance price is below our then-current book value. By contrast, issuing subordinated debt or preferred stock would add interest or dividend obligations that we do not currently have. Holders of preferred stock may also have preferences senior to our common stockholders, which could affect dividends or liquidation proceeds. These potential obligations and preferences could adversely affect our future earnings and the value of our common stock.
Our ability to raise additional capital, if needed, will depend on, among other things, conditions in the capital markets at that time, which are outside of our control, and on our financial condition. Unfavorable economic conditions or diminished confidence in financial institutions could limit our access to traditional capital markets sources, such as public offerings of equity or debt securities or private placements with institutional investors. Any event that limits our access to these markets—such as general market disruptions—may increase our capital costs or restrict the amount of capital available to us. This risk may be amplified if we must seek additional capital at a time when multiple financial institutions are doing the same.
If we incur debt at the holding company level, we would introduce leverage, which could make our financial position more vulnerable to adverse changes in market conditions. We could also potentially be required to pledge the Bank’s stock as collateral to secure such borrowings. While this approach might lessen the need to issue additional shares (and thereby temper EPS or BVPS dilution), the associated interest expense could lower our net interest margin and reduce our earnings. If we default on secured debt, creditors could foreclose on the pledged Bank stock.
An inability to raise capital on acceptable terms could have a material adverse effect on our business, financial condition, and results of operations. It could cause us to limit the Bank’s deposit growth or reduce the Bank’s deposit and corresponding asset size to maintain a Tier 1 leverage ratio satisfactory to us. It could also subject us to heightened regulatory scrutiny and restrictions on growth, including limits on our ability to expand our loan portfolio or pursue acquisitions. These constraints could increase operating expenses or decrease revenues, thereby negatively affecting our financial condition and results of operations.
31
Credit Risk
Our results of operations and financial condition would be adversely affected if the Bank’s allowance for credit losses is insufficient to absorb actual losses or needs to be increased.
Our financial results and condition could be negatively impacted if our allowance for credit losses is insufficient to cover actual losses or if we need to increase this allowance. While we have historically maintained low levels of non-performing loans and net loan charge-offs, there is no guarantee this trend will continue. Banking regulations, specifically those set forth by the OCC and the FDIC, require that the securities we hold must be investment grade. However, no similar regulation applies to our loan portfolio. Risks associated with our loan portfolio include: (1) the geographic concentration of our loans in the Washington, D.C. area; (2) our exposure to certain categories of loans with relatively higher credit risk, including commercial real estate and commercial and industrial loans; (3) the relatively large size of some residential mortgage loans; (4) the newness of certain loans made later in the economic cycle; and (5) the continued fundraising efforts by party committees to repay election-related borrowings. Even though we believe that our allowance for credit losses is reasonably sufficient to cover expected losses, estimating loan losses involves judgment and inherent uncertainties. Despite our efforts to monitor credit quality and identify problem loans early, we may not always succeed in detecting deteriorating loans before they become non-performing, nor can we guarantee that we will be able to limit losses. As a result, we may need to significantly and unexpectedly increase our allowance for credit losses in the future, which could materially affect our financial performance and condition.
Losses related to a single large loan could have a significant impact on the Bank’s financial condition and results of operations.
As a result of the Bank’s concentrations of single-family residential jumbo mortgage loans and large commercial loans, a loss on any single large loan or multiple loans could negatively impact our results of operations. As of December 31, 2024, the Bank held 55 non-conforming single-family residential jumbo mortgage loans with an aggregate balance of $98.8 million, representing 46.88% of the Bank’s total single-family residential mortgage portfolio. Additionally, commercial and industrial loans not primarily secured by real estate are typically made based on the ability of the borrower to make payment on the loan from the cash flow of the business, and are collateralized primarily by business assets such as equipment and accounts receivable. These assets are often subject to depreciation over time and may be more difficult than real estate collateral to evaluate, and the value of such assets may be more difficult to realize upon liquidation. As a result, the availability of funds for repayment of such loans is often contingent on the success of the business itself.
Although the Bank officers strive to rigorously underwrite and structure loans and diligently monitor the financial condition of borrowers in an effort to avoid or minimize losses, unexpected reversals in the business of an individual borrower can occur, and the resulting decline in the quality of loans to such borrowers, and related provisions for credit losses, could have a material adverse effect on our results of operations and financial condition. Despite our best efforts, it is not always possible to predict or prevent every potential financial issue that borrowers may face.
The Bank relies upon independent appraisals to determine the value of the real estate that secures a significant portion of its loans, and the values indicated by such appraisals may not be realizable if the Bank is compelled to foreclose upon such loans.
A significant portion of our Bank’s loan portfolio is secured by residential and commercial real estate. To determine the value of the real estate that secures these loans, we rely on independent appraisals. These appraisals are estimates of value at a specific point in time, and while they are an important tool in our lending process, they are not guarantees of future market value. The independent appraisers we use may make errors in judgment or overlook factors that could affect the reliability of the appraisals, despite our efforts to mitigate such risks.
While the Bank utilizes appraisal management companies to order appraisals and employs a third-party appraisal review process to evaluate the accuracy and reliability of the appraisals before they are used in our lending decisions, there can be no assurances that these practices will prevent losses if the Bank is compelled to foreclose on loans secured by residential and commercial real estate. Even with these measures in place, the value of real estate can change due to market conditions or events that occur after the appraisal, which are beyond our control. If we are compelled to foreclose on a property, there is a risk that the real estate may be worth less than the appraised value, which could result in the Bank not recovering the full amount of the loan. In such cases, we could incur losses that may adversely affect our financial condition.
32
Other Risks Related to Our Business
Our business may be adversely affected by conditions in the financial markets and economic conditions generally.
Our financial performance generally is dependent upon the business environment in the markets in which we operate and in the United States as a whole, and may be adversely affected by conditions in the financial markets and economic conditions. Unfavorable or uncertain economic and market conditions can be caused by, among other factors, declines in economic growth, business activity or investor or business confidence; limitations on the availability or increases in the cost of credit and capital; changes in inflation, interest rates monetary policy or fiscal policy; concerns regarding the ability of Congress to reach agreement on federal budget matters (including the debt ceiling), or total or partial government shutdowns; changes in trade policy, including changes in tariffs, or immigration policy; increases in real estate and other state and local taxes; high unemployment; natural disasters; geopolitical issues, conflicts and uncertainty; public health emergencies or pandemics; and other external factors or a combination of these or other factors.
Unfavorable economic or market conditions can result in a deterioration in the credit quality of our borrowers, the value of collateral securing our loans and leases and the demand for our products and services, an increase in the number of loan delinquencies, defaults and charge-offs, additional provisions for credit losses and an overall material adverse effect on the quality of our loan portfolio, each of which could adversely affect our business, results of operations or financial condition. Our deposit balances and earning assets may also be impacted by economic and market factors such as output, inflation, interest rates, wages, asset values, and government spending. In addition to any impact on our balance sheet, inflation can increase our operating costs primarily through labor and technology overhead. Political fundraising comprises a large share of our deposit base and is dependent on contributions from high-net-worth and small-dollar donors across the United States, which may decline during periods of unfavorable economic or market conditions. High-earning professionals in fields such as public affairs, law, government contracting, and consulting are a substantial source of our deposits and loans, and to the extent such professionals are adversely affected by unfavorable economic or market conditions, they may withdraw some or all of their deposits or become unable to repay their loans. We also have a significant portion of our assets in an investment securities portfolio containing U.S. government, municipal, and corporate bonds that are sensitive to broad economic conditions, especially interest rates.
The geographic concentration of our business in the Washington, D.C. metropolitan area makes our business highly susceptible to local economic conditions and reductions or changes in government spending.
Our operations are primarily concentrated in the Washington, D.C. metropolitan area market, where our banking office is located. As of December 31, 2024, our loan portfolio had a total balance of $313.6 million in gross loans, consisting primarily of $229.2 million of single-family mortgage loans, home equity lines of credit, and residential construction loans, approximately $53.5 million in commercial real estate (“CRE”) loans secured by properties, $27.9 million of commercial loans to businesses, and approximately $3.0 million of consumer loans. Based on data available, we estimate that approximately 83.4% of our loans are tied to properties or borrowers located in the Washington, DC metropolitan area. Additionally, a majority of our consumer deposit clients also reside in the Washington, D.C. metropolitan area. Because we employ a branch-less business model, our ability to expand our retail lending and deposit businesses beyond this market is limited, which could increase our exposure to local economic disruptions, including potential impacts from changes in federal policies or government spending.
The Washington, D.C. metropolitan area’s economy is heavily dependent on federal government spending, as a significant number of businesses in the area are federal government contractors or subcontractors, or depend on such businesses for a significant portion of their revenues. The current U.S. presidential administration, which took office on January 20, 2025, and the Administration’s newly established Department of Government Efficiency (“DOGE”), have proposed and begun implementing substantial reductions in U.S. federal government spending. These measures target federal employment, government contracts, government real estate leases, and office space usage. Such measures, if implemented, could materially weaken the Washington, D.C. metropolitan area economy and, in turn, pose direct risks to our loan portfolio’s credit quality and our overall financial condition. As of December 31, 2024, we estimate a portion of our commercial loan balances, totaling approximately $2.45 million, were extended to businesses with direct or indirect relationships with federal government contracts. Additionally, approximately $17.3 million of our consumer residential mortgage loan and home equity lines of credit balances were made to borrowers, who at the time of application, were employed by the federal government while an estimated $26.1 million of such loans were associated with borrowers, who at the time of application were working for a federal contractor. Employment status for these borrowers may have changed since the time of application. If regional economic conditions deteriorate as a result of these federal spending reductions, we may experience: reduced opportunities to maintain or grow business relationships; heightened risks to loan
33
collectability (particularly within our CRE portfolio); declines in collateral values for residential and commercial real estate; decreased loan demand; and possible consumer or business deposit outflows. Any of these developments could have a material adverse effect on our business, results of operations, and financial condition.
Although we do not presently hold a significant amount of loans to federal government contractors or their subcontractors, broader economic repercussions from the current presidential administration and DOGE-driven spending cuts — or a reallocation of government spending to different industries or different regions — may indirectly impair the financial condition of our borrowers. Permanent or temporary staffing reductions, salary cuts, or furloughs of government employees and contractors could adversely affect other businesses in our market, including property owners leasing to government agencies, vendors, and various commercial and retail enterprises. Such conditions could reduce CRE property values and rental income, which may increase the risk of delinquencies or defaults in our CRE portfolio (including owner-occupied and non-owner occupied properties) and lead to higher provisions for credit losses. As a result, we could face elevated loan delinquencies, defaults, and charge-offs, which would reduce earnings, impair capital and potentially decrease liquidity.
The scope, timing and implementation details of the current administration and DOGE-initiated budget cuts, personnel reductions, contract reductions, and office space closures remain uncertain as of the date of this Annual Report on Form 10-K, making it difficult to predict or fully mitigate their impact. While we currently believe that the direct impact on our deposit base is relatively limited, broader economic weakness could still adversely affect deposit levels if our clients’ financial conditions worsen. There can be no assurance that our historical performance or our risk management practices will insulate us from the adverse effects of these federal spending cuts.
Our investment securities portfolio exposes us to risks beyond our market area.
As of December 31, 2024, 47.02% of our assets were invested in securities. The size and composition of the investment securities portfolio depends on the seasonality of deposits from political organization depositors, the concomitant need to maintain a higher degree of liquidity to meet the withdrawal needs of these depositors, and the demand for loans that meet our underwriting criteria.
We invest in a wide variety of securities, including U.S. government and agency obligations, taxable and non-taxable municipal bonds, including general obligation and revenue bonds, and investment grade corporate bonds. Under national banking laws, all bank-owned securities must be investment grade at the time of purchase. Investments in municipal and corporate bonds, in particular, expose us to the economic risks of communities and businesses across the country. If the economy were to enter a recession, the financial condition of many states and municipalities and of many corporations would likely weaken. Lower tax revenues could impair the ability of states and localities to repay their bond indebtedness. Similarly, lower corporate sales could impair the ability even of investment grade corporations to repay their indebtedness. Furthermore, although the Bank only purchases investment grade securities, it is possible that some of the corporate bonds it has purchased could be downgraded to below investment grade after the bank purchases them. The Bank seeks to broadly diversify its investment securities and to limit its exposure to any one bond issue, issuer or project, but there can be no assurance that we will not incur losses related to its investment activities.
Our significant investment in securities held to maturity exposes us to risks that may adversely affect our business, financial condition or results of operations.
As of December 31, 2024, 21.44% of our assets were invested in securities held to maturity (measured at amortized cost, net of allowance for credit losses), which subject us to certain risks that may adversely affect our business, financial condition or results of operations, including the following:
•Securities held to maturity are carried at amortized cost, and their fair value is not adjusted for changes in interest rates. Consequently, if interest rates rise, the fair value of our securities held to maturity would be expected to decline, but this decrease would not be immediately reflected in our net income or stockholders’ equity. However, this could result in significant unrealized losses. Further, if we were required to sell all or a material portion of our securities held to maturity, we may recognize significant losses that would adversely affect our business, results of operations or financial condition. See “— Interest Rate Risk — Interest rates have in the past resulted in, and could in the future result in, unrealized losses on our investment securities portfolio.” As of December 31, 2024, the carrying value (net of allowance for credit losses) of our securities held to maturity was $300.5 million, compared to a fair value of $279.0 million.
34
•In general, we cannot sell any of our securities held to maturity without potentially triggering a reclassification of our entire held to maturity securities portfolio to available for sale, except under specific circumstances permitted by accounting standards, causing all unrealized losses, marked to market and net of taxes, to be reflected in the accumulated other comprehensive loss component of our total stockholders’ equity and a decline in our tangible book value. This constraint would limit our ability to quickly reallocate our investment portfolio in response to changes in market conditions or liquidity needs. If we are required to sell securities held to maturity, including to meet liquidity needs, we may realize significant losses that would adversely affect our business, results of operations or financial condition.
•Changes in accounting standards or regulatory guidance could require us to reclassify our securities held to maturity, which would adversely affect our stockholders’ equity and could lead to increased volatility in our reported earnings and capital ratios. Additionally, future regulatory requirements may impose higher capital charges on securities held to maturity.
Any of these risks related to our securities held to maturity may be exacerbated by negative market perceptions or investor confidence. In particular, adverse changes, or perceptions of adverse changes, in market conditions or the financial health of the issuers of our securities held to maturity could lead to concerns about our financial condition or risk management practices.
There can be no assurance that we will be able to maintain or increase our current levels of transaction accounts, non-interest-bearing demand deposits, and levels of profitability or growth.
As of December 31, 2024, a substantial portion of our deposits were held in transaction accounts, most of which are non-interest-bearing accounts that offer an earnings credit to offset service charges in lieu of interest. Transaction accounts have comprised over 50% of the Bank’s total deposits at each year-end since 2014. As of December 31, 2024, 93.3% and 73.1% of the Company’s deposits were in transaction accounts and non-interest-bearing accounts, respectively. There can be no assurance that the high levels of transaction accounts or non-interest-bearing demand deposits will continue to be held by the Bank, or that they will not decline, and there can be no assurance that the Bank will be able to replace any such deposits at a similar cost, or increase its lending business on a profitable basis. There can be no assurance that we will be able to maintain profitability, continue to grow in a profitable manner, or increase our book value per share, which is one of the metrics we use to measure our performance.
We place a significant portion of our clients’ deposits with other banks through the ICS® network, which exposes us to risks that may adversely affect our business, financial condition or results of operations.
We participate in the ICS® network to provide our clients with additional FDIC insurance coverage for their uninsured balances. For our clients that opt into the ICS® network, this service allows us to place their deposits in increments up to the FDIC insurance limits at other banks within the ICS® network. In exchange, we may elect to either receive reciprocal deposits from other banks within the ICS® network or place the deposits at other banks as One-Way Sell® deposits and receive a deposit placement fee. If we elect to receive reciprocal deposits from other banks, the amount of deposits on our balance sheet does not decrease and we earn interest income on these reciprocal balances. Conversely, if we elect to receive a deposit placement fee instead of receiving reciprocal deposits, the deposits are placed at other banks as One-Way Sell® deposits, which reduces the amount of deposits on our balance sheet. This reduction allows us to better manage the size of our balance sheet, and the deposit placement fee increases our non-interest income. See “Management’s Discussion and Analysis of Financial Condition and Results of Operations — Financial Condition — Deposits” for more information on ICS® deposits.
As of December 31, 2024, we placed $193.6 million of deposits at other banks through the ICS® network, of which $63.3 million were placed as One-Way Sell® deposits and $130.3 million were retained as reciprocal deposits. Our deposit placement services income totaled $6.2 million for the year ended December 31, 2024. If we were to convert some or all of these One-Way Sell® deposits into reciprocal deposits, bringing them back onto our balance sheet, we would likely gain interest income by investing these deposits, which could increase our net interest income. However, this conversion would result in the loss of deposit placement services income, reducing our non-interest income. Furthermore, we would likely incur interest expense on the reciprocal deposits, which could increase our cost of interest-bearing liabilities and overall cost of funds, and could lower our net interest margin. Additionally, bringing these deposits onto our balance sheet would lead to higher regulatory assessments from both the OCC and the FDIC. The increase in our total assets would raise the base on which these assessments are calculated, and the additional deposits could also impact our risk profile, potentially resulting in higher FDIC risk-based assessments. Additionally, we would be required to pay IntraFi’s fee for the reciprocal
35
feature, which as of December 31, 2024 was 0.125% annualized on the reciprocal deposits balance. While increased interest expense might reduce our net interest margin, the additional interest income could still lead to higher net interest income. Despite this potential benefit, there remains a risk of pressure on our margins and regulatory capital ratios, which could impact our business, financial condition, or results of operations. Additionally, if more than 20% of our total liabilities are classified as reciprocal deposits, the FDIC may categorize the excess over 20% as “brokered deposits.” As a result of the foregoing, our use of the ICS® network exposes us to potential costs and risks that are not incurred with traditional deposit accounts, and if we fail to adequately manage these costs and risks, our business, financial condition, or results of operations could be adversely affected.
If we or our clients are no longer able to participate in the ICS® network, including because IntraFi terminates our participation in the ICS® network, the ICS® network ceases or because of regulatory changes, we may experience deposit withdrawals, lose revenue from deposit placement fees, or experience a sudden increase in our balance sheet that could adversely affect our regulatory capital ratios. In order to sell a client’s deposits through the ICS® network, the client must first opt into the ICS® network, and not all of our clients have opted into the ICS® network, nor can all of our clients be expected to opt into the ICS® network in the future. Further, our ability to provide our clients with deposit placement services through the ICS® network depends on the participation of other banks within the ICS® network, and any issues affecting these banks, including concerns related to participating banks’ financial stability, could disrupt our ability to provide these services to our clients. Participation in the ICS® network is also subject to certain terms and conditions, which include limitations on the amount of each participating client’s ICS® deposits that may be placed at other banks within the ICS® network, on the maximum amount of deposits that a bank may place at other banks as reciprocal deposits, on the maximum amount of deposits that a bank may place at other banks as One-Way Sell® deposits, and limitations on a bank’s ability to receive reciprocal deposits, place One-Way Sell® deposits, or receive One-Way Buy® deposits if the bank is not “well capitalized” under the applicable federal banking regulations. In addition, our ability to move additional deposits from existing accounts off our balance sheet by converting reciprocal deposits into One-Way Sell® deposits is limited to the amount of such deposits that are placed at other banks as reciprocal deposits. As of December 31, 2024, we held $130.3 million in reciprocal deposits that could be converted into One-Way Sell® deposits, compared to the $63.3 million that had already been placed at other participating banks as One-Way Sell® deposits. Any of these conditions could adversely affect our business, financial condition or results of operations.
Our Trust & Wealth Department exposes us to certain risks and there can be no assurance the department will contribute meaningfully to our revenues or become profitable on a standalone basis.
Our Trust & Wealth Department exposes us to certain risks. The department, which began operations in the third quarter of 2020 after receiving approval from the OCC for fiduciary powers, manages a variety of trusts, including special needs trusts. The products and services provided by the department include trustee services, investment management, financial planning, estate administration, and custody. Risks specifically related to our Trust & Wealth Department include:
•Fiduciary Duty Compliance: We have a legal obligation to act in the best interests of our clients, which includes the duty to manage trust assets prudently. Failure to comply with these fiduciary duties can result in legal claims and significant financial liability.
•Litigation Risks: Trust and estate matters often involve disputes among beneficiaries or between beneficiaries and trustees. These disputes can lead to litigation, which can be costly and time-consuming, potentially resulting in substantial legal expenses and damages.
•Regulatory Compliance: The Trust & Wealth Department is subject to stringent regulatory oversight by federal and state authorities. Non-compliance with fiduciary regulations can lead to enforcement actions, fines, and other regulatory sanctions that could adversely affect our operations and reputation.
•Market Risks: Investment management services provided by the Trust & Wealth Department are exposed to market risks. Poor investment performance can result in claims of mismanagement or breach of fiduciary duty, leading to potential legal liabilities.
•Personnel Risks: The success of our Trust & Wealth Department heavily relies on retaining specialized trust and wealth management personnel. The market for such skilled professionals is highly competitive. Losing key personnel could adversely impact our ability to manage trust accounts effectively and meet client expectations.
36
•Risks Specific to Special Needs Trusts: Managing special needs trusts exposes us to additional risks. These trusts are designed to provide financial support to individuals with disabilities without affecting their eligibility for government benefits like Medicaid and Supplemental Security Income (SSI). However, the rules governing these trusts are complex and state-specific. Failure to adhere to these rules can disqualify the trust, leading to the loss of benefits for the beneficiary and potential legal liabilities for the trustee.
In addition, the service charges we receive for assets under management are subject to fluctuations in the value of the underlying assets. These values can vary with changes in the stock market and bond yields. Consequently, any significant market volatility or changes in interest rates could impact the valuation of the assets we manage, thereby affecting the service charges we collect and potentially influencing our overall revenue from these accounts. Further, the growth in assets under custody during recent periods has been largely driven by clients seeking higher interest rates. If interest rates were to decline materially, we may experience a corresponding decline in custody balances, which would negatively impact our revenue from these accounts. In addition, a substantial portion of these custody accounts balances are related to political organizations, and these balances are considered to be seasonal and are likely to decline as a result of the spending around federal elections. Any of these conditions could adversely affect our business, financial condition or results of operations.
Our Trust & Wealth Department’s assets under management are concentrated among a small number of clients. As of December 31, 2024, we had four clients with accounts that each exceeded 5.0% of our total assets under administration, all within the custody segment. These four clients collectively accounted for 35% of our total assets under administration. If we experience outflows of our assets under management, particularly those associated with significant account sizes, our services charges would decline, which would negatively impact our Trust & Wealth Department revenue.
Our Trust & Wealth Department generated revenues of approximately $907 thousand for the year ended December 31, 2024 and $565 thousand for the year ended December 31, 2023, but has not achieved standalone profitability. There can be no assurance that the Trust & Wealth Department will contribute meaningfully to our revenues or become profitable on a standalone basis. The unpredictability of assets under management and associated revenue further complicates our financial planning. Additionally, the highly competitive and commoditized nature of the wealth management industry poses ongoing challenges to our trust and asset management business.
We may be adversely affected by changes in the actual or perceived soundness or condition of other financial institutions.
Financial services institutions may be interconnected as a result of trading, investment, liquidity management, clearing, counterparty and other relationships. Within the financial services industry, loss of public confidence, including through default by any one institution, could lead to liquidity challenges or to defaults by other institutions. Concerns about, or a default by or failure of, one institution could lead to significant liquidity problems and losses or defaults by other institutions, as the commercial and financial soundness of many financial institutions is closely related as a result of these credit, trading, clearing and other relationships. Even the perceived lack of creditworthiness of, or questions about, a counterparty may lead to market-wide liquidity problems and losses or defaults by various institutions. This systemic risk may adversely affect financial intermediaries, such as clearing agencies, banks and exchanges with which we interact on a daily basis or key funding providers such as the FHLB, any of which could have a material adverse effect on our access to liquidity or otherwise have a material adverse effect on our business, financial condition and results of operations.
In addition, our securities portfolio includes investments in other financial institutions. As of December 31, 2024, we held $4.5 million principal amount of subordinated debt issued by other bank holding companies. Any changes to the actual or perceived soundness of other financial institutions could adversely affect the value of these securities, which could cause us to incur losses.
There is no assurance that the Bank will be able to compete successfully with others for its business.
The Bank competes for loans, deposits, fiduciary services and capital with other banks and other kinds of financial institutions and enterprises, such as securities firms, insurance companies, savings and loan associations, credit unions, mortgage brokers, and private lenders, many of which have substantially greater resources or are subject to less stringent regulations. The differences in resources and regulations may make it more difficult for the Bank to compete profitably, including because the Bank may be required to reduce the rates that it charges on loans and investments or increase the rates it offers on deposits in order to compete, which would adversely affect the Bank’s business, financial condition and results of operations. Further, the Bank’s profitability, in large part, results from its ability to maintain high levels of non-
37
interest-bearing demand deposits, which are provided by campaigns and elections industry clients. There can be no assurance that the Bank will be able to effectively compete to maintain or grow its current share of deposits from these businesses and organizations.
We could fail to attract, retain or motivate skilled and qualified personnel, including our senior management, other key employees or directors, which could adversely affect our business.
Our ability to implement our strategic plan depends on our ability to attract, retain and motivate skilled and qualified personnel, including our senior management and other key employees and directors. The marketplace for skilled personnel is becoming more competitive, and the cost of hiring, incentivizing and retaining skilled personnel may continue to increase, which may be exacerbated by government policies, including immigration policy. The failure to attract or retain, including as a result of an untimely death or illness of key personnel, or replace a sufficient number of appropriately skilled and key personnel could place us at a competitive disadvantage and prevent us from successfully implementing our strategy. In addition, high employee turnover rates or inadequate training could lead to operational inefficiencies, loss of critical knowledge, and increased susceptibility to errors and misconduct. The ongoing shortage of skilled cybersecurity professionals poses a risk to our ability to effectively defend against and respond to cyber threats. Difficulty in attracting or retaining skilled cybersecurity professionals could also weaken our ability to defend against and respond to cyber threats, increasing the likelihood of successful cyberattacks. Any of the foregoing could have a material adverse effect on our business, financial condition and results of operations.
In addition, our business is service-oriented and depends to a large extent upon the client relationships that our senior officers, relationship officers, and operations department team members develop and maintain, particularly with clients that maintain high levels of transaction account deposits. Any deterioration in such relationships, particularly those associated with significant deposit size, could lead to an outflow of deposits. See “— Liquidity Risk — Our deposit base is concentrated among a small number of clients.”
Accordingly, if we are unable to retain any of our executive officers, including our Chairman, Peter G. Fitzgerald, our Chief Executive Officer John J. Brough, our President, David M. Evinger, our Chief Financial Officer, Joanna R. Williamson, other senior officers, relationship officers, or operations department team members, our business, results of operations, and financial condition could be adversely affected.
Certain clients, including our political organization clients, may be subject to, and are particularly sensitive to, negative publicity, which may subject us to enhanced reputational risk.
Certain clients, including political organizations may be sensitive to public opinion and if we are not able to effectively manage negative publicity regarding the Bank or our client relationships, our relationships with these clients could suffer, which could lead to deposit withdrawals. As a public company, we and our relationships with our clients may be subject to increased public scrutiny, and certain of our clients may move their deposit accounts to other nonpublic institutions that they perceive as providing greater privacy. Further, if our clients are subject to negative publicity, our association with such clients may, in turn, cause us to be subject to negative publicity, which could harm our reputation and the public perception of our business. Any of these conditions could adversely affect our business, financial condition and results of operations.
Fulfilling our public company financial reporting and other regulatory obligations and being a public company will be expensive and time consuming and may strain our resources.
In October 2024, we completed our initial public offering of our Class A common stock and became a public company. As a public company, we are subject to the reporting requirements of the Exchange Act and are required to implement specific corporate governance practices and adhere to a variety of reporting requirements under the Sarbanes-Oxley Act and the related rules and regulations of the SEC, as well as the rules of NYSE. The Exchange Act requires us to file annual, quarterly and current reports with respect to our business and financial condition. The Sarbanes-Oxley Act requires, among other things, that we maintain effective disclosure controls and procedures and internal control over financial reporting. Compliance with these requirements places additional demands on our legal, accounting, finance, operations and investor relations staff and on our accounting, financial and information systems, and increases our legal and accounting compliance costs as well as our compensation expense as we have hired and expect to continue to hire additional legal, accounting, tax, finance and investor relations staff. We expect to incur additional incremental ongoing expenses in connection with being a public company.
38
In accordance with Section 404 of the Sarbanes-Oxley Act, our management is required to conduct an annual assessment of the effectiveness of our internal control over financial reporting and include a report on these internal controls in the annual reports we will file with the SEC on Form 10-K. Our independent registered public accounting firm will not be required to formally attest to the effectiveness of our internal controls until we are no longer an emerging growth company and no longer a non-accelerated filer. When required, this process will require significant documentation of policies, procedures and systems, review of that documentation by our accounting staff and our outside independent registered public accounting firm and testing of our internal control over financial reporting by our accounting staff and our outside independent registered public accounting firm. This process will involve considerable time and attention, may strain our internal resources and will increase our operating costs. We may experience higher than anticipated operating expenses and outside auditor fees during the implementation of these changes and thereafter. If our independent registered public accounting firm is unable to express an opinion as to the effectiveness of our internal control over financial reporting, investors may lose confidence in the accuracy and completeness of our financial reports and the market price of our Class A common stock could be negatively affected, and we could become subject to investigations by NYSE, the SEC or other regulatory authorities, which could require additional financial and management resources.
We have not engaged our independent registered public accounting firm to perform an audit of our internal control over financial reporting, as contemplated by Section 404 of the Sarbanes-Oxley Act, as of any balance sheet date reported in our financial statements. Had our independent registered public accounting firm performed an audit of our internal control over financial reporting, control deficiencies, including material weaknesses and significant deficiencies, may have been identified.
If we are unable to continue to meet the demands that will be placed upon us as a public company, including the requirements of the Sarbanes-Oxley Act, we may be unable to accurately report our financial results, or report them within the time frames required by law or stock exchange regulations. Failure to comply with the Sarbanes-Oxley Act, when and as applicable, could also potentially subject us to sanctions or investigations by the SEC or other regulatory authorities. If material weaknesses or other deficiencies occur, our ability to accurately and timely report our financial position could be impaired, which could result in late filings of our annual and quarterly reports under the Exchange Act, restatements of our consolidated financial statements, a decline in our stock price, or suspension or delisting of our Class A common stock from NYSE and could have a material adverse effect on our business, results of operations and financial condition. Even if we are able to report our financial statements accurately and in a timely manner, any failure in our efforts to implement the improvements or disclosure of material weaknesses in our future filings with the SEC could cause our reputation to be harmed and our stock price to decline significantly.
Operational Risks
We are subject to operational risk, which could adversely affect our business and reputation and create material legal and financial exposure.
Like all businesses, we are subject to operational risk, which represents the risk of loss resulting from human error or misconduct, inadequate or failed internal processes and systems, and external events, including the risk of loss resulting from fraud by employees or persons outside the Bank, and breaches in data security. For example, because the Bank engages in a high volume of funds transfer activity, we may be subject to a greater degree of payment risk than other similarly-sized banks.
See “Operational risks associated with funds transfer activities could adversely affect our business and financial condition.” We are also exposed to operational risks through outsourcing arrangements, as such outsourcing vendors, which are exposed to operational risks themselves, as well as the effects that changes in circumstances or capabilities of our outsourcing vendors can have on our ability to continue to perform operational functions necessary to our business. Prolonged or significant failures or disruptions in our information technology systems, including due to hardware malfunctions, software or coding errors, or natural disasters, could disrupt our business operations and impact customer service which could lead to a loss of business, reduced customer satisfaction, damage to our reputation and regulatory scrutiny. For example, in July 2024 there was a widely publicized information technology outage as a result of a faulty update to a cybersecurity software product that affected many businesses worldwide.
Although we seek to mitigate operational risk through a system of internal controls and risk management practices that are reviewed and updated, no system of controls or practices, however well designed and maintained, are infallible. Control weaknesses or failures or other operational risks could result in charges, increased operational costs, business continuity deficiencies, harm to our reputation or foregone business opportunities.
39
Operational risks associated with funds transfer activities could materially and adversely affect our business, financial condition, and results of operations.
We process a high volume of funds transfers, which expose us to significant operational, regulatory, and financial risks. Our most substantial exposure arises from our use of the Fedwire® Funds Service. We frequently process high-value Fedwire® transfers, including transactions representing a significant percentage of our total capital, and have, at times, sent or received transfers exceeding our total capitalization. We expect to continue processing similarly large transfers, which may significantly increase our financial exposure.
We also offer funds transfers through the Automated Clearing House (“ACH”), real-time funds transfer networks, and peer-to-peer services such as Zelle®. We are currently configured as “receive-only” for FedNow® and RTP®, but we may enable outbound transfers in the future. We may join additional transfer networks or enable other types of funds transfers, which could introduce further operational, compliance, and financial risks. Any expansion of these services may increase our operational and compliance exposure, particularly through participation in new or emerging funds transfer networks whose risks we cannot fully assess. Our funds transfer operations involve the following principal risks:
•Processing Errors: Errors in executing or settling transfers, particularly within real-time gross settlement systems such as Fedwire®, could result in misdirected, delayed, or improperly returned transfers, creating financial exposure potentially exceeding our liquidity or capitalization.
•Regulatory and Network Compliance Risks: Failure to comply with federal and state laws and regulations governing funds transfers—including Federal Reserve Regulation J (covering Fedwire® and FedNow®), Regulation E (consumer electronic funds transfers), and UCC Article 4A (certain payment systems)—may result in regulatory enforcement actions, monetary fines, litigation, or reputational harm. Additionally, failure to comply with rules or contractual obligations of payment networks, such as those for FedNow®, RTP®, Same-Day ACH, or Zelle®, may lead to penalties, restricted system access, or reputational damage.
•Funds Transfer Cancellation Risks: Attempts to cancel transfer orders or honor a sender’s cancellation request after the transfer order has been executed or accepted may expose us to liability under Regulation J, UCC Article 4A, and OC 6. Such cancellations could result in disputes, litigation, or financial losses arising from miscommunications or timing errors.
•Litigation Risks from Funds Transfers: We have previously been involved in litigation related to Fedwire® transfers. See “Litigation and regulatory actions, including possible enforcement actions, could subject us to significant fines, penalties, judgments, restrictions on our business activities, or reputational harm.” Future litigation may arise, particularly concerning high-value transfers, transfer holds, or cancellation disputes. Expanding into additional funds transfer services may further increase legal risks related to new transfer platforms, transaction disputes, or compliance failures.
•System Disruption Risks: Cyberattacks or system failures could disrupt our ability to process funds transfers, especially time-sensitive transfers, and expose us to operational disruptions, liability, or regulatory non-compliance.
•Liquidity Management Risks: Faster funds transfer systems such as RTP and FedNow® operate on instant gross settlement, eliminating settlement risk but requiring immediate funding availability. We typically maintain a significant portion of our assets in cash reserves at the Federal Reserve. However, RTP requires participants to pre-fund accounts at The Clearing House, where the interest earned may be lower than the Interest on Reserve Balances (“IORB”) rate paid on reserves held at the Federal Reserve. This difference in yield could affect our net interest income if we must maintain larger balances at The Clearing House. By contrast, FedNow® operates on real-time settlement but does not require pre-funding, and Same-Day ACH follows a net settlement model, which increases credit risk but reduces liquidity demands. Introducing additional funds transfer services with similar funding requirements could necessitate adjustments to our liquidity management strategy to optimize returns while maintaining sufficient reserves.
•Reliance on External Providers: Our reliance on external service providers increases our exposure to operational and vendor-related risks, particularly concerning funds transfer connectivity, international wire transfers, and the introduction of new funds transfer services.
40
•Fraud and Cybersecurity Risks: Cybersecurity breaches or fraudulent activities could cause unauthorized transfers, regulatory sanctions, financial loss, or reputational harm.
Although we maintain security controls, monitoring protocols, employee training, and compliance oversight, these measures may not fully mitigate the inherent risks associated with funds transfer activities. Expanding or modifying our funds transfer services could introduce unforeseen risks that could materially and adversely affect our business, financial condition, and results of operations.
The occurrence of fraudulent activity, breaches or failures of our information security controls or cybersecurity-related incidents could have a material adverse effect on our business, financial condition, results of operations, and reputation.
As a financial institution, we are susceptible to evolving cybersecurity threats, including attacks by cybercriminals, nation-state actors, insiders, and risks associated with rapid advancements in technology such as quantum computing, sophisticated artificial intelligence (AI), and other emerging technologies, which may compromise existing security measures. Fraudulent activity, information security breaches, and cyberattacks may target us, our service providers, or our clients, potentially resulting in financial losses, operational disruptions, unauthorized disclosure of sensitive or confidential information, misappropriation of assets, regulatory scrutiny, litigation, or significant reputational harm.
Fraudulent activity may manifest in numerous forms, including check fraud, electronic fraud, wire fraud, phishing, business email compromise, social engineering, identity theft, and other dishonest activities. Information security breaches and cybersecurity incidents may involve unauthorized access or compromise of systems used by us, our service providers, or our clients; denial-of-service or distributed denial-of-service attacks; ransomware; malware; insider-threats; exploitation of third-party vulnerabilities (such as cloud services, web browsers, or operating systems); quantum-enabled attacks on encrypted communications or stored data; physical damage to critical infrastructure; or human errors resulting in data leaks or system compromises. Several major corporations, including financial institutions, have experienced significant data breaches that exposed proprietary corporate information as well as sensitive financial and personal data of their clients and employees, heightening their vulnerability to fraud.
Our clients are also subject to growing risks related to identity theft, credit and debit card fraud, account takeover attempts, and unauthorized account access, particularly as technological advancements, such as quantum computing, threaten conventional encryption standards and protocols before quantum-resistant cryptographic solutions become widely adopted. We and our service providers have in the past been, and may in the future be, the target of electronic fraudulent activity, security breaches, and cyberattacks. Our extensive reliance on mobile and cloud technologies, as well as remote work arrangements, significantly expands our attack surface, increasing the risk of unauthorized access, data breaches, and cybersecurity incidents. Additionally, because we operate without a traditional branch network and instead rely heavily on digital channels, security breaches may disproportionately affect us compared to banks with multiple physical locations.
Rapid technological advancements — including quantum computing, artificial intelligence, machine learning, and other advanced technologies — significantly increase cybersecurity threats by potentially enabling threat actors to more effectively decrypt sensitive information, circumvent authentication mechanisms, exploit vulnerabilities within our security infrastructure, or otherwise compromise our systems. Failure to promptly adapt to and effectively implement security measures in response to rapidly evolving technological threats could significantly heighten our risks of data breaches, financial fraud, operational disruptions, regulatory scrutiny, reputational harm, and financial losses.
Additionally, the rising sophistication of cyberattacks by criminal groups, state-sponsored entities, and vulnerabilities within third-party technologies could undermine critical security processes relied upon by us, our service providers, and our clients. Increasingly sophisticated AI-driven attacks could enable threat actors to more effectively predict and circumvent security protocols and detection systems, significantly escalating our cybersecurity risk.
Because our clients include high-profile political organizations, we face an elevated risk of targeted cyberattacks aimed at compromising client data, disrupting operations, or conducting cyber espionage, disinformation campaigns, or targeted data leaks. Such successful attacks could damage client relationships, deter future business, and severely harm our reputation, financial condition, and overall business prospects.
Although we have implemented cybersecurity defenses, including multi-factor authentication, monitoring, penetration testing, employee cybersecurity awareness training, incident response protocols, and ongoing assessments of industry best practices, we cannot assure complete protection against sophisticated cybersecurity threats. Our inability to
41
anticipate, prevent, detect, or promptly respond to cybersecurity incidents could result in substantial financial losses, regulatory actions, litigation, reputational harm, and operational disruptions. Additionally, our cybersecurity insurance coverage may contain limitations, exclusions, or coverage gaps that could leave us liable for significant uncovered losses resulting from cybersecurity incidents.
Moreover, widespread publicity surrounding cybersecurity breaches in the financial sector could erode consumer confidence in digital banking services and online financial transactions, potentially deterring adoption of our services and adversely impacting our business operations.
All these factors could materially and adversely affect our business, financial condition, results of operations, and reputation.
We also face risks related to cyberattacks and other security breaches involving external, third-party vendors and counterparties.
Information pertaining to us and our clients is maintained, and transactions are executed, on networks and systems maintained by us, our clients and certain of our third-party vendors, such as our online banking or reporting systems. The secure maintenance and transmission of confidential information, as well as execution of transactions over these systems, are essential to protect us and our clients against fraud and security breaches and to maintain our clients’ confidence. Our use of cloud computing services and associated reliance on third-party cloud providers could limit our ability to control or effectively audit our data and systems, potentially leading to operational vulnerabilities, including exposing us to the risk of service outages. There have been a number of widely publicized cases of outages in connection with access to cloud computing providers. Some of these parties have in the past been, and may in the future be, the target of security breaches and cyberattacks, and because the transactions involve third parties and environments such as the point of sale that we do not control or secure, future security breaches or cyberattacks affecting any of these third parties could impact us through no fault of our own, and in some cases we may have exposure and suffer losses for material breaches or attacks relating to them. Although we are not aware of any material losses relating to cybersecurity incidents, there can be no assurance that unauthorized access or cybersecurity incidents will not become known or occur or that we will not suffer such losses in the future.
Additionally, we may not be able to ensure that our third-party vendors have appropriate controls in place to protect the confidentiality of the information they receive from us and our business, financial condition and results of operations could be adversely affected by a material breach of, or disruption to, the security of any of our or our vendors’ systems.
Our operations rely on certain external vendors, and our use of these vendors is subject to increasing regulatory requirements and attention.
Our business model of a single banking office serving a nationwide client base is dependent on relationships with third-party service providers that provide services, primarily information technology services, that are critical to our operations. We use external vendors to provide products and services necessary to maintain our day-to-day operations, including core banking services such as online banking, loan servicing, debit and credit card services, mortgage origination, trust accounting and wealth management and other key components of our business infrastructure, including data processing and storage, internet connection and network access and various information technology services and services complementary to our banking products. In particular, we rely on a core technology provider for the banking software used by our clients and operations personnel. Accordingly, our operations are exposed to the risk that these vendors, including our core technology provider, will not perform in accordance with the contracted arrangements or under service-level agreements. We are also subject to the risk that these vendors, including our core technology provider, become unable or unwilling to provide the same products or services on terms that are acceptable to us.
We are also exposed to the risk that a cyberattack, security breach, other information technology incident or other operational disruption at a common vendor to our third-party service providers, including our core technology provider, could impede their ability to provide services to us. See “We also face risks related to cyberattacks and other security breaches involving external, third-party vendors and counterparties.”
We may not be able to effectively monitor or mitigate operational risks relating to the use of common vendors by third-party service providers, including our core technology provider. If any of our third-party service providers experience difficulties in providing services or terminate their services and we are unable to replace our service providers with other service providers, our operations could be interrupted. It may be difficult for us to replace some of our third-party vendors,
42
particularly vendors providing our core banking, mortgage-servicing and debit card services and information services, in a timely manner if they are unwilling or unable to provide us with these services in the future for any reason. If an interruption were to continue for a significant period, it could have a material adverse effect on our business, financial condition and results of operations. Even if we are able to replace them, it may be at higher cost to us, which could have a material adverse effect on our business, financial condition and results of operations. In addition, if a third-party provider fails to provide the services we require, fails to meet contractual requirements, such as compliance with applicable laws and regulations, or suffers a cyberattack or other security breach, our business could suffer economic and reputational harm that could have a material adverse effect on our business, financial condition and results of operations.
Furthermore, recent regulation requires us to enhance our due diligence, ongoing monitoring and control over our third-party vendors and other ongoing third-party business relationships. In certain cases, we may be required to renegotiate our agreements with these vendors to meet these enhanced requirements, which could increase our costs. We expect that our regulators would hold us responsible for deficiencies in our oversight and control of our third-party relationships and in the performance of the parties with which we have these relationships, including in connection with the improper use or disclosure of confidential information, which could also harm our reputation, financial position and current and future business relationships. As a result, if our regulators conclude that we have not exercised adequate oversight and control over our third-party vendors or other ongoing third-party business relationships or that such third parties have not performed appropriately, we could be subject to enforcement actions, including civil money penalties or other administrative or judicial penalties or fines, as well as requirements for client remediation, any of which could have a material adverse effect our business, financial condition and results of operations. In June 2023, the U.S. federal banking agencies issued an interagency guidance, which requires banks, such as us, to analyze the risk associated with each third-party relationship and to calibrate its risk management processes. Any future changes in requirements or standards applicable to our third-party relationships could negatively affect us in substantial and unpredictable ways, and increase our costs. All of which could have a material adverse effect on our business, financial condition and results of operations.
The development and use of artificial intelligence present risks and challenges that may adversely impact our business.
We have incorporated, and may in the future further incorporate, AI technology in certain business processes, services, and products, including technologies that process sensitive financial and/or personal data. We rely exclusively on third-party AI models developed by external providers and do not develop, modify, or train proprietary AI models in-house. These AI technologies assist in drafting documents and communications, conducting research, and enhancing operational efficiency. Additionally, certain third-party vendors, clients, and counterparties may integrate AI technology into their own business processes, services, or products, which may directly or indirectly impact us.
The development and use of AI present a number of legal, regulatory, and operational risks to our business. The legal and regulatory landscape governing AI is highly dynamic, with evolving laws and regulations that include both AI-specific mandates and provisions within existing frameworks such as intellectual property, privacy, consumer protection, employment, and financial services laws. These changes could require modifications to our AI implementations, impose additional compliance burdens, and increase our exposure to regulatory enforcement and litigation. For example, data privacy and security requirements under laws such as the Gramm-Leach-Bliley Act (“GLBA”) impose stringent obligations to safeguard consumer financial information, and the use of AI in processing such data may raise compliance challenges or expose us to legal liability, regulatory penalties, or other enforcement actions.
AI models, particularly generative AI models, may produce inaccurate, misleading, or unreliable outputs, disclose private, confidential, or proprietary information, reflect biases embedded in training data, or generate content that is perceived as discriminatory, defamatory, or in violation of intellectual property rights. If AI-generated outputs are relied upon for business decisions or client interactions, we could face significant legal, financial, and reputational risks.
Although we have implemented policies requiring employees to review AI-generated content for accuracy, relevance, and completeness, and prohibiting the use of personally identifiable or nonpublic information with AI technologies unless expressly authorized, employees could inadvertently or intentionally upload personally identifiable client data into third-party AI models in violation of the GLBA or other applicable privacy laws, potentially leading to unauthorized disclosure of confidential client information, regulatory penalties, legal liability, or reputational harm. We cannot guarantee that employees will consistently adhere to these policies or that such policies will be sufficient to fully mitigate AI-related risks. Furthermore, AI technologies themselves may be susceptible to vulnerabilities that could result in improper disclosure, misuse, or unauthorized access to sensitive data.
43
Because we rely exclusively on third-party AI models, we do not have direct oversight or control over how these models are developed, trained, or maintained. The proprietary nature of these AI models means that we lack visibility into the data sources, methodologies, and risk mitigation strategies employed by third-party AI providers. If an AI model incorporates unauthorized material, improperly sources training data, or fails to implement adequate controls against bias, discrimination, or intellectual property infringement, we may be exposed to liability for the model’s outputs, despite lacking any control over its development.
Additionally, AI-generated content could lead to regulatory and legal concerns if the outputs result in inaccurate, misleading, or deceptive communications. Regulations governing financial institutions may require institutions to provide accurate, non-misleading information in customer interactions, and if AI-generated outputs violate these standards, we could face regulatory scrutiny, penalties, or legal action.
Advancements in AI capabilities, including potential interactions with quantum computing, may further compound these risks. Quantum-enhanced AI models could accelerate data processing but may also intensify concerns regarding privacy breaches, algorithmic bias, or the ability of AI-generated deepfakes or synthetic data to be used fraudulently.
Any of these risks could expose us to regulatory enforcement actions, civil liability, reputational damage, and erosion of client trust. Additionally, adverse public perception regarding AI risks, including concerns about bias, fairness, and privacy, could negatively affect our relationships with clients, vendors, regulators, and other stakeholders. If AI-related risks materialize, our business, results of operations, and financial condition could be materially and adversely affected.
We depend on the accuracy and completeness of information about clients and counterparties.
In deciding whether to extend credit or enter into other transactions, and in evaluating and monitoring our loan and lease portfolio on an ongoing basis, we typically rely on information furnished by or on behalf of clients and counterparties, including financial statements, credit reports and other financial information. We may also rely on representations of those clients or counterparties, or of other third parties, such as independent auditors, as to the accuracy and completeness of that information. Reliance on inaccurate, incomplete, unaudited, fraudulent or misleading financial statements, credit reports or other financial or business information, or the failure to receive such information on a timely basis, could result in loan and lease losses, reputational damage or other effects that could have a material adverse effect on our business, financial condition and results of operations.
Our reliance on estimates and risk management activities may not always prevent or mitigate risks effectively, leading to potential differences between actual results and our forecasts.
Our accounting policies and methods are fundamental to how we record and report our financial condition and results of operations. Our management must exercise judgment in selecting and applying many of these accounting policies and methods so they comply with GAAP and reflect management’s judgment of the most appropriate manner to report our financial condition and results. In some cases, management must select the accounting policy or method to apply from two or more alternatives, any of which may be reasonable under the circumstances, yet which may result in our reporting materially different results than would have been reported under a different alternative.
Certain accounting policies are critical to presenting our financial condition and results of operations. They require management to make difficult, subjective or complex judgments about matters that are uncertain. Materially different amounts could be reported under different conditions or using different assumptions or estimates. These critical accounting policies include the allowance for credit losses and fair value measurements related to investment securities. Because of the uncertainty of estimates involved in these matters, we may be required to significantly increase the allowance for credit losses or sustain losses that are significantly higher than the reserve provided or reduce the carrying value of an asset measured at fair value. Any of these could have a material adverse effect on our business, financial condition and results of operations. See “Management’s Discussion and Analysis of Financial Condition and Results of Operations — Critical Accounting Policies and Estimates.”
Our internal controls, disclosure controls, processes and procedures and corporate governance policies and procedures are based in part on certain assumptions and can provide only reasonable (not absolute) assurances that the objectives of the system are met. Any failure or circumvention of our controls, processes and procedures or failure to comply with regulations related to controls, processes and procedures could necessitate changes in those controls, processes and procedures, which may increase our compliance costs, divert management attention from our business or subject us to regulatory actions and increased regulatory scrutiny.
44
We have established policies and procedures intended to identify and manage the types of risk to which we are subject, including credit risk, interest rate risk, liquidity risk, price risk, operational risk, cyber risk, compliance risk, fiduciary risk, strategic risk and reputation risk. There are inherent limitations to our risk management strategies as there may exist, or develop in the future, risks that were not appropriately anticipated or identified. In addition, we rely on both qualitative and quantitative factors, including models, to monitor, measure and analyze certain risks and to estimate certain financial values, which are subject to error. For example, we estimate the proportion of our deposits that are represented by political organizations, in part to manage the risks related to such deposits. See “— Liquidity Risk — Our deposits are concentrated in political organizations, which can vary significantly in volume due to seasonality or changes in political activity or campaign finance laws.” Our estimates of the proportion of our deposits that are represented by political organizations are subject to data limitations and identifying a client as a political organization sometimes requires judgment. If our risk management activities prove ineffective, including due to inaccurate estimates, we could suffer unexpected losses or become subject to litigation or negative regulatory action, any of which could affect our business, financial condition, results of operations, or reputation.
Legal, Regulatory and Compliance Risks
Government regulation significantly affects our business and may result in increased compliance costs, operational restrictions, and reduced stockholder returns.
The banking industry is subject to extensive regulation. Banking laws and regulations are primarily intended to safeguard the federal deposit insurance fund (“DIF”), depositors, and consumers, rather than stockholders or other investors. The Bank is regulated and supervised by the OCC and the FDIC, while the Company is regulated by the Federal Reserve. This regulatory framework imposes a significant compliance burden that may place banks at a competitive disadvantage relative to less-regulated nonbank financial institutions, including finance companies, mortgage-banking companies, private credit lenders, broker-dealers, business development companies, technology-driven nonbank lenders, money transmitters, leasing companies, and credit unions. Credit unions, while overseen by the National Credit Union Administration (“NCUA”), benefit from a tax-exempt status under federal law, providing them with a competitive cost advantage over taxable banking institutions like the Bank. The rapid emergence of financial technology (“fintech”) firms and digital banking platforms further intensifies competition by expanding the range of nonbank alternatives, placing additional pressure on traditional banking models. Changes in laws, regulations, or interpretations thereof may increase our compliance costs, restrict our operational flexibility, and adversely impact profitability. Additionally, amendments to non-banking laws, such as tax laws, could disproportionately affect us due to their application to banks, our corporate structure, or our specific service offerings, potentially exacerbating these competitive and financial pressures.
New or revised regulations, such as those enacted under the Dodd-Frank Wall Street Reform and Consumer Protection Act (the “Dodd-Frank Act”), and updates to capital and liquidity standards, including the 2013 Basel III Capital Rules (the “Basel III Rules”) as implemented by federal banking agencies, may produce unforeseen or unintended consequences for the banking industry. The Dodd-Frank Act introduced sweeping reforms to the U.S. financial system, including the creation of the Financial Stability Oversight Council (“FSOC”) to monitor systemic risk and the Consumer Financial Protection Bureau (“CFPB”) to oversee consumer financial products and enforce related regulations, as well as modifications to retail banking rules and FDIC deposit insurance assessment methodologies.
The Basel III Rules established stringent risk-based capital and leverage requirements and impose a “capital conservation buffer,” which, if not fully maintained, restricts capital distributions (e.g., dividends or stock repurchases) and certain discretionary bonus payments. See “Supervision and Regulation — Capital Requirements” for additional details on our regulatory capital obligations. Although the Company, as a bank holding company with less than $3 billion in total consolidated assets, currently qualifies as a “small bank holding company” under Federal Reserve policy and is exempt from the Federal Reserve’s consolidated risk-based capital and leverage rules at the holding company level, the Bank remains fully subject to the Basel III Rules’ capital requirements. Compliance with these standards increases the Bank’s operational costs and may limit growth opportunities or necessitate additional capital infusions from the Company to the Bank. For instance, during periods of seasonal deposit growth, our total assets could approach thresholds that require the Bank to actively manage its deposit levels to maintain a satisfactory Tier 1 leverage ratio. Historically, we have manage our deposit levels to maintain a satisfactory Tier 1 leverage ratio by transferring certain deposit accounts off our balance sheet through the ICS® network as One-Way Sell® deposits placed at other financial institutions. However, there can be no assurance that this strategy will remain available or effective in the future, particularly if market conditions, counterparty availability, or regulatory interpretations change. See “— Other Risks Related to Our Business — We place a significant portion of our clients’ deposits with other banks through the ICS® network, which exposes us to risks that may materially adversely affect our business, financial condition, or results of operations.”
45
If the Bank’s capital needs exceed internal resources, the Company may need to raise additional capital. Our ability to do so depends on numerous factors, including our financial performance, market conditions, investor appetite, and broader economic circumstances, many of which are beyond our control. There is no guarantee that we could raise additional capital when required, or on terms favorable to us, and a failure to do so could materially impair our financial condition, limit our growth prospects, and reduce stockholder returns. Moreover, if the Company’s total consolidated assets exceed $3 billion or if regulatory policy changes, the Company could become subject to the Federal Reserve’s consolidated capital rules, further increasing compliance costs and potentially constraining our operational flexibility or capital management strategies.
The potential exists for new federal or state laws, regulations, or changes in regulatory policy or interpretation to materially affect our operations, including capital requirements, lending practices, funding strategies, deposit insurance assessments, and liquidity standards. Recent political developments, including the transition to a new presidential administration in January 2025, have introduced additional uncertainty regarding potential regulatory reforms or deregulation initiatives. Moreover, litigation challenging actions or regulations by federal or state authorities could reshape the supervisory framework governing our operations, with outcomes that are difficult to predict. Such changes could increase our cost of doing business, restrict our ability to compete effectively, or materially alter the markets in which we operate, potentially resulting in a material adverse effect on our financial condition and stockholder value.
In response to recent bank failures and declining public confidence in the banking sector, regulators have intensified oversight of financial institutions. State and federal authorities have proposed or implemented measures addressing capital adequacy, deposit concentration risk, liquidity management, and deposit insurance coverage. These developments could result in stricter requirements for the Bank, increasing compliance costs and potentially limiting our ability to pursue growth opportunities. Additionally, the FDIC assesses premiums on insured institutions like the Bank to maintain the DIF at a statutory minimum of 2% of total estimated insured deposits, pursuant to the Federal Deposit Insurance Act, as amended. Increases in these premiums—whether to achieve this target, reflect revised risk metrics, or cover depositors of failed institutions—could materially erode our profitability and financial condition.
Failure to comply fully with banking laws and regulations—particularly those governing consumer protection, fair lending, and anti-money laundering—could result in heightened regulatory scrutiny, informal or formal enforcement actions (e.g., memoranda of understanding, consent orders, or cease-and-desist orders), or the imposition of civil money penalties on the Company, the Bank, or their officers and directors. Even absent formal enforcement, the costs of remediating compliance deficiencies, maintaining ongoing compliance, and defending against potential regulatory actions could divert management resources, reduce earnings, and negatively impact stockholder returns.
Litigation and regulatory actions, including possible enforcement actions, could subject us to significant fines, penalties, judgments, restrictions on our business activities or reputational harm.
We have in the past been, and may in the future be, named as a defendant in legal actions in connection with our activities. Legal actions could include claims for substantial compensatory or punitive damages or claims for indeterminate amounts of damages. For example, in 2020, Blue Flame Medical LLC (“Blue Flame”) filed a lawsuit alleging that the Bank improperly returned a wire transfer in the amount of $456.9 million and remained obligated to pay that sum to Blue Flame. While the lawsuit was dismissed in our favor, we incurred significant legal expenses in connection with the lawsuit. In addition, we can be subject to reputational harm resulting from legal actions or related activities arising therefrom. For example, the co-founder of Blue Flame has reportedly filed a complaint with the OCC requesting the OCC to investigate the Bank’s actions with respect to the return of the $456.9 million wire transfer, and on May 31, 2024, three members of the U.S. House of Representatives signed a letter requesting the OCC to conduct such an investigation.
The Bank’s Trust & Wealth Department is particularly subject to the risk that clients or others may sue us, claiming that we or third parties for whom they say we are responsible have failed to perform under a contract or otherwise failed to carry out a duty perceived to be owed to them. This risk is heightened when we act as a fiduciary for our clients and may be further heightened during periods when credit, equity or other financial markets are deteriorating in value or are particularly volatile, or when clients or investors are experiencing losses. Further, our Trust & Wealth Department offers certain specialized trust services, such as special needs trusts, that may subject us to an increased risk of legal liability. See “— Risks Related to Our Business — Our Trust & Wealth Department exposes us to certain risks and there can be no assurances the department will contribute meaningfully to our revenues or become profitable on a standalone basis.”
46
Further, our regulators may impose consent orders, civil money penalties, matters requiring attention, or similar types of supervisory criticism. We may also, from time to time, be the subject of subpoenas, requests for information, reviews, investigations and proceedings (both formal and informal) by governmental agencies regarding our activities.
Any such legal or regulatory actions may subject us to substantial compensatory or punitive damages, significant fines, penalties, obligations to change our business practices or other requirements, resulting in increased expenses, diminished income and damage to our reputation. Our involvement in any such matters, whether tangential or otherwise and even if the matters are ultimately determined in our favor, could also cause significant harm to our reputation and divert management attention from the operation of our business. Further, any settlement, consent order or adverse judgment in connection with any formal or informal proceeding or investigation by government agencies may result in litigation, investigations or proceedings as other litigants and government agencies begin independent reviews of the same activities. As a result, the outcome of legal and regulatory actions could have an adverse effect on our business, results of operations or financial condition.
The Bank’s primary regulator has broad powers to place limitations on the conduct of a bank’s business, or to close an institution.
The OCC has broad supervisory powers to limit a bank’s conduct of its business in the event that its capital position or financial condition decline, or if it engages in unsafe or unsound practices. Such powers include the ability to limit distributions of dividends. As a result of capital insufficiency, including but not limited to if a bank’s level of Tier 1 capital falls below 2.0%, becoming undercapitalized with no reasonable prospect of becoming adequately capitalized, liquidity issues or other regulatory concerns, including engaging in unsafe or unsound banking practices or being in an unsafe or unsound condition, a bank could be subject to the imposition of additional restrictions or conditions on its operation, or to being closed by its regulators without compensation to the bank’s stockholders, including its bank holding company. Furthermore, the OCC’s regulatory expectations may exceed these minimum capital requirements, which could result in higher compliance costs or require additional capital resources to be committed to a bank. If the OCC were to require us to commit additional capital resources to support the Bank, we could be required to borrow funds or raise capital on unfavorable terms. If the Bank were to be closed by its regulators, there can be no assurance that the Company would be able to find a buyer for the Company or the Bank in the event that it is unable to continue as an independent entity.
Generally, a conservator or receiver may be appointed for an insured depository institution where: (1) its obligations exceed its assets; (2) there is substantial dissipation of the institution’s assets or earnings as a result of any violation of law or any unsafe or unsound practice; (3) the institution is in an unsafe or unsound condition; (4) there is a willful violation of a cease-and-desist order; (5) the institution is unable to pay its obligations in the ordinary course of business; (6) losses or threatened losses deplete all or substantially all of an institution’s capital, and there is no reasonable prospect of becoming “adequately capitalized” without assistance; (7) there is any violation of law or unsafe or unsound practice or condition that is likely to cause insolvency or substantial dissipation of assets or earnings, weaken the institution’s condition, or otherwise seriously prejudice the interests of depositors or the insurance fund; (8) an institution ceases to be insured; (9) the institution is undercapitalized and has no reasonable prospect that it will become adequately capitalized, fails to become adequately capitalized when required to do so, or fails to submit or materially implement a capital restoration plan; or (10) the institution is critically undercapitalized or otherwise has substantially insufficient capital.
The Bank is subject to extensive and evolving requirements under anti-money laundering and sanctions laws.
The Bank is subject to stringent regulations under the Bank Secrecy Act of 1970 (“BSA”), the USA PATRIOT Act of 2001, the Anti-Money Laundering Act of 2020, and regulations administered by the Office of Foreign Assets Control (“OFAC”). These laws require us to maintain a comprehensive anti-money laundering (“AML”) and sanctions compliance program, which includes client due diligence, enhanced due diligence for high-risk clients, ongoing monitoring of transactions, and the timely filing of Suspicious Activity Reports (SARs) and Currency Transaction Reports (CTRs).
The Financial Crimes Enforcement Network, established by the U.S. Treasury Department to administer the BSA, is authorized to impose significant civil money penalties for violations of those requirements and has recently engaged in coordinated enforcement efforts with the individual federal banking regulators, as well as the U.S. Department of Justice, Drug Enforcement Administration and the Internal Revenue Service. There is also increased scrutiny of compliance with the sanctions programs and rules administered and enforced by OFAC. Further, OFAC may impose civil penalties for sanctions violations based on strict liability, meaning we could be held liable for sanctions violations even if we did not know or have reason to know we were engaging in a violation.
47
Anti-money laundering and sanctions laws and regulations are complex, and regulatory expectations are constantly evolving. The complexity of our operations, particularly with respect to our concentration in political organization deposits and our participation in IntraFi’s ICS® program, may increase our exposure to regulatory scrutiny. Accordingly, maintaining compliance with anti-money laundering and sanctions laws and regulations involves significant investments in technology, personnel, and internal processes, and as regulatory requirements evolve and regulatory expectations heighten, we have in the past incurred, and may in the future incur, increased costs, and may face operational challenges to maintain and improve our compliance programs. Further, there can be no assurances that we will identify all suspicious activity or high-risk transactions our clients engage in or prevent all instances of fraud or other financial crimes that our clients may commit. Additionally, our compliance program is reliant on the accuracy of information provided to us by our clients and other external sources, and, although we take steps that we believe are reasonably designed to verify and monitor client activities, we may not always detect or prevent fraudulent activities or non-compliance by clients. Failure to comply with anti-money laundering and sanctions laws or regulations, or to meet evolving regulatory expectations, may expose us to penalties, fines, operational restrictions, or reputational damage, which could adversely affect our business, financial condition, or results of operations.
The Bank is subject to numerous “fair and responsible banking” laws and regulations designed to protect consumers, which increase our compliance costs and subject us to potential legal liability or reputational damage.
The Bank is subject to numerous “fair and responsible banking” laws and regulations designed to protect consumers. For example, the Community Reinvestment Act (“CRA”), the Equal Credit Opportunity Act (“ECOA”), the Fair Housing Act (“FHA”), the Truth in Lending Act (“TILA”), the Fair Credit Reporting Act (“FCRA”) and other fair lending laws and regulations, including state laws and regulations, prohibit discriminatory lending practices by financial institutions. The Federal Trade Commission Act and the Dodd-Frank Act prohibit unfair, deceptive, or abusive acts or practices by financial institutions. These laws and regulations increase our compliance costs and a failure to comply with these laws and regulations could result in a wide variety of sanctions. The U.S. Department of Justice, federal banking agencies, and other federal and state agencies are responsible for enforcing these fair and responsible banking laws and regulations. A challenge to an institution’s compliance with fair and responsible banking laws and regulations could result in a wide variety of sanctions, including damages and civil money penalties, injunctive relief, restrictions on mergers and acquisitions activity, restrictions on expansion, and restrictions on entering new business lines. Private parties may also have the ability to challenge an institution’s performance under fair lending laws in private class action litigation. Such actions could have a material adverse effect on the Bank’s reputation, business, financial condition and results of operations.
On October 24, 2023, the federal bank regulatory agencies issued a final rule to modernize their respective CRA regulations. The revised rules substantially alter the methodology for assessing compliance with the CRA, with material aspects taking effect January 1, 2026 and revised data reporting requirements taking effect January 1, 2027. The final rule is currently enjoined while a federal court considers a lawsuit challenging the rule. The final rules, if implemented, would likely make it more challenging or costly for the Bank to maintain its current rating of “outstanding” or receive a rating of at least “satisfactory” on its CRA evaluation. For example, the revised rules may require the Bank to increase its lending and investment activities in areas where it does not currently have branches or significant operations, which could lead to higher compliance costs and operational complexities. A failure to maintain a rating of “outstanding” or “satisfactory” could limit our ability to expand through acquisitions or new branch openings and could subject us to increased scrutiny from regulators and community groups. Additionally, a lower CRA rating could damage our reputation, making it more difficult to attract and retain clients who value our community commitment. These factors could materially and adversely affect our business, financial condition, and results of operations. See “Supervision and Regulation — Community Reinvestment Act” for more information about the CRA.
We engage in lending secured by real estate and may be forced to foreclose on the collateral and own the underlying real estate, subjecting us to potential costs, risks and consumer protection laws.
Since we originate loans secured by real estate, we may have to foreclose on the collateral property to protect our investment and may thereafter own and operate such property. The amount that we, as a mortgagee, may realize after a foreclosure may depend on a variety of factors, including, but not limited to, general or local economic conditions, assessments, interest rates, real estate tax rates, condition of the collateral property, operating expenses of the mortgaged properties, our ability to effectively operate the properties, our ability to obtain and maintain adequate occupancy of the properties, zoning laws, environmental cleanup liabilities, governmental and regulatory rules and natural disasters. Our inability to manage the amount of costs or size of the risks associated with the ownership of real estate, or write-downs in
48
the value of our other real estate owned, could have a material adverse effect on our business, financial condition and results of operations.
Consumer protection initiatives or changes in state or federal law may substantially increase the time and expenses associated with the foreclosure process or prevent us from foreclosing at all. A number of states in recent years have either considered or adopted foreclosure reform laws that make it substantially more difficult and expensive for lenders to foreclose on properties in default. Additionally, federal and state regulators have prosecuted or pursued enforcement action against a number of mortgage-servicing companies for alleged consumer law violations. If new federal or state laws or regulations are ultimately enacted that significantly raise the cost of foreclosure or raise outright barriers to foreclosure, they could have a material adverse effect on our business, financial condition and results of operations.
Additionally, if the Bank forecloses on, and takes title to, real estate, it may become subject to environmental liabilities associated with such properties, which could adversely affect our business, financial condition and results of operations. We may be liable for remediation costs, as well as for personal injury and property damage, civil fines and criminal penalties regardless of when the hazardous conditions or toxic substances first affected the property. Environmental laws may require us to incur substantial expenses to address unknown liabilities and may materially reduce the affected property’s value or limit our ability to use or sell the affected property. In addition, future laws or more stringent interpretations or enforcement policies with respect to existing laws may increase our exposure to environmental liability, and we may not have adequate remedies against the prior owner or other responsible parties and could find it difficult or impossible to sell the affected properties.
Any violation of laws regarding, or incidents involving, the privacy, information security and protection of personal, confidential or proprietary information could damage our reputation and otherwise adversely affect our business.
The Bank’s business requires the collection and retention of large volumes of client data, including personally identifiable information (“PII”) in various information systems that it maintains and in those maintained by third-party service providers. It also maintains important internal company data such as PII about employees and information relating to operations. The Bank is subject to complex and evolving laws and regulations governing the privacy and protection of PII of individuals (including clients, employees, and other third parties). These include the Gramm-Leach-Bliley Act, which, among other things: (1) imposes certain limitations on the Bank’s ability to share nonpublic PII about clients with nonaffiliated third parties; (2) requires that it provide certain disclosures to clients about its information collection, sharing and security practices and afford clients the right to “opt out” of any information sharing by us with nonaffiliated third parties (with certain exceptions); and (3) requires that it develop, implement, and maintain a written comprehensive information security program containing appropriate safeguards based on size and complexity, the nature and scope of activities, and the sensitivity of client information the Bank processes, as well as plans for responding to data security breaches. Various federal and state banking regulators and states have also enacted data breach notification requirements with varying levels of individual, consumer, regulatory or law enforcement notification in the event of a security breach. Ensuring that the collection, use, transfer, and storage of PII complies with all applicable laws and regulations can increase costs. Furthermore, the Bank may not be able to ensure that clients and other third parties have appropriate controls in place to protect the confidentiality of the information that they exchange, particularly where such information is transmitted by electronic means. If personal, confidential or proprietary information of clients or others were to be mishandled or misused (in situations where, for example, such information was erroneously provided to parties who are not permitted to have the information, or where such information was intercepted or otherwise compromised by third parties), the Bank could be exposed to litigation or regulatory sanctions under privacy and data protection laws and regulations. Concerns regarding the effectiveness of measures to safeguard PII, or even the perception that such measures are inadequate, could cause the Bank to lose clients or potential clients and thereby reduce revenues. Accordingly, any failure, or perceived failure to comply with applicable privacy or data protection laws and regulations may subject the Bank to inquiries, examinations and investigations that could result in requirements to modify or cease certain operations or practices or in significant liabilities, fines or penalties, and could damage its reputation and otherwise adversely affect its operations, financial condition and results of operations.
Increases in FDIC insurance premiums could adversely affect our earnings and results of operations.
The Bank is a member of the FDIC and the deposits of each of its depositors are insured to the maximum amount provided by the Federal Deposit Insurance Act (“FDIA”), subject to the Bank’s payment of deposit insurance premiums to the FDIC. The FDIC calculates assessment rates applicable to the Bank based on a variety of factors, including capital adequacy, asset quality, management practices, earnings performance, liquidity, and sensitivity to market risk. Any deterioration of these factors could result in an increase in the Bank’s FDIC assessment rate. In addition, to maintain a
49
strong funding position and restore the reserve ratios of the DIF following the financial crisis, the FDIC increased deposit insurance assessment rates generally and, in response to recent bank failures, charged special assessments applicable to certain FDIC-insured financial institutions. Further increases in assessment rates or special assessments may occur in the future, especially if there are significant additional financial institution failures. Any future special assessments, increases in assessment rates or required prepayments in FDIC insurance premiums could reduce our profitability or limit our ability to pursue certain business opportunities, which could have a material adverse effect on our business, financial condition and results of operations.
The Federal Reserve may require the Company to commit capital resources to support the Bank at a time when our resources are limited, which may require us to borrow funds or raise capital on unfavorable terms.
The Company is required by the Federal Reserve to act as a source of financial and managerial strength to the Bank and may be required to commit capital and financial resources to support the Bank. Such support may be required at times when, absent this requirement, the Company otherwise might determine not to provide it, including situations where our resources may be limited, and we may be required to borrow funds or raise capital to make the required capital injection. Any loan by the Company to the Bank would be subordinate in right of repayment to payments to depositors and certain other creditors of the Bank. In the event of the Company’s bankruptcy, the bankruptcy trustee will assume any commitment by the Company to a federal bank regulatory agency to maintain the capital of the Bank. Moreover, bankruptcy law provides that claims based on any such commitment will be entitled to a priority of payment over the claims of the Company’s general unsecured creditors, including the holders of any note obligations. Thus, any borrowing by the Company for making a capital injection to the Bank may be more difficult and expensive relative to other corporate borrowings. Borrowing funds or raising capital on unfavorable terms for such a capital injection may have a material adverse effect on our business, financial condition and results of operations.
Changes in our accounting policies or in accounting standards could materially affect how we report our financial results and condition.
From time to time, the accounting standard setters, including the Financial Accounting Standards Board (“FASB”) and the SEC, change the financial accounting and reporting standards that govern the preparation of our financial statements. These changes can be difficult to predict and can materially impact how we record and report our financial condition and results of operations. As a result of changes to financial accounting or reporting standards, we could be required to change certain of the assumptions or estimates we have previously used in preparing our financial statements, which could negatively impact how we record and report our results of operations and financial condition generally. In some instances, we could be required to apply a new or revised standard retroactively, resulting in the restatement of prior period financial statements.
Risks Related to Our Dual-Class Common Stock Structure
The dual-class structure of our common stock has the effect of limiting your ability to influence corporate matters and may adversely affect the market for our Class A common stock.
We have two classes of common stock:
•Class A common stock, par value $0.01 per share, which is entitled to one vote per share; and
•Class B common stock, par value $0.01 per share, which is entitled to 10 votes per share.
As of December 31, 2024, holders of our outstanding shares of Class B common stock held, in the aggregate, approximately 92.01% of the combined voting power of our common stock (with members of the Fitzgerald Family beneficially owning in the aggregate approximately 65.94% of the outstanding shares of our Class B common stock, and 60.67% of the combined voting power of our common stock). The dual-class structure of our common stock has the effect of concentrating voting power with the holders of our Class B common stock, including members of the Fitzgerald Family. Accordingly, those owners, if voting in the same manner, would be able to control the election of our Board and therefore limit your ability to influence corporate matters. No member of the Fitzgerald Family or other holder of our Class B common stock is a party to any voting agreement or other arrangement or understanding regarding the voting of our shares. As a result, we do not believe we are a “controlled company” within the meaning of the NYSE corporate governance listing standards and have no present intention to be treated as a controlled company in the future. However, members of the Fitzgerald Family and other holders of our Class B common stock may in the future decide to act as a group, and could
50
elect to be treated as a “controlled company,” in which case we would not be required to comply with certain corporate governance requirements of the NYSE unless otherwise mandated by our Charter or applicable law. A “controlled company” may elect not to comply with certain corporate governance requirements of the NYSE, including:
•the requirement that a majority of the board of directors consist of “independent directors” as defined under the rules of the NYSE;
•the requirement that each of the compensation and nominating and corporate governance committees be composed entirely of independent directors; and
•the requirement for an annual performance evaluation of the compensation and nominating and corporate governance committees.
Although our Charter requires that, so long as our Class A common stock is listed for trading on a national securities exchange, such as the NYSE, a majority of directors must be independent in accordance with and as defined by the rules and regulations of such exchange, if we were to become a “controlled company” in the future we could elect not to comply with the NYSE requirements to maintain independent compensation and nominating and corporate governance committees. Further, if our Charter is also amended in the future to no longer require a majority of independent directors, we could elect not to comply with the NYSE requirements to maintain a majority of independent directors. Accordingly, if we become a “controlled company,” you may not have the same protections afforded to stockholders of companies that are subject to all of the corporate governance requirements of the NYSE.
In addition, pursuant to the terms of our Charter, some holders of our Class B common stock have in the past, and may in the future, voluntarily convert shares of Class B common stock to Class A common stock and some shares of Class B common stock may automatically convert into shares of Class A common stock under certain circumstances, including upon certain transfers (such as a transfer in connection with a sale). As such conversions occur, the converted shares of Class B common stock with 10 votes per share will be converted into shares of Class A common stock carrying only one vote per share. Accordingly, stockholders who continue to hold Class B common stock will, by virtue of the reduction of the number of outstanding shares of Class B common stock and the consequent reduction in the total number of votes attributable to Class B shares, realize an increase in their relative voting power. As a result, there is a possibility that the degree of voting control of our Chairman, Peter G. Fitzgerald, and the other members of the Fitzgerald Family, may increase over time if such conversions continue, further concentrating voting power with remaining Class B stockholders.
Our dual-class structure may adversely affect the market price, trading volume, volatility, or investor perception of our Class A common stock, potentially limiting its appeal to a broad range of investors. As a relatively small company, our size, combined with our dual-class structure and the proportion of shares held by insiders, may impact our eligibility for inclusion in certain widely followed stock indices, though eligibility criteria vary across index providers and depend on factors beyond our control, such as market capitalization, public float, “free float”, liquidity, and governance policies. Moreover, index providers may change their eligibility rules over time, and some could revert to policies that exclude companies with dual-class structures like ours, as certain providers have done in the past. If we are not included in such indices—or if we are included but later excluded due to such rule changes—mutual funds, exchange-traded funds (ETFs), and other investment vehicles designed to track those indices may choose not to invest in our Class A common stock or may be forced to sell existing holdings. Given the significant capital flows into passive investment strategies that track stock indices, non-inclusion or subsequent exclusion could reduce demand for our Class A common stock or trigger significant selling pressure, potentially making it less attractive to institutional and retail investors. As a result, the market price, trading volume, and liquidity of our Class A common stock could be adversely affected, and we may experience increased volatility or negative publicity related to our capital structure or market position. We can provide no assurance that we will satisfy the inclusion criteria of any index provider.
Additionally, certain stockholder advisory firms and institutional investors have expressed concerns about multi-class structures with unequal voting rights. These entities may criticize our corporate governance practices or dual-class structure through commentary, voting recommendations, or investment policies, which could discourage investors from purchasing or holding our Class A common stock. Such criticism could further reduce the appeal of our Class A common stock, potentially leading to a less active trading market and amplifying adverse effects on our stock price.
51
Members of the Fitzgerald Family and other holders of Class B common stock could aggregate their holdings and sell a controlling interest in us to a third party in a private transaction.
As of December 31, 2024, members of the Fitzgerald Family beneficially owned in the aggregate shares of our common stock representing a majority, of the voting power with respect to all of the outstanding shares of our common stock. Currently, the members of the Fitzgerald Family are not party to any voting agreement or other arrangement or understanding regarding the voting of our shares and have no present intention to act together for any purpose. However, in the future, should they choose to do so, the members of the Fitzgerald Family and other holders of Class B common stock could aggregate their holdings, subject to the limitations set forth in the Change in Bank Control Act of 1978 (the “CIBC Act”) and the Charter, to sell some or all of their shares of our common stock, including our Class A common stock, in a privately negotiated transaction, which, if sufficient in size, could result in a change of control of our company. However, subject to certain exceptions, any transfer of Class B common stock to a third party would cause, or require the optional conversion, of such shares into Class A common stock. Shares of Class A common stock are entitled to one vote per share, compared to 10 votes per share of Class B common stock. Accordingly, any acquirer of our common stock from members of the Fitzgerald Family and other holders of Class B common stock may not be able to exercise the same aggregate amount of voting power with respect to such shares.
The ability of the members of the Fitzgerald Family and other holders of Class B common stock to aggregate their shares and privately sell them, with no requirement for a concurrent offer to be made to acquire all of the shares of our outstanding common stock that will be publicly traded hereafter, could prevent you from realizing any change-of-control premium on your shares of our common stock that may accrue to members of the Fitzgerald Family and other holders of Class B common stock in such private sale of our common stock. In addition, if the members of the Fitzgerald Family and other holders of Class B common stock were to privately sell a significant equity interest in our company, we may become subject to the control of a presently unknown third party. Such third party may have interests that conflict with those of other stockholders. If there were to be such a change of control, it may adversely affect our ability to run our business as described in this Annual Report on Form 10-K and could have a material adverse effect on our business, financial condition and results of operations.
Conflicts of interest and other disputes may arise between the members of the Fitzgerald Family and us that may be resolved in a manner unfavorable to us and our other stockholders.
Conflicts of interest and other disputes may arise between the members of the Fitzgerald Family and us in connection with our past and ongoing relationships, and any future relationships we may establish in a number of areas, including, but not limited to, the following:
•Competing Business Activities. Members of the Fitzgerald Family may also engage in activities where their interests conflict or are competitive with our or our other stockholders’ interests. These activities may include a Fitzgerald Family member’s interests in any transaction it may conduct with us, any sale by a Fitzgerald Family member of a substantial interest in us to a third party or any investments by the Fitzgerald Family member in, or business activities conducted by the Fitzgerald Family member for, one or more of our competitors. Any of these disputes or conflicts of interests that arise may be resolved in a manner adverse to us or to our stockholders other than the Fitzgerald Family member and their affiliates. As a result, our future competitive position and growth potential could be adversely affected.
•Business Opportunities. Members of the Fitzgerald Family or their affiliates may engage in a corporate opportunity in the same or similar lines of business in which we or our affiliates now engage or propose to engage or otherwise compete with us or our affiliates. As a result of competition, our future competitive position and growth potential could be adversely affected.
While our Charter provides certain protections for the holders of Class A common stock, these and other conflicts of interest and potential disputes could have a material adverse effect on our business, financial condition, results of operations, or the market price of our Class A common stock.
52
Risks Related to Our Common Stock
The market price of shares of our common stock may be volatile or may decline regardless of our operating performance, which could cause the value of your investment to decline.
The market price of our Class A common stock may be highly volatile and could be subject to wide fluctuations. In addition, the trading volume on our Class A common stock may fluctuate and cause significant price variations to occur. If the market price of our Class A common stock declines significantly, you may be unable to resell your shares of Class A common stock at or above your purchase price, if at all. We cannot assure you that the market price of our Class A common stock will not fluctuate or decline significantly in the future. Stock markets and the price of our shares of Class A common stock may experience extreme price and volume fluctuations. Some, but certainly not all, of the factors that could negatively affect the price of our Class A common stock, or result in fluctuations in the price or trading volume of our Class A common stock, include:
•general market conditions;
•domestic and international economic factors unrelated to our performance;
•variations in our quarterly operating results or failure to meet the market’s earnings expectations;
•publication of research reports about us or the financial services industry in general;
•the failure of securities analysts to cover or continue to cover our Class A common stock;
•additions to or departures of our key personnel;
•adverse market reactions to any indebtedness we may incur or securities we may issue in the future;
•actions by our stockholders;
•the expiration of contractual lock-up agreements;
•future sales of our Class A common stock, including upon the conversion of shares of our Class B common stock;
•the operating and securities price performance of companies that investors consider to be comparable to us;
•changes or proposed changes in laws or regulations affecting our business; and
•actual or potential litigation and governmental investigations.
Certain pre-IPO investors entered into lock-up agreements in connection with our IPO that are scheduled to expire on April 1, 2025, permitting these pre-IPO investors to sell shares of Class A Common Stock (including upon conversion of shares of Class B Common Stock) in the public market. This expiration could lead to a substantial increase in the supply of Class A Common Stock available for sale, especially if significant holders, such as members of the Fitzgerald Family (who beneficially owned approximately 65.94% of Class B shares, representing 60.67% of total voting power as of December 31, 2024), sell shares. Such sales could significantly heighten volatility or depress our stock price, particularly if executed in large blocks or during unfavorable market conditions.
An acquisition of another banking institution could increase operational and regulatory risks, and adversely affect our financial condition and stock price and, if paid for with our Class A Common Stock, could dilute existing stockholders.
We may pursue growth through the acquisition of another banking institution. The success of any acquisition would depend, in part, on our ability to integrate the acquired businesses and realize anticipated synergies, cost savings and growth opportunities. We may face numerous risks and uncertainties in combining and integrating the relevant businesses and systems, including the need to combine or separate accounting and data processing systems and management controls and to integrate relationships with clients, counterparties, regulators and others in connection with acquisitions. Integration
53
of acquired businesses is time-consuming and could disrupt our ongoing businesses, produce unforeseen regulatory or operating difficulties, cause us to incur incremental expenses or require incremental financial, management and other resources. It is also possible that an acquisition, once announced, may not close due to the failure to satisfy applicable closing conditions, such as the receipt of necessary shareholder or regulatory approvals. There is no assurance that an acquisition would be successfully integrated or yield all of the expected benefits and synergies in the time frames that we expect, or at all. If we are not able to integrate our acquisitions successfully, our business, results of operations or financial could be adversely affected. Further, if we issue shares of Class A Common Stock as consideration for any acquisition, it would dilute the ownership of existing holder of our Class A Common Stock, and could result in a decline in the market price of our Class A Common Stock.
We may issue shares of preferred stock in the future, which adversely affect holders of our common stock and depress the price of our common stock.
Our Charter authorizes us to issue up to 10,000,000 shares of one or more series of preferred stock. Our Board has the authority to determine the preferences, limitations and relative rights of shares of preferred stock and to fix the number of shares constituting any series and the designation of such series, without any further vote or action by our stockholders. Our preferred stock could be issued with voting, liquidation, dividend and other rights superior to the rights of our common stock, including our Class A common stock. The potential issuance of preferred stock may delay or prevent a change in control of us, discouraging bids for our common stock at a premium over the market price, and materially adversely affect the market price and the voting and other rights of the holders of our Class A common stock.
We do not intend to pay dividends on our common stock for the foreseeable future, and our future ability to pay dividends is subject to restrictions.
Holders of our common stock, including our Class A common stock, are only entitled to receive dividends when, as and if declared by our Board out of funds legally available for dividends. We currently do not intend to pay dividends on our common stock, including our common stock, in the foreseeable future. Any declaration and payment of dividends on our common stock in the future will depend on regulatory restrictions, our earnings and financial condition, our liquidity and capital requirements, the general economic climate, contractual restrictions, our ability to service any equity or debt obligations senior to our common stock and other factors deemed relevant by our Board. Furthermore, consistent with our strategic plans, business objectives, capital availability, projected liquidity needs and other factors, we have made, and will continue to make, capital management decisions and policies that could adversely affect the amount of dividends, if any, paid to our common stockholders.
The Federal Reserve has indicated that bank holding companies should carefully review their dividend policy in relation to the organization’s overall asset quality, current and prospective earnings and level, composition and quality of capital. The guidance provides that we inform and consult with the Federal Reserve prior to declaring and paying a dividend that exceeds earnings for the period for which the dividend is being paid or that could result in an adverse change to our capital structure, including interest on the senior promissory note, the subordinated debt obligations, the subordinated debentures underlying our trust preferred securities and our other debt obligations. If required payments on our debt obligations are not made, or dividends on any preferred stock we may issue are not paid, we will be prohibited from paying dividends on our common stock. Among other considerations, our ability to pay dividends further depends on the following factors:
•Because the Company is a legal entity separate and distinct from the Bank and does not have any stand-alone operations, our ability to pay dividends depends on the ability of the Bank to pay dividends to us, and the OCC and Delaware state law may, under certain circumstances, restrict the payment of dividends to us from the Bank;
•Federal Reserve policy states that bank holding companies should not maintain cash dividends on common shares at a rate that would be in excess of net income available over the past year or that would result in prospective earnings retention being inconsistent with the organization’s expected future needs and financial condition; and
•Our Board may determine that, even though funds are available for dividend payments, retaining the funds for internal uses, such as expansion of our operations, is necessary or appropriate in light of our business plan and objectives.
54
An investment in our common stock is not an insured deposit.
An investment in our common stock, including our Class A common stock, is not a bank deposit and, therefore, is not insured against loss by the FDIC, any other DIF, or any other public or private entity. Investment in our common stock is inherently risky, including for the reasons described herein, and is subject to the same market forces that affect the price of common stock in any company. As a result, if you acquire our common stock, you could lose some or all of your investment.
If the Bank fails or is put into receivership or conservatorship by the FDIC and its primary regulator, investors will likely lose their entire investment in the Company.
The common stock of the Company, including our Class A common stock, is effectively subordinate to the claims of all creditors, including depositors, of the Bank. Based on the history of the FDIC in resolving failed institutions, if the Bank fails, or is placed into receivership, it is expected that the FDIC would incur a loss on the payout of the Bank’s insured deposits, uninsured deposits and sale of assets. As such, it is extremely unlikely that there would be any remaining funds available for payment to the Company as the sole stockholder of the Bank, or to its creditors or stockholders. The common stock is an investment in the Company only, and is not a deposit, savings account, or other liability of the Bank, and is not insured by the FDIC or any other governmental agency. As the Bank is the principal asset of the Company, its receivership will likely result in the Company’s bankruptcy, and the loss of stockholders’ investments in their entirety.
We qualify as an “emerging growth company” and “smaller reporting company,” and the reduced public company reporting requirements applicable to emerging growth companies and smaller reporting companies may make our common stock less attractive to investors.
We are an “emerging growth company” as defined in Section 2(a)(19) of the Securities Act, as modified by the JOBS Act. As an emerging growth company, we are eligible to take advantage of certain exemptions from various reporting requirements that are applicable to other public companies that are not emerging growth companies.
Although we are still evaluating our options under the JOBS Act, we may take advantage of some or all of the reduced regulatory and reporting obligations that will be available to us so long as we qualify as an “emerging growth company,” and thus the level of information we provide may be different from that of other public companies. If we do take advantage of any of these exemptions, some investors may find our securities less attractive, which could result in a less active trading market for our Class A common stock, and the price of our Class A common stock may be more volatile.
As an “emerging growth company” under the JOBS Act, we are permitted to delay the adoption of new or revised accounting pronouncements applicable to public companies until such pronouncements are made applicable to private companies. We do not intend to take advantage of this extended transition period, which means that the financial statements included in this Annual Report on Form 10-K, as well as any financial statements that we file in the future, will be subject to all new or revised accounting standards generally applicable to public companies. The decision not to take advantage of the extended transition period is irrevocable.
We could remain an “emerging growth company” until the earliest to occur of: (1) the end of the fiscal year following the fifth anniversary of our IPO; (2) the first fiscal year after our annual gross revenues are $1.235 billion or more; (3) the date on which we have, during the previous three-year period, issued more than $1.0 billion in non-convertible debt securities; or (4) the date on which we are deemed to be a “large accelerated filer” under the Exchange Act. We have taken advantage of reduced disclosure regarding executive compensation arrangements and the presentation of certain historical financial information in this Annual Report on Form 10-K, and we may choose to take advantage of some but not all of these reduced disclosure obligations in future filings. If we do, the information that we provide to our stockholders may be different from what stockholders might get from other public companies in which you hold stock.
We are also a smaller reporting company, as defined in the Exchange Act. Even after we no longer qualify as an emerging growth company, we may still qualify as a smaller reporting company, which would allow us to continue taking advantage of many of the same exemptions from disclosure requirements, including reduced disclosure obligations regarding executive compensation in our periodic reports and proxy statements. In addition, for so long as we continue to qualify as a non-accelerated filer, we will not be required to comply with the auditor attestation requirements of Section 404(b) of the Sarbanes-Oxley Act.
55
We cannot predict if investors will find our securities less attractive due to our reliance on these exemptions. If investors were to find our securities less attractive as a result of our election, we may have difficulty raising capital in future offerings and the market price of our securities may be more volatile.
If securities or industry analysts do not publish research or reports about our business, or if they downgrade their recommendations regarding our Class A common stock, our stock price and trading volume could decline.
The trading market for our Class A common stock will be influenced by the research and reports that industry or securities analysts publish about us or our business. We do not have any control over these securities analysts, and they may not cover, or may not continue to cover, our Class A common stock. If securities analysts do not cover our Class A common stock, the lack of research coverage may adversely affect our market price. If we are covered by securities analysts and if any of the analysts who cover us downgrade our common stock or publish inaccurate or unfavorable research about our business, our Class A common stock price may decline. If analysts cease coverage of us or fail to regularly publish reports on us, we could lose visibility in the financial markets, which in turn could cause our Class A common stock price or trading volume to decline and our Class A common stock to be less liquid.
Certain banking laws, certain provisions of our organizational documents and Delaware law may discourage or delay acquisition attempts for us that you might consider favorable.
Provisions of federal banking laws, including regulatory approval requirements, could make it difficult for a third party to acquire us, even if doing so would be perceived to be beneficial to our stockholders. Acquisition of ten percent (10%) or more of any class of voting stock of a bank holding company or depository institution, individually or as part of a group acting in concert, including shares of our Class A common stock, generally creates a rebuttable presumption that the acquirer “controls” the bank holding company or depository institution, which, unless rebutted, would require prior approval of a federal banking agency, under the CIBC Act. Also, a bank holding company must obtain the prior approval of the Federal Reserve before, among other things, acquiring direct or indirect ownership or control of more than five percent (5%) of the voting shares of any bank, including the Bank, under the BHC Act. See “Supervision and Regulation — Banking Acquisitions; Changes in Control” for more information.
In addition, our Charter and Amended and Restated Bylaws (“Bylaws”) contain provisions that may make a merger or acquisition of the Company more difficult. These provisions include, among others:
•a dual-class common stock structure, which provides for concentrated voting power in the holders of our Class B common stock, including members of the Fitzgerald Family, which provides significant influence over matters requiring stockholder approval, including the election of directors and significant corporate transactions, such as a merger or other sale of our company or its assets;
•no cumulative voting in the election of directors, which limits the ability of minority stockholders to elect director candidates;
•a class vote of the holders of a majority of the outstanding shares of any affected class of common stock, voting together as a separate class, to approve any amendment to our Charter that would adversely affect the rights or preferences of the Class A common stock or the Class B common stock;
•the affirmative vote of the holders of a majority of voting power of the outstanding shares held by stockholders other than the Founders (as defined in our Charter), voting together as a separate class, to approve any amendment to our Charter that would disproportionately benefit the Founders relative to stockholders other than the Founders;
•authorization to issue shares of one or more series of preferred stock, the terms of which series may be established and the shares of which may be issued without stockholder approval, and which may include super voting, special approval, dividend or other rights or preferences superior to the rights of the holders of Class A common stock;
•no stockholders action by written consent;
56
•special stockholder meetings may be called at any time by the Board, the chairman of our Board or the chief executive officer or our secretary upon the written request of the record holders of at least fifteen percent (15%) or more of the total voting power of the then-outstanding shares of common stock;
•advance notice requirements for nominations for elections to our Board or for proposing matters that can be acted upon by stockholders at stockholder meetings; and
•a class vote of the holders of Class A common stock, voting as a separate class, to approve any merger, consolidation or business combination of us into another corporation, in which any Founder, or an affiliate thereof, is part of the purchaser group.
These anti-takeover provisions and other provisions under the DGCL could discourage, delay or prevent a transaction involving a change in control of our company, including actions that our stockholders may deem advantageous, or negatively affect the trading price of our Class A common stock. These provisions could also discourage proxy contests and make it more difficult for you and other stockholders to elect directors of your choosing and to cause us to take other corporate actions you desire.
Our Charter and Bylaws designate the Court of Chancery of the State of Delaware as the sole and exclusive forum for certain types of actions and proceedings that may be initiated by our stockholders.
Our Charter and Bylaws provide that, unless we consent to the selection of an alternative forum, the Court of Chancery of the State of Delaware will, to the fullest extent permitted by law, be the sole and exclusive forum for: (i) any derivative action or proceeding brought on our behalf; (ii) any action asserting a breach of fiduciary duty owed by any of our directors, officers or stockholders to us or to our stockholders; (iii) any action asserting a claim against us arising under the DGCL, our Charter or our Bylaws; or (iv) any action asserting a claim against us that is governed by the internal affairs doctrine.
Although we believe this exclusive forum provision benefits us by providing increased consistency in the application of Delaware law, the forum selection clauses that are in our Charter and our Bylaws may impose additional litigation costs on stockholders in pursuing any such claims, particularly if the stockholders do not reside in or near the State of Delaware. Additionally, this choice-of-forum provision may limit a stockholder’s ability to bring a claim in a different judicial forum, including one that it may find favorable or convenient for a specified class of disputes with us or our directors, officers, other stockholders or employees, which may discourage such lawsuits even though an action, if successful, might benefit our stockholders. The Court of Chancery of the State of Delaware may also reach different judgments or results than would other courts, including courts where a stockholder considering an action may be located or would otherwise choose to bring the action, and such judgments may be more or less favorable to us than our stockholders.
ITEM 1B. UNRESOLVED STAFF COMMENTS
None.
ITEM 1C. CYBERSECURITY
Risk Management and Strategy
The Company identifies, assesses, and manages cybersecurity risks as part of its risk management program. Our cybersecurity strategy aligns the National Institute of Standards and Technology Cybersecurity Framework (“NIST CSF”), applicable regulatory guidelines and other industry practices to secure critical information systems and sensitive data.
Key components of the Company’s cybersecurity program include:
•Risk Assessment & Management: Regular identification and evaluation of cybersecurity threats, vulnerabilities, and exposures informed by threat intelligence, industry trends, and regulatory developments.
•Governance & Oversight: Defined cybersecurity policies and procedures overseen by senior management and the Board of Directors. The Director of Technology is responsible for monitoring cybersecurity risks and reporting any material threats or incidents to the IT Committee or Board for oversight, strategic response planning, and mitigation efforts.
57
•Access Controls & Identity Management: Implementation of multi-factor authentication, role-based access controls, and monitoring of user permissions.
•Incident Detection & Response: Security monitoring supported by an incident response plan designed for timely identification, containment, and remediation of cybersecurity incidents.
•Data Protection & Encryption: Encryption, standards, data loss prevention protocols, and secure data storage measures for sensitive client and corporate information.
•Third-Party Risk Management: Security assessments, monitoring, and contractual requirements to manage cybersecurity risks from third-party vendors.
•Training & Awareness: Mandatory cybersecurity training for employees to enhance awareness of cybersecurity threats and compliance requirements.
•Regulatory Compliance & Audit: Regular internal and external cybersecurity audits to assess compliance with applicable regulations, standards, and Company policies.
•Continuous Improvement & Testing: Periodic penetration tests and vulnerability assessments to evaluate cybersecurity risks and enhanced security measures. Program updates are implemented as needed to address emerging threats and align with evolving industry best practices.
The Company uses third-party assessors , auditors, and consultants to independently evaluate security practices through penetration testing, vulnerability assessments, and vendor evaluations. Despite these measures, the Company acknowledges that cybersecurity incidents cannot be fully prevented.
Third-Party Risk Management
Cybersecurity risks posed by third-party vendors and service providers are integrated into the Company’s risk management framework. Vendor security practices, compliance with contractual cybersecurity obligations, and exposure to cybersecurity threats related to external providers are assessed regularly. While these efforts aim to assess and mitigate cybersecurity risks, no security assessment can eliminate all potential risks associated with third-party vendors.
Board Oversight
The Risk Committee monitors the quality and effectiveness of the Company’s information technology security, and at least annually reviews, appraises, and discuss with management the quality and effectiveness of the Company’s information technology security, data privacy, disaster recovery capabilities and cybersecurity and related risks. Additionally, the IT Committee reviews quarterly reports regarding the information security program and technology program, key enterprise cybersecurity initiatives, and other matters relating to cybersecurity processes.
Cybersecurity and IT risks are reported to the Board through multiple channels. The IT Committee Chair periodically reports to the Board summarizing key issues, risk assessments, and compliance matters. Additionally, the Director of Technology submits semi-annual reports to the Board, providing insights into ongoing and emerging risks, technology developments, and IT security initiatives. In cases where significant IT or cybersecurity risks arise, such matters are escalated to the Company’s Board through the Chair of the Risk Committee or the Chief Risk Officer, for timely awareness and response.
The Risk Committee, chaired by a former senior executive from KPMG LLP, who established and led KPMG’s Financial Risk Management practice in the U.S., annually evaluates the effectiveness of the Company’s cybersecurity controls.
58
Management Oversight
As of the date of this Annual Report on Form 10-K, the Company has contracted with a third-party firm to provide CISO services, who reports to the Chief Risk Officer and the IT Committee Chair. This engagement allows the Company to access specialized knowledge, industry best practices, and regulatory insights while maintaining flexibility in managing its information security strategy. The external CISO provides guidance and oversight on cybersecurity risk assessments, incident response, and compliance.
Incident Response
For additional information regarding the risk we face from cybersecurity threats, see the risk factors entitled “The occurrence of fraudulent activity, breaches or failures of our information security controls or cybersecurity-related incidents could have a material adverse effect on our business, financial condition, results of operations, and reputation” and “We also face risks related to cyberattacks and other security breaches involving external, third-party vendors and counterparties” included in Part I, Item 1A. Risk Factors in this Annual Report on Form 10-K.
ITEM 2. PROPERTIES
The Company and the Bank maintain their principal operations at owned properties located in McLean, Virginia, in the Washington, D.C. metropolitan area. As of the filing of this Annual Report on Form 10-K, the Bank owns the following properties:
Main Banking Office
Palladium at McLean, 1445-A Laughlin Avenue, Unit 102, McLean, Virginia 22101, totaling approximately 4,500 square feet. This commercial condominium serves as our main banking office and is currently used for retail banking services, Trust & Wealth management services, credit administration and executive offices.
Additional Offices
• Palladium at McLean, 1445 Laughlin Avenue, Unit 101, McLean, Virginia 22101, totaling approximately 3,850 square feet. Approximately 2,280 square feet of this space is currently occupied by the Bank’s residential mortgage and commercial lending departments, while the remaining 1,570 square feet is leased to Star Nut Gourmet, a café and specialty food gift store established in 2002.
• Palladium at McLean, 1440 Emerson Avenue, Unit 110, McLean, Virginia 22101, totaling approximately 5,350 square feet. The space is currently under construction to accommodate the Trust & Wealth Department, a new board room, a reception area, and executive offices.
Operations and Administrative Facilities
• Emerson One, 6718 Whittier Avenue, Units 110, 120, and 130, McLean, Virginia 22101, totaling approximately 5,396 square feet. This space houses the Bank’s deposit operations, commercial deposit relationship officers, compliance, information technology, human resources, and accounting departments.
• Emerson One, 6718 Whittier Avenue, Unit 220, McLean, Virginia 22101: This commercial condominium unit, totaling approximately 2,209 square feet, was acquired in February 2025. The Bank plans to remodel this space for use as administrative and accounting offices, although no construction contracts have been executed as of the date of this Annual Report on Form 10-K. If remodeling proceeds, it is expected to be completed by December, 2025, subject to customary permitting and construction timelines. Upon completion, the accounting department will relocate to this unit, freeing up space in Units 110, 120, and 130 for commercial banking officers and other personnel.
59
The Company believes these owned properties adequately meet its current operational needs and provide limited capacity for anticipated future growth. All properties are in good condition and adequately maintained. The Company continuously evaluates its real estate requirements to support future growth and operational efficiency.
The Company believes its properties are adequately covered by insurance and suitable for existing operations. There are no material environmental issues, liens, or other encumbrances affecting these properties that would materially impact their use. The Company will continue to assess its real estate needs in accordance with its strategic objectives and operational requirements.
ITEM 3. LEGAL PROCEEDINGS
We are not presently party to any legal or regulatory proceedings the resolution of which we believe would have a material adverse effect on our business, prospects, financial condition, liquidity, results of operation, cash flows or capital levels. See Note 1, “Organization and Summary of Significant Accounting Policies — Loss Contingencies” to our consolidated financial statements and the notes thereto included elsewhere in this filing for further information regarding our legal and regulatory proceedings.
ITEM 4. MINE SAFETY DISCLOSURES
Not applicable.
60
PART II
ITEM 5. MARKET FOR THE REGISTRANT’S COMMON EQUITY, RELATED STOCKHOLDER MATTERS AND ISSUER PURCHASES OF EQUITY SECURITIES
Market for Common Stock
The Company’s Class A Common Stock is listed and trades on the New York Stock Exchange under the symbol “CBNA,” with trading having commenced on October 4, 2024. As of March 20, 2025, the latest practicable date prior to the filing of this report, the Company had outstanding 3,119,317 shares of Class A Common Stock and 3,442,500 shares of Class B Common Stock. The Class A Common Stock and Class B Common Stock represent 8.31% and 91.69% of the combined voting power of our common stock, respectively. There is no established public trading market for the Company’s Class B Common Stock; however, each outstanding share of Class B Common Stock remains convertible, at the option of the holder, into one share of Class A Common Stock at any time.
As of March 20, 2025, the Company’s Class A Common Stock was held by 28 stockholders of record, including Cede & Co., which holds our beneficial stockholders whose shares were held in “street name” through a broker or bank. The Company’s Class B Common Stock was held by 184 stockholders of record.
During fiscal year 2024, the Company issued a total of 1,992,897 shares of Class A Common Stock in connection with its initial public offering, including 1,850,000 shares issued at the initial closing on October 7, 2024, and 142,897 shares issued on November 1, 2024, pursuant to the underwriters’ partial exercise of their overallotment option to purchase additional shares, each at a public offering price of $22.00 per share. Additionally, 1,056,550 shares of Class B Common Stock were converted into an equivalent number of shares of Class A Common Stock following the IPO and prior to December 31, 2024, at the option of the holders thereof.
Dividends
The Company did not declare or pay any dividends on its Class A Common Stock or Class B Common Stock in fiscal year 2024. The Company does not currently intend to pay dividends on its common equity in the foreseeable future. Instead, the Company currently intends to retain all available earnings to support its growth strategy and business expansion. The payment of dividends in the future will be at the discretion of the Board and is dependent upon, among other things, the Company’s future income, financial position, and capital requirements.
Unregistered Sales and Issuer Repurchases of Common Stock
There were no unregistered sales of the Company’s equity securities during fiscal years ended December 31, 2024 or 2023.
The Company did not repurchase any of its equity securities during fiscal year 2024, including during the three months ended December 31, 2024.
ITEM 6. [Reserved]
61
Item 7. Management’s Discussion and Analysis of Financial Condition and Results of Operations
The following discussion and analysis of our financial condition and results of operations should be read together with our consolidated financial statements and related notes included elsewhere in this Annual Report on Form 10-K. In addition to historical information, this discussion and analysis contains forward-looking statements that involve risks, uncertainties and assumptions that could cause actual results to differ materially from our expectations. Factors that could cause or contribute to such differences include those discussed below and elsewhere in this Annual Report on Form 10-K, particularly in the section entitled “Cautionary Note Regarding Forward-Looking Statements” as well as the section entitled “Risk Factors.” We assume no obligation to update any of these forward-looking statements except to the extent required by law.
The following discussion relates to our historical results, on a consolidated basis. Because we conduct all our material business operations through our wholly owned subsidiary, Chain Bridge Bank, N.A., the discussion and analysis primarily focus on activities conducted at the subsidiary level.
Introduction
Chain Bridge Bancorp, Inc. (the “Company”) is a Delaware corporation and a publicly traded bank holding company whose Class A common stock is listed on the New York Stock Exchange under the symbol “CBNA”. The Company was incorporated on May 26, 2006, and is subject to supervision and regulation by the Board of Governors of the Federal Reserve System under the Bank Holding Company Act of 1956, as amended. The Company serves as the registered bank holding company for Chain Bridge Bank, National Association (the “Bank”), its wholly-owned subsidiary. The Company does not own or control any other subsidiaries and conducts substantially all of its business through the Bank.
We offer a broad range of commercial and personal banking services, including deposit accounts, multiple types of loan products, trust administration, wealth management, and asset custody.
Our mission is to deliver exceptional banking and trust services nationwide, blending financial strength, personalized service, and advanced technology to offer tailored solutions to businesses, non-profit organizations, political organizations, individuals, and families. We aspire to grow responsibly by adapting our personalized service and advanced technology solutions to our clients’ evolving needs while emphasizing liquidity, asset quality, and financial strength. We aim to be recognized for our “Strength, Service, Solutions: Your Bridge to Better Banking Nationwide.”
Reclassification and Initial Public Offering
In connection with the IPO, on October 3, 2024, the Company filed an Amended and Restated Certificate of Incorporation with the Secretary of State of the State of Delaware, which established two new classes of common stock, Class A common stock, par value $0.01 per share (“Class A Common Stock”) and Class B common stock, par value $0.01 per share (“Class B Common Stock”), and reclassified and converted each outstanding share of the Company’s existing common stock, par value $1.00 per share (“Old Common Stock”), into 170 shares of Class B Common Stock (the “Reclassification”).
On October 7, 2024, the Company completed an offering of 1,850,000 shares of Class A Common Stock and received net proceeds of approximately $33.6 million after deducting underwriting discounts and commissions and estimated offering expenses. On November 1, 2024, the Company issued an additional 142,897 shares of Class A Common Stock as a result of the underwriters’ exercise of their 30-day option to purchase up to an additional 277,500 shares of its Class A Common Stock, resulting in net proceeds to the Company of approximately $2.9 million, after deducting underwriting discounts and commissions.
Prior period share information in this Annual Report on Form 10-K is presented on an as adjusted basis giving effect to the Reclassification.
62
Results of Operation and Financial Highlights
Highlights of our results of operations and financial condition as of and for the twelve months ended December 31, 2024 are provided below.
Financial Performance
•Consolidated net income was $20.9 million for the year ended December 31, 2024, compared to $8.8 million for 2023. Earnings per share for the year ended December 31, 2024 was $4.17, compared to $1.93 for 2023.1
•Net interest income, before provision for, or recapture of, credit losses, was $44.4 million for the year ended December 31, 2024, compared to $27.7 million for 2023. Net interest income, after provision for, or recapture of, credit losses was $44.5 million for the year ended December 31, 2024, compared to $27.1 million for 2023.
•Return on average equity was 20.05% for the year ended December 31, 2024, compared to 11.90% for 2023. Return on average assets was 1.62% for the year ended December 31, 2024, compared to 0.86% for 2023.
•Return on average risk-weighted assets was 5.19% for the year ended December 31, 2024, compared to 2.06% for 2023.2
Balance Sheet
•Total assets were $1.4 billion as of December 31, 2024, compared to $1.2 billion as of December 31, 2023.
•Total deposits were $1.2 billion as of December 31, 2024, compared to $1.1 billion as of December 31, 2023. Excluded from these totals are One-Way Sell® deposits, which were placed at other banks through the IntraFi Cash Service® (“ICS®”) network. These One-Way Sell® deposits amounted to $63.3 million as of December, 2024, compared to $130.1 million as of December 31, 2023.
•No non-performing assets or other real estate owned (“OREO”) were reported as of December 31, 2024 or 2023.
•Cash balances held at the Federal Reserve were $406.7 million as of December 31, 2024, compared to $309.8 million as of December 31, 2023.
•As of December 31, 2024, the Bank’s total debt securities portfolio balance was $658.8 million, compared to $566.2 million as of December 31, 2023.
•Book value per share was $21.98 as of December 31, 2024, compared to $18.26 as of December 31, 2023.
•As of December 31, 2024, the Bank exceeded the minimum requirements to be well-capitalized for bank regulatory purposes, with a total risk-based capital ratio of 39.30% and a tier 1 risk-based capital ratio of 38.12%.
•As of December 31, 2024, our liquidity ratio was 85.13%, compared to 78.75% as of December 31, 2023.
Significant Factors Impacting Our Business, Financial Condition and Results of Operations
Several key factors impact our financial performance:
Short-term interest rates: The cyclical nature of our balance sheet and our focus on liquidity cause our primary revenue source, net interest income, to be highly correlated to short-term interest rates. We strive to maintain high liquidity and low loan-to-deposit ratios. Higher rates generally increase our net interest income because of our high levels of liquid interest-earning assets and low levels of interest-bearing deposits and borrowings. Conversely, if short-term interest rates fall, our net interest income would likely decrease due to our high levels of cash. The Federal Reserve reduced its target federal funds rate three times during 2024, during September, November and December, and as short-term rates decline, our net interest income is adversely affected. This relationship between our revenue and the yield curve may differ from that of banks that have lower levels of cash and liquidity and higher loan-to-deposit ratios.
Political organizations and federal election cycles: We provide deposit services to a wide range of political organizations, including political committees registered with the Federal Election Commission (“FEC”), such as campaign committees; party committees; separate segregated funds (including trade association political action committees (“PACs”) and corporate PACs); non-connected committees (including independent expenditure-only committees (“Super PACs”), committees maintaining separate accounts for direct contributions and independent expenditures (“Hybrid PACs”), and committees other than authorized campaign committees, or those affiliated with such committees that are maintained or controlled by a candidate or federal officeholder (collectively, “Leadership PACs”)); and other tax-exempt organizations
1 All earnings for the year ended December 31, 2023 are attributed to Class B shares because no Class A shares were outstanding during the period.
2 Return on average risk-weighted assets is calculated as net income divided by average risk-weighted assets. Average risk-weighted assets are calculated using the last five quarter ends.
63
under Section 527 of the Internal Revenue Code. These accounts are often associated with firms that provide treasury, legal or regulatory compliance services to political organizations.
Federal election cycles significantly affect our deposit levels. These cycles also impact revenue-generating activities, such as wire transfers, payments, check processing, debit card usage, and treasury management services. Historically, deposits from political organizations increase in the periods leading up to federal elections followed by a decline around the elections. Election outcomes may also impact the timing and scale of deposit inflows or outflows from political organizations, and this cycle was no exception. The results of the November 2024 election created opportunities for new post-election accounts and fundraising activities by certain of our political organization clients, which have led to some deposit inflows. However, the precise pace and scale of future deposit inflows and outflows remain uncertain and may deviate from historical patterns. External factors, including our political organization clients’ fundraising and disbursement activities, contribute to this uncertainty.
Additionally, deposits at year-end include funds related to post-election activities and events. These funds have historically been temporary in nature and may be subject to outflows in the coming months. The amount and timing of such movements remain uncertain and are difficult to predict.
Lending approach: Our lending policies are designed to manage credit risk. We seek borrowers with a strong capacity to repay, who have good financial habits, are generally debt averse, and prefer to repay loans quickly. We aim to mitigate credit risk on commercial loans with appropriate structuring, reasonably margined collateral, personal guarantees, a primary deposit relationship, and sometimes compensating balances. Our lending policies typically attract borrowers who may qualify for lower borrowing rates, which may result in lower yields for us.
Economic conditions: General economic conditions, particularly in the Washington, D.C. metropolitan area, and levels of government spending influence our deposit levels and earnings. At various points throughout 2024, we estimate that at least a majority of our deposit balances were sourced from political organizations, which we believe reduces our direct exposure to broader economic trends. However, economic downturns may lead to declines in political donations, which could adversely affect our deposit levels and income. Additionally, national or regional recessions could increase the risk of loan defaults and negatively impact the credit quality of our municipal and corporate bonds, potentially leading to defaults.
Following the January 20, 2025, inauguration of President Trump, the administration has introduced a series of policy proposals aimed at reducing federal expenditures, federal real estate holdings, leases, and the federal workforce. These include a proposed 8% annual reduction in the Department of Defense budget over five years and a hiring policy limiting new hires to one for every four federal employees who leave. Additionally, the newly established Department of Government Efficiency Service (“DOGE”) has announced efforts to cut federal spending by $1 trillion, which may lead to further reductions in government contracts, agency budgets, and workforce levels. While the specifics of these proposals continue to evolve, the potential for significant federal spending cuts represents a known uncertainty that could materially impact the region’s economy.
These measures could have broad economic implications for the Washington, D.C. metropolitan area, given the region’s reliance on federal employment and contracting. As a known uncertainty, a reduction in federal workforce levels and agency budgets could negatively impact the financial stability of consumers and businesses dependent on government spending, increasing the credit risk of our consumer and commercial borrowers. Additionally, decreased demand for commercial office space and housing may place downward pressure on residential and commercial real estate values, which could further affect the region’s economy and the performance of our loan portfolio.
Monetary Policy: We rely on the Federal Reserve’s payment of interest on reserve balances as a source of interest income. The rate of interest on reserve balances is determined by the Federal Reserve. The Federal Reserve has historically adjusted its interest on reserves rate in conjunction with the federal funds rate. We are most exposed to monetary policy during federal election years such as in 2024 when campaign-related deposits rise and we match those liabilities with short-term assets such as Federal Reserve cash balances, which reprice immediately, and Treasury bills. Although higher interest rates decrease the value of our investment securities portfolio, they increase our interest income. While we have recently benefited from high short-term rates, the Federal Reserve reduced its target federal funds rate three times in 2024. To the extent short-term rates decline, our net interest income will be adversely affected. The Federal Reserve has additional monetary tools that can impact our interest income through changes in rates, such as the overnight reverse repo rate and open market operations.
64
Regulatory and Supervisory Environment: We incur significant costs due to our regulation and supervision by the federal government. As a bank holding company, we are subject to comprehensive supervision and regulatory oversight by the Federal Reserve. The Bank’s primary regulator and supervisor is the OCC, which oversees our operations, risk management, compliance, and corporate governance through regular examinations. The Bank is also subject to FDIC secondary regulatory oversight that focuses on insurance standards, risk management practices, and overall regulatory compliance. We pay assessments to the FDIC and the OCC for their insurance and supervision. In addition, we manage our balance sheet to meet regulatory standards, such as capital ratio requirements. Failure to meet these standards may result in corrective actions, restrictions, and increased scrutiny from federal regulators. By adhering to these requirements, we aim to maintain our financial health and strengthen our market position. See Item 1,“Business — Supervision and Regulation.”
Uninsured Deposits: Most of our deposits come from commercial clients rather than retail clients, resulting in a relatively high level of account balances exceeding the FDIC coverage limits. As of December 31, 2024, we estimate that approximately 68.6% of our total deposits were not insured by the FDIC. To manage the associated risks, we aim to maintain high levels of liquidity, asset quality, and financial strength.
For clients with uninsured balances, we offer access to additional FDIC insurance coverage by placing their deposits in increments within the insurance limits at other banks through the ICS® network. We typically earn fee income from ICS® for deposits that are placed at other banks as One-Way Sell® deposits, or we earn interest income when we choose to receive reciprocal deposits through ICS®. Using the ICS® program helps us to manage the size of our balance sheet. See “— Financial Condition — Deposits” below.
Public Company Costs: In preparation for, and following the completion of, our IPO, we have incurred, and expect to continue to incur, additional costs associated with operating as a public company. These costs have included, and will continue to include, additional personnel, legal, consulting, regulatory, insurance, accounting, investor relations and other expenses that we did not incur as a private company. The Sarbanes-Oxley Act, as well as rules adopted by the SEC and national securities exchanges, requires public companies to implement specified corporate governance practices that are now applicable to us as a public company. These additional rules and regulations have increased our legal, regulatory and financial compliance costs and have made some activities more time consuming and costly.
Primary Factors Used to Evaluate Our Business
The most significant factors we use to evaluate our business and results of operations are net income, return on average equity, return on average assets and return on average risk-weighted assets. We also use net interest income, noninterest income and noninterest expense.
Net Income. Our net income depends substantially on net interest income, which is the difference between interest earned on interest-earning assets (usually interest-bearing cash, investment securities and loans) and the interest expense incurred in connection with interest-bearing liabilities (usually interest-bearing deposits and borrowings). Our net income also depends on noninterest income, which is income generated other than by our interest-earning assets. Other factors that influence our net income include our provisions for credit losses, income taxes, and noninterest expenses, which include our fixed and variable overhead costs and other miscellaneous operating expenses.
Return on Average Equity. We use return on average equity to assess our effectiveness in utilizing stockholders’ equity to generate net income. In determining return on average equity for a given period, net income is divided by the average stockholders’ equity for that period.
Return on Average Assets. We monitor return on average assets to measure our operating performance and to determine how efficiently our assets are being used to generate net income. In determining return on average assets for a given period, net income is divided by the average total assets for that period.
Return on Average Risk-Weighted Assets. We use return on average risk-weighted assets to measure how efficiently our assets are being used to generate net income on a risk-adjusted basis. Return on average risk-weighted assets is calculated as annualized net income divided by the average of quarter end risk-weighted assets over the period observed.
Net Interest Income. Net interest income, representing interest income less interest expense, is the largest component of our net income. The level of net interest income is primarily a function of the average balance of interest-earning assets, the average balance of interest-bearing liabilities and the spread between the realized yield on such assets and the cost of such liabilities. Net interest income is impacted by the relative mix of interest-earning assets and interest-bearing liabilities
65
and movements in market interest rates. Net interest income and net interest margin in any one period can be significantly affected by a variety of factors, including the mix and overall size of our earning assets portfolio and the cost of funding those assets. Management calculates the cost of funds performance indicator to monitor funding costs. Cost of funds is calculated as total interest expense divided by the sum of average total interest-bearing liabilities and average demand deposits.
Noninterest Income. Noninterest income consists primarily of service charge income earned from deposit placement services, service charges on accounts, revenue from trust and wealth management services, gains on sale of mortgage loans, net gains or losses on sales of securities and other income. The Company records as noninterest income deposit placement services income for One-Way Sell® deposits which are sold into the ICS® network. See “— Financial Condition — Deposits” for more information on these deposits. Service charges on deposit accounts include fees earned from monthly service charges, account analysis charges and interchange fee income. It also includes fees charged for transaction activities such as wire transfers, cash letters and overdrafts. Trust and wealth management income represents monthly service charges due from clients for managing and administering clients’ assets. Services include investment management and advisory services, custody of assets, trust services, and financial planning. Other income primarily relates to rental income and other minor items.
Noninterest Expense. Noninterest expense relates to fixed and variable overhead costs, the largest component of which is personnel expenses, including salaries and employee benefits. Certain expenses tend to vary based on the volume of activity and other factors, including data processing and communication expenses, occupancy, equipment expense, regulatory assessments and fees, marketing and business development costs, insurance expenses and other operating expenses.
Data processing and communication expenses primarily relate to expenses paid to third party providers of core processing, cloud computing and cybersecurity, a substantial component of which is paid to a core technology provider we rely on for the banking software used by our clients and back office functions. Professional services expenses include internal and external audit, legal, loan review, compliance audit and compliance monitoring fees. Occupancy and equipment expenses include depreciation for buildings and improvements, fixtures and furniture, equipment, and technology related items as well as building related expenses such as utilities and maintenance costs. The Commonwealth of Virginia levies a capital-based franchise tax on banks operating within the state, replacing the state income tax. FDIC and regulatory assessments represent costs incurred to cover quarterly or semi-annual payments to the FDIC or OCC for their insurance or supervision. FDIC assessments are based on a complicated matrix of factors to form an assessment rate, which is then applied to a base of quarterly average assets less quarterly tangible equity. Directors’ fees represent fees paid to our directors for board or committee meetings. Marketing and business development costs include sponsorships, membership dues, as well as marketing and advertising costs, which are subject to normal variability based on the volume and cost of sponsorship and business development activities. Insurance expenses include costs for coverage of fidelity bond, professional liability, property and casualty, workers compensation and cyber liability policies. Other operating costs include other operating and administrative costs such as other vendor and employee costs, postage and printing, office supplies, and subscriptions.
As discussed above, we expect our noninterest expenses to increase as a result of the additional costs associated with being a public company.
Primary Factors Used to Evaluate Our Financial Condition
The most significant factors we use to evaluate and manage our financial condition include liquidity, asset quality and capital.
Liquidity. Maintaining an adequate level of liquidity depends on our ability to efficiently meet both expected and unexpected cash flows and collateral needs without adversely affecting our daily operations or the financial condition of the Bank. Because transaction account deposits form a primary source of our funding, and generally can be withdrawn on demand, managing our liquidity is a top priority. Our account at the Federal Reserve, which held $406.7 million as of December 31, 2024, is a primary source of our liquidity for daily and ongoing activities.
Asset Quality. We monitor the quality of our assets based upon several factors, including the level and severity of deterioration in borrower cash flows and asset quality. We aim to adjust the allowance for credit losses to reflect loan volumes, identified credit and collateral conditions, economic conditions and other qualitative factors.
66
Capital. We manage capital to comply with our internal planning targets and regulatory capital standards. We monitor capital levels on an ongoing basis, perform periodic evaluations under stress scenarios and project capital levels in connection with our strategic goals to ensure appropriate capital levels. We evaluate a number of capital ratios, including Tier 1 capital to total quarterly average assets (the leverage ratio) and total Tier 1 capital to risk weighted assets.
Critical Accounting Policies and Estimates
We prepare our consolidated financial statements according to generally accepted accounting principles in the United States (“GAAP”). Preparing these statements requires management to make estimates and assumptions that affect the reported amounts of assets and liabilities on the balance sheet and the reported amounts of revenues and expenses during the reporting period.
Our most significant accounting policies are described in the Notes to the accompanying Consolidated Financial Statements. These policies, together with the other disclosures presented in the financial statement notes and this Annual Report on Form 10-K, provide information on the valuation of significant assets and liabilities and the methodologies used in determining those values. Based on the valuation techniques applied, and the sensitivity of financial statement amounts to the underlying methods, assumptions, and estimates, we have identified the determination of the allowance for credit losses and the fair value of securities as the areas that involve the most subjective or complex judgments and, as such, could be subject to revision as new information becomes available.
Allowance for Credit Losses on Loans:
The allowance for credit losses on loans is determined based on management’s assessment of expected credit losses over the life of the loan portfolio, utilizing historical loss experience, current economic conditions, management’s assessment of borrower creditworthiness, and other qualitative factors. Given the uncertainty in economic conditions, changes in borrower credit quality, and fluctuations in collateral values, the estimation process is inherently subjective and could materially impact earnings if actual losses differ from those estimated. The adoption of Accounting Standards Update (ASU) 2016-13 Financial Instruments – Credit Losses (Topic 326): Measurement of Credit Losses on Financial Instruments (ASC 326), referred to as the current expected credit loss (“CECL”), further requires the Company to incorporate reasonable and supportable forecasts, increasing the complexity of the estimation process and its sensitivity to changes in the economic outlook.
Fair Value of Securities:
The fair value of securities is considered a critical accounting policy because it requires significant judgment and estimation in determining the appropriate valuation methodologies and inputs, particularly for securities that do not have readily observable market prices. While U.S. Treasury securities and other highly liquid instruments are valued using quoted market prices (Level 1), other securities, such as municipal bonds, corporate bonds, and mortgage-backed securities, often rely on pricing models that incorporate market-based inputs, including interest rates, credit spreads, and benchmark yield curves (Level 2). In cases where market activity is limited or inactive, the valuation process may involve unobservable inputs and management assumptions (Level 3), further increasing estimation uncertainty. Additionally, fluctuations in market conditions, changes in issuer credit quality, and interest rate volatility can significantly impact the fair value of these securities, affecting both the Company’s reported earnings and accumulated other comprehensive income. Given the potential for these fair value estimates to change based on evolving economic and market conditions, they are subject to ongoing reassessment, reinforcing their importance as a key area of financial statement judgment.
The effects of new accounting pronouncements are detailed in Note 1 to the Consolidated Financial Statements, “Organization and Summary of Significant Accounting Policies.”
67
Results of Operations
Net Income
The following table sets forth the principal components of net income for the periods indicated.
| For Year Ended December 31, | ||||||||||||||||||||||||||
(dollars in thousands)
|
2024 | 2023 | $ Change |
% Change |
||||||||||||||||||||||
| Interest and dividend income | $ | 48,075 | $ | 31,789 | $ | 16,286 | 51.2 | % | ||||||||||||||||||
| Interest expense | 3,703 | 4,046 | (343) | (8.5 | %) | |||||||||||||||||||||
| Net interest income | 44,372 | 27,743 | 16,629 | 59.9 | % | |||||||||||||||||||||
| Provision for (recapture of) credit losses | (161) | 641 | (802) | NM | ||||||||||||||||||||||
| Net interest income after provision for (recapture of) credit losses | 44,533 | 27,102 | 17,431 | 64.3 | % | |||||||||||||||||||||
| Noninterest income | 8,580 | 3,281 | 5,299 | 161.5 | % | |||||||||||||||||||||
| Noninterest expense | 26,845 | 19,477 | 7,368 | 37.8 | % | |||||||||||||||||||||
| Net income before taxes | 26,268 | 10,906 | 15,362 | 140.9 | % | |||||||||||||||||||||
| Income tax expense | 5,319 | 2,075 | 3,244 | 156.3 | % | |||||||||||||||||||||
| Net income | $ | 20,949 | $ | 8,831 | $ | 12,118 | 137.2 | % | ||||||||||||||||||
__________
NM — Comparisons of positive and negative values or to zero values are considered not meaningful.
For the year ended December 31, 2024, our net income increased by $12.1 million compared to the year ended December 31, 2023, primarily due to a $16.6 million, or 59.9%, increase in net interest income and a $5.3 million, or 161.5%, increase in noninterest income, derived primarily from fee income earned from One-Way Sell® deposit accounts. An increase of $7.4 million in noninterest expense, driven most notably by increases in employment and professional services costs associated with our IPO, partially offset these positive earnings components. These changes drove a $15.4 million, or 140.9%, increase in net income before taxes, resulting in a $3.2 million, or 156.3%, increase in income tax expense.
Net Interest Income Analysis
Our operating results depend primarily on our net interest income, which is calculated as the difference between interest income on interest-earning assets and interest expense on interest-bearing liabilities. Interest and dividend income consists of interest and fees on loans, interest and dividends on taxable and tax-exempt securities, and interest on interest-bearing deposits in banks. Interest expense consists of interest we pay on deposits and short-term borrowings.
| For the Year Ended December 31, | ||||||||||||||||||||||||||
(dollars in thousands)
|
2024 | 2023 | $ Change |
% Change |
||||||||||||||||||||||
| Interest and dividend income | ||||||||||||||||||||||||||
| Interest and fees on loans | $ | 13,787 | $ | 13,402 | $ | 385 | 2.9 | % | ||||||||||||||||||
| Interest and dividends on securities, taxable | 12,320 | 11,112 | 1,208 | 10.9 | % | |||||||||||||||||||||
| Interest on securities, tax-exempt | 1,145 | 1,219 | (74) | (6.1 | %) | |||||||||||||||||||||
| Interest on interest-bearing deposits in banks | 20,823 | 6,056 | 14,767 | 243.8 | % | |||||||||||||||||||||
| Total interest and dividend income | 48,075 | 31,789 | 16,286 | 51.2 | % | |||||||||||||||||||||
| Interest expense | ||||||||||||||||||||||||||
| Interest on deposits | 3,273 | 3,664 | (391) | (10.7 | %) | |||||||||||||||||||||
| Interest on short-term borrowings | 430 | 382 | 48 | 12.5 | % | |||||||||||||||||||||
| Total interest expense | 3,703 | 4,046 | (343) | (8.5 | %) | |||||||||||||||||||||
| Net interest income | $ | 44,372 | $ | 27,743 | $ | 16,629 | 59.9 | % | ||||||||||||||||||
68
Interest income and expense are affected by fluctuations in interest rates, by changes in the volume of interest-earning assets and interest-bearing liabilities, and by the interaction of these rate and volume factors. The following table presents an analysis of net interest income and net interest margin for the periods indicated. We divide each asset or liability segment’s income or expense by its average daily balance to calculate the average yield or cost.
| For the Year Ended December 31, | |||||||||||||||||||||||||||||||||||
| 2024 | 2023 | ||||||||||||||||||||||||||||||||||
| ($ in thousands) |
Average
balance
|
Interest |
Average
yield/cost
|
Average
balance
|
Interest |
Average
yield/cost
|
|||||||||||||||||||||||||||||
| Assets: | |||||||||||||||||||||||||||||||||||
| Interest-earning assets: | |||||||||||||||||||||||||||||||||||
| Interest-bearing deposits in other banks | $ | 394,094 | $ | 20,823 | 5.28 | % | $ | 115,059 | $ | 6,056 | 5.26 | % | |||||||||||||||||||||||
Investment securities, taxable3
|
517,853 | 12,320 | 2.38 | % | 529,076 | 11,112 | 2.10 | % | |||||||||||||||||||||||||||
Investment securities, tax-exempt3
|
63,429 | 1,145 | 1.80 | % | 67,055 | 1,219 | 1.82 | % | |||||||||||||||||||||||||||
| Loans | 305,364 | 13,787 | 4.52 | % | 314,444 | 13,402 | 4.26 | % | |||||||||||||||||||||||||||
| Total interest-earning assets | 1,280,740 | 48,075 | 3.75 | % | 1,025,634 | 31,789 | 3.10 | % | |||||||||||||||||||||||||||
| Less allowance for credit losses | (4,643) | (4,792) | |||||||||||||||||||||||||||||||||
| Non-interest-earning assets | 16,970 | 10,570 | |||||||||||||||||||||||||||||||||
| Total assets | $ | 1,293,067 | $ | 1,031,412 | |||||||||||||||||||||||||||||||
Liabilities and stockholders’ equity |
|||||||||||||||||||||||||||||||||||
| Interest-bearing liabilities: | |||||||||||||||||||||||||||||||||||
| Savings, interest-bearing checking and money market | 233,217 | 2,887 | 1.24 | % | 284,706 | 3,147 | 1.11 | % | |||||||||||||||||||||||||||
| Time deposits | 13,341 | 386 | 2.89 | % | 18,037 | 517 | 2.87 | % | |||||||||||||||||||||||||||
| Short term borrowings | 5,301 | 430 | 8.11 | % | 5,167 | 382 | 7.39 | % | |||||||||||||||||||||||||||
| Total interest-bearing liabilities | 251,859 | 3,703 | 1.47 | % | 307,910 | 4,046 | 1.31 | % | |||||||||||||||||||||||||||
Noninterest-bearing liabilities: |
|||||||||||||||||||||||||||||||||||
| Demand deposits | 930,978 | 645,418 | |||||||||||||||||||||||||||||||||
| Other liabilities | 5,727 | 3,874 | |||||||||||||||||||||||||||||||||
| Total liabilities | 1,188,564 | 957,202 | |||||||||||||||||||||||||||||||||
| Stockholders’ equity | 104,503 | 74,210 | |||||||||||||||||||||||||||||||||
| Total liabilities and stockholder’s equity | $ | 1,293,067 | $ | 1,031,412 | |||||||||||||||||||||||||||||||
| Net interest income | 44,372 | 27,743 | |||||||||||||||||||||||||||||||||
| Net interest margin | 3.46 | % | 2.70 | % | |||||||||||||||||||||||||||||||
3 Average balances for securities transferred from available for sale to held to maturity at fair value are shown at carrying value. Average balances for available for sale and all other held to maturity bonds are shown at amortized cost.
69
The rate/volume table below presents the composition of the change in net interest income for the periods indicated, as allocated between the change in net interest income due to a change in the volume of average interest-earning assets and interest-bearing liabilities, and the changes in net interest income that are due to changes in average rates. Volume and rate changes are allocated on a consistent basis using the respective percentage changes in average balances and average rates.
| For the Year Ended December 31, 2024 compared to 2023 |
|||||||||||||||||
| Increase (decrease) due to change in: | |||||||||||||||||
(dollars in thousands)
|
Average volume |
Average rate |
Total | ||||||||||||||
| Interest-earning assets | |||||||||||||||||
| Interest-bearing deposits in other banks | $ | 14,686 | $ | 81 | $ | 14,767 | |||||||||||
| Taxable investment securities | (236) | 1,444 | 1,208 | ||||||||||||||
| Non-taxable investment securities | (66) | (8) | (74) | ||||||||||||||
| Loans | (387) | 772 | 385 | ||||||||||||||
| Total increase in interest income | $ | 13,997 | $ | 2,289 | $ | 16,286 | |||||||||||
| Interest-bearing liabilities | |||||||||||||||||
| Savings, interest-bearing checking and money market accounts | $ | (569) | $ | 309 | $ | (260) | |||||||||||
| Time deposits | (135) | 4 | (131) | ||||||||||||||
| Short-term borrowings | 10 | 38 | 48 | ||||||||||||||
| Total increase (decrease) in interest expense | $ | (694) | $ | 351 | $ | (343) | |||||||||||
| Increase in net interest income | $ | 14,691 | $ | 1,938 | $ | 16,629 | |||||||||||
For the year ended December 31, 2024, our net interest income increased by $16.6 million, or 59.9%, compared to the year ended December 31, 2023, primarily driven by a $14.7 million increase in the average volume of interest-bearing deposits in other banks, principally at the Federal Reserve. This increase was primarily due to cyclical inflows of deposits from political organizations ahead of the 2024 federal elections, which started building in the second half of 2023 and were invested in interest-earning assets, such as reserves at the Federal Reserve. As a result, our net interest margin increased to 3.46% for the year ended December 31, 2024, from 2.70% for the year ended December 31, 2023.
Interest Income
Interest and fees on loans. Loan interest income is comprised of fixed and adjustable-rate structures related to residential and commercial real estate loan products, commercial loans and other consumer loan products. Deferred loan origination fees, net of deferred loan origination costs, accrete to the loan’s yield over the life of the loan. For the year ended December 31, 2024, our interest and fees on loans increased 2.9% to $13.8 million compared to the year ended December 31, 2023 primarily driven by a 26 basis point increase in average yield which was offset by a reduction of the average total loan balance of $9.1 million. The months following a general election, including the last months of 2024 and the first months of 2023, often see elevated commercial and industrial loan balances, as political organizations typically utilize their lines of credit around election periods and may repay these balances over the subsequent six to twelve months, or as cash flows allow. In addition, rising interest rates caused a reduction in demand for consumer loans during the time between periods, and management has strategically allowed a decline in the commercial real estate portfolio. Rising interest rates have increased the cost of borrowing and remote work trends continue to be a concern for the commercial real estate portfolio. These factors negatively impact the value of commercial properties, making commercial real estate loans less attractive.
See “— Financial Condition — Loan Portfolio” below for an analysis of the composition of our loan portfolio.
Interest and dividends on securities, taxable. For the year ended December 31, 2024, our interest and dividends on taxable securities increased 10.9% to $12.3 million from $11.1 million for the year ended December 31, 2023. The average balance for all taxable securities decreased $11.2 million when comparing the periods, although the decline was fully offset by a 28 basis point increase in yield. As portions of maturing bonds have been reinvested, we have observed a steady increase in the average yield for the taxable securities portfolio. In addition to actively reinvesting maturing bonds during the second half of 2024, the Company invested funds from temporarily elevated deposit levels in short term U.S. Treasury
70
securities that were organized to mature in the fourth quarter of 2024 or the first quarter of 2025, aligning with the timing of expected deposit outflows following the 2024 federal elections and post-election activities.
Interest on securities, tax-exempt. For the year ended December 31, 2024, our interest on tax-exempt securities decreased 6.1% from the prior period due primarily to a $3.6 million decline in the average balance of tax-exempt securities. In recent years, the attainable yields for any new investment in this segment and the investment landscape have left tax-exempt securities less attractive than their taxable counterparts. Accordingly, as tax-exempt securities have matured, those proceeds have been invested into taxable municipal securities.
See “— Financial Condition — Securities” below for an analysis of the composition of the securities portfolio, including taxable and tax-exempt securities.
Interest on interest-bearing deposits in banks. Chain Bridge earns interest for accounts held at certain correspondent banks, which are primarily reserves held at the Federal Reserve. The Federal Reserve has historically adjusted its interest on reserves rate in conjunction with the federal funds rate. The interest rate paid by the Federal Reserve on reserve balances increased from 5.15% to 5.40% on July 27, 2023 and decreased three times throughout 2024, to 4.40% on December 19, 2024. For the year ended December 31, 2024, our interest on interest-bearing deposits in banks increased by $14.8 million compared to the prior period, primarily driven by a $279.0 million increase in average balances.
Interest Expense
Interest on deposits. The Bank pays a variable interest rate to depositors for their non-maturing savings, interest-bearing checking, and money market accounts. In addition, the Bank issues time deposits that pay a fixed rate of interest until the instrument matures. For the year ended December 31, 2024, our interest expense on deposits decreased 10.7% compared to the prior period. The decrease was primarily driven by a $56.2 million decrease in average interest-bearing deposit balances, partially offset by a 0.13% increase in the average rate. As of December 31, 2024 and December 31, 2023, approximately 73.1% and 69.0%, respectively, of our deposits were noninterest-bearing.
See “— Financial Condition — Deposits” for an analysis of the composition of the deposits portfolio, including its interest-bearing and noninterest-bearing components.
Interest on short-term borrowings. In 2024, the Company used its $10.0 million unsecured line of credit with a correspondent bank, maintaining a $5.0 million balance from January until June, when an additional $5.0 million was drawn, bringing the total to $10.0 million. The interest rate applicable to advances under this unsecured line of credit was determined by the reference rate the Company elects to have applied to the advance, which may be the correspondent bank’s base rate, the daily Secured Overnight Financing Rate (“SOFR”) or a term SOFR rate, plus a credit spread adjustment. On October 10, 2024, the Company used a portion of the net proceeds from the IPO to fully repay the $10.0 million outstanding principal balance on this line of credit and closed the line on October 11, 2024. Substantially all interest on short-term borrowings reported during 2024 and 2023 was related to this line of credit. The Bank currently has no borrowings, and there are no outstanding draws on its lines of credit with the FHLB, the Federal Reserve, or other third-party institutions.
For the year ended December 31, 2024, interest on short-term borrowings increased by 12.5% compared to the prior period, due to a $134 thousand increase in the average outstanding balance as well as an increase in the average rate from 7.39% to 8.11%.
Provision for Credit Losses
The allowance for credit losses (“ACL”) represents an amount which, in management’s judgment, is adequate to absorb the lifetime expected credit losses that may be sustained on outstanding loans and investments at the balance sheet date. The provision for credit losses represents the amount of expense charged to current earnings to fund an increase in the
71
ACL. Conversely, a recapture of credit loss is recorded to earnings when the ACL is reduced. Our provisions for or recaptures of credit losses arising from within the loan and securities portfolios were as follows:
| For the Year Ended December 31, | |||||||||||||||||||||||
(dollars in thousands)
|
2024 | 2023 | $ Change |
% Change |
|||||||||||||||||||
| Provision for (recapture of) credit losses | |||||||||||||||||||||||
| Provision for (recapture of) loan credit losses | $ | 195 | $ | (163) | $ | 358 | NM | ||||||||||||||||
| Provision for (recapture of) securities credit losses | (356) | 804 | (1,160) | NM | |||||||||||||||||||
| Total provision for (recapture of) credit losses | $ | (161) | $ | 641 | $ | (802) | NM | ||||||||||||||||
__________
NM — Comparisons of positive and negative values or to zero values are considered not meaningful.
For the year ended December 31, 2024, our provision for credit losses consisted of a net recapture of $161 thousand, compared to a net provision of $641 thousand for the year ended December 31, 2023. During 2024, we received proceeds totaling $210 thousand for a bond we wrote off in its entirety during 2023 related to a single corporate issuer whose business was ultimately closed by a regulatory authority. In addition, we recaptured provisions totaling $356 thousand during 2024 because the shortening time to maturity of our held to maturity securities portfolio resulted in a lower required reserve in accordance with our ACL methodology, compared to the $804 thousand provision for securities credit losses recorded for the year ended December 31, 2023 which pertains to a single corporate bond discussed above.
Noninterest Income
Noninterest income consists of deposit placement services income, service charges on deposit accounts, trust and wealth management income, gains on sale of mortgage loans, net gains or losses on sales of securities and other income.
| Year Ended December 31, | |||||||||||||||||||||||
(dollars in thousands)
|
2024 | 2023 | $ Change |
% Change |
|||||||||||||||||||
| Noninterest income | |||||||||||||||||||||||
| Deposit placement services income | $ | 6,199 | $ | 1,974 | $ | 4,225 | 214.0 | % | |||||||||||||||
| Service charges on accounts | 1,405 | 918 | 487 | 53.1 | % | ||||||||||||||||||
| Trust and wealth management income | 907 | 565 | 342 | 60.6 | % | ||||||||||||||||||
| Gain on sale of mortgage loans | 27 | 12 | 15 | 125.9 | % | ||||||||||||||||||
| Loss on sale of securities | (81) | (389) | 308 | (79.2 | %) | ||||||||||||||||||
| Other income | 123 | 201 | (78) | (39.0 | %) | ||||||||||||||||||
| Total noninterest income | $ | 8,580 | $ | 3,281 | $ | 5,299 | 161.5 | % | |||||||||||||||
__________
NM — Comparisons from positive to negative values or to zero values are considered not meaningful.
For the year ended December 31, 2024, our noninterest income increased by $5.3 million, or 161.5%, to $8.6 million compared to the prior period primarily driven by an increase in fee income on One-Way Sell® deposits sold through the ICS® network.
Deposit placement services income. For the year ended December 31, 2024, our deposit placement services income increased by $4.2 million to $6.2 million compared to the year ended December 31, 2023. During the comparative period, the increase in deposit placement services income is a direct result of the increase in the volume of One-Way Sell® deposits, and changes in the rate paid by ICS® for those deposits which typically adjust in a manner parallel to federal funds rate adjustments. Accounts enrolled in the ICS® network are further discussed under “— Financial Condition — Deposits” below.
Service charges on accounts. For the year ended December 31, 2024, our service charges on accounts increased by $487 thousand, or 53.1%, compared to the year ended December 31, 2023, primarily driven by higher transaction volume, particularly among check processing, wire transfers and debit card usage. Our fee income is typically higher during the
72
fiscal quarters prior to and during the general election as political organization deposit account activity causes an increase in bank transactions.
Trust and wealth management income. For the year ended December 31, 2024, our trust and wealth management income increased by 60.6%, compared to the corresponding period in the prior year. This increase was primarily due to a rise in the volume of total assets under administration, which grew to $330.3 million at December 31, 2024 from $240.1 million at December 31, 2023. The size and mix of the assets under administration drove the income growth. Assets under management, which produce a higher rate of income under our fee structure, increased 70.4% from December 31, 2023, while assets under custody increased 22.8% over the same period.
Our trust and wealth management services utilize service charge structures for assets under management (“AUM”) and assets under custody (“AUC”) that are distinct with respect to the level and range of services used. Service charges for AUM are calculated as a percentage of the assets managed, with the rate varying based on the type of service provided, such as investment management or fiduciary services, and tiered based on the value of the assets under management. These service charges are not performance-based. Service charges for AUC are also tiered based on the value of the assets under custody, and are generally lower than the service charges for AUM, reflecting the more limited services provided, such as safekeeping and administrative functions.
The service charges we collect for AUM are subject to fluctuations in the total value of assets managed, which can vary with changes in market conditions, including stock prices and bond yields. Therefore, any significant market volatility or changes in interest rates could impact the valuation of the assets we manage, thereby affecting the service fees we collect.
The growth in AUC during the period was largely driven by clients seeking higher interest rates. A material decline in interest rates could result in a reduction of custody balances, negatively impacting our revenue from these accounts. Additionally, a substantial portion of our custody account balances are related to political organizations, which are seasonal and are expected to decline following periods of high spending around federal elections.
Gain on sale of mortgage loans. For the year ended December 31, 2024, the gain on sale of mortgages increased by $15 thousand compared to the year ended December 31, 2023.
Loss on sale of securities. Because Chain Bridge historically has not actively engaged in bond sales, gains and losses from sales of securities are irregular. For the year ended December 31, 2024, our loss on sale of securities was $81 thousand, compared to a $389 thousand loss for 2023. Sales in both 2024 and 2023 were a result of decisions to divest of specific corporate issuers.
73
Noninterest Expense
Noninterest expense consists of salaries and employee benefits, data processing and communication expenses, professional services, occupancy and equipment expenses, Virginia bank franchise tax, FDIC and regulatory assessments, directors’ fees, marketing and business development costs, insurance expenses, and other operating expenses.
| Year Ended December 31, | |||||||||||||||||||||||
(dollars in thousands)
|
2024 | 2023 | $ Change |
% Change |
|||||||||||||||||||
| Noninterest expenses | |||||||||||||||||||||||
| Salaries and employee benefits | $ | 15,906 | $ | 12,359 | $ | 3,547 | 28.7 | % | |||||||||||||||
| Professional services | 3,163 | 909 | 2,254 | 248.0 | % | ||||||||||||||||||
| Data processing and communication expenses | 2,614 | 2,276 | 338 | 14.8 | % | ||||||||||||||||||
| Occupancy and equipment expenses | 982 | 936 | 46 | 4.9 | % | ||||||||||||||||||
| Virginia bank franchise tax | 884 | 739 | 145 | 19.6 | % | ||||||||||||||||||
| FDIC and regulatory assessments | 753 | 585 | 168 | 28.7 | % | ||||||||||||||||||
| Directors fees | 650 | 367 | 283 | 77.1 | % | ||||||||||||||||||
| Insurance expenses | 340 | 225 | 115 | 51.0 | % | ||||||||||||||||||
| Marketing and business development costs | 313 | 239 | 74 | 30.9 | % | ||||||||||||||||||
| Other operating expenses | 1,240 | 842 | 398 | 47.3 | % | ||||||||||||||||||
| Total noninterest expenses | $ | 26,845 | $ | 19,477 | $ | 7,368 | 37.8 | % | |||||||||||||||
For the year ended December 31, 2024, our noninterest expense increased by $7.4 million, or 37.8%, compared to the prior year, primarily driven by increases in salaries and employee benefits costs, as well as an increase in professional services costs related to the process of becoming a public company and costs associated with the Reclassification.
Salaries and employee benefits. During the year ended December 31, 2024, our salaries and employee benefits increased $3.5 million, or 28.7%, compared to the corresponding period in the prior year driven by a higher headcount, salary increases, and higher employee benefits plan costs.
Professional services. For the year ended December 31, 2024, our professional services expense increased $2.3 million or 248.0%, compared to the year ended December 31, 2023, primarily driven by legal and consulting expenses incurred in connection with the Reclassification and the Company’s preparations for, and ongoing operation as, a public company.
Data processing and communication expenses. For the year ended December 31, 2024, our data processing and communication expenses increased $338 thousand, or 14.8%, compared to the year ended December 31, 2023, primarily driven by increased data processing fees charged by our core provider arising from periodic rate increases and purchases of new products, increased cloud computing and cybersecurity costs incurred with our IT-managed services provider, the installation of a new financial reporting tool, and an increase in core processing expenses incurred by the Trust & Wealth Department on account of growth in managed assets and custody accounts.
Occupancy and equipment expenses. For the year ended December 31, 2024, our occupancy and equipment expenses were relatively unchanged compared to the year ended December 31, 2023.
Virginia bank franchise tax. For the year ended December 31, 2024, our Virginia bank franchise tax increased $145 thousand, or 19.6%, compared to the year ended December 31, 2023, primarily driven by the growth in the Bank’s capital which forms the basis for the tax computation.
FDIC and regulatory assessments. For the year ended December 31, 2024, our FDIC and regulatory assessments expense increased $168 thousand, or 28.7%, compared to the year ended December 31, 2023, primarily driven by the high year-over-year average asset growth which elevates the assessment base.
Directors’ fees. In the year ended December 31, 2024, our directors’ fees increased by $283 thousand, or 77.1%, compared to the year ended December 31, 2023, primarily driven by an increase in the number of board and committee meetings held during 2024, as well as an increase in board and committee fees.
74
Insurance expenses. For the year ended December 31, 2024, our insurance expenses increased $115 thousand, or 51.0%, compared to the year ended December 31, 2023. The increase was primarily due to increased costs associated with directors and officers insurance, as a result of our preparations for, and ongoing operations as, a public company.
Marketing and business development costs. For the year ended December 31, 2024, our marketing and business development costs increased $74 thousand, or 30.9%, compared to the year ended December 31, 2023, largely due to public relations activities surrounding the IPO.
Other operating costs. This segment includes other operating and administrative costs such as other vendor and employee costs, postage and printing, office supplies and subscriptions. For the year ended December 31, 2024, the increase in our other operating costs during the period was driven primarily by increased travel and subscription costs, which increased $150 thousand and $185 thousand, respectively, compared to the year ended December 31, 2023.
Income Tax Expense
Income tax expense incurred is based upon our pre-tax income adjusted for tax exempt income and temporary deferred tax assets or liabilities. For the year ended December 31, 2024, our income tax expense was $5.3 million, representing an increase of 156.3%, compared to $2.1 million for the year ended December 31, 2023. The increase was driven by the increase in pre-tax earnings, which increased 140.9% during the comparable period.
Our effective income tax rate was 20.25% for the year ended December 31, 2024, an increase of 1.19% from 19.03% for the year ended December 31, 2023. During 2024, the effective income tax rate increased compared to the prior period because pre-tax income increased while tax-exempt income decreased, causing tax-exempt income to comprise a lower proportion of income before taxes.
Financial Condition
Securities
We maintain a securities portfolio to provide liquidity, manage risk, meet capital requirements, and generate interest income. The portfolio primarily consists of U.S. Treasury securities, corporate bonds, and state and municipal securities, with smaller allocations to U.S. government agency and mortgage-backed securities. Securities that management has the positive intent and ability to hold to maturity are classified as “held to maturity” (“HTM”) and recorded at amortized cost. Securities not classified as held to maturity or trading are classified as “available for sale” (“AFS”) and recorded at fair value, with unrealized gains and losses excluded from earnings and reported in other comprehensive loss. We do not hold trading securities.
75
The following table summarizes the amortized cost and weighted average yield of securities as of December 31, 2024 by contractual maturities.
| Balance as of December 31, 2024 | |||||||||||||||||||||||
| Available-for-Sale | Held-to-Maturity | ||||||||||||||||||||||
(dollars in thousands)
|
Amortized Cost |
Weighted Average Yield |
Amortized Cost |
Weighted Average Yield |
|||||||||||||||||||
| U.S. government and federal agencies | |||||||||||||||||||||||
| Due in one year or less | $ | 181,033 | 4.24% | $ | 25,856 | 1.91% | |||||||||||||||||
| Due after one year through five years | 23,026 | 2.69% | 68,621 | 1.74% | |||||||||||||||||||
| Due after five years through ten years | 3,876 | 1.45% | 25,423 | 1.77% | |||||||||||||||||||
| Due after ten years | — | —% | 2,552 | 1.77% | |||||||||||||||||||
| 207,935 | 4.02% | 122,452 | 1.79% | ||||||||||||||||||||
| Mortgage-backed securities | |||||||||||||||||||||||
| Due in one year or less | 796 | 2.09% | — | — | % | ||||||||||||||||||
| Due after one year through five years | 2,820 | 2.06% | — | — | % | ||||||||||||||||||
| Due after five through ten years | 522 | 2.96% | — | — | % | ||||||||||||||||||
| Due after ten years | 3,838 | 2.95% | 1,168 | 4.62% | |||||||||||||||||||
| 7,976 | 2.55% | 1,168 | 4.62% | ||||||||||||||||||||
| Corporate bonds | |||||||||||||||||||||||
| Due in one year or less | 24,448 | 3.21% | 12,484 | 2.36% | |||||||||||||||||||
| Due after one year through five years | 19,763 | 3.34% | 44,480 | 2.65% | |||||||||||||||||||
| Due after five years through ten years | — | — | % | 506 | 2.83% | ||||||||||||||||||
| Due after ten years | 496 | 7.34% | — | —% | |||||||||||||||||||
| 44,707 | 3.31% | 57,470 | 2.59% | ||||||||||||||||||||
| State and municipal securities | |||||||||||||||||||||||
| Due in one year or less | 32,076 | 3.05% | 4,336 | 2.66% | |||||||||||||||||||
| Due after one year through five years | 50,991 | 2.38% | 56,960 | 2.20% | |||||||||||||||||||
| Due after five years through ten years | 21,138 | 2.08% | 57,685 | 2.30% | |||||||||||||||||||
| Due after ten years | 500 | 3.75% | 582 | 2.59% | |||||||||||||||||||
| 104,705 | 2.53% | 119,563 | 2.27% | ||||||||||||||||||||
| Total securities | $ | 365,323 | 3.47% | $ | 300,653 | 2.14% | |||||||||||||||||
The weighted average yield is calculated using the amortized cost and yield on each security. Each security’s amortized cost is multiplied by its yield and then divided by the respective category total. The resulting values are summed to arrive at the weighted average yield. The yields on tax-exempt securities have not been calculated on a fully tax equivalent basis.
76
The following table summarizes our securities portfolio by security type as of the dates indicated. AFS securities are reported at fair value and HTM securities are reported at amortized cost:
| As of December 31, | As of December 31, | ||||||||||||||||||||||||||||||||||
| 2024 | 2023 | Change | |||||||||||||||||||||||||||||||||
(dollars in thousands)
|
$ | % of total securities |
$ | % of total securities |
$ | % | |||||||||||||||||||||||||||||
| U.S. Treasury securities | $ | 320,976 | 48.7 | % | $ | 195,364 | 34.5 | % | $ | 125,612 | 64.3 | % | |||||||||||||||||||||||
| U.S. federal agency securities | 7,879 | 1.2 | % | 20,871 | 3.7 | % | (12,992) | (62.2 | %) | ||||||||||||||||||||||||||
| Mortgage-backed securities | 8,563 | 1.3 | % | 9,839 | 1.7 | % | (1,276) | (13.0 | %) | ||||||||||||||||||||||||||
| Corporate bonds | 101,444 | 15.4 | % | 115,101 | 20.3 | % | (13,657) | (11.9 | %) | ||||||||||||||||||||||||||
| State and municipal securities | 220,120 | 33.4 | % | 225,345 | 39.8 | % | (5,225) | (2.3 | %) | ||||||||||||||||||||||||||
| Total securities | $ | 658,982 | 100.0 | % | $ | 566,520 | 100.0 | % | $ | 92,462 | 16.3 | % | |||||||||||||||||||||||
Total securities. As of December 31, 2024, our total debt securities, excluding the allowance for credit losses, were $659.0 million, representing an increase of $92.5 million, or 16.3%, from $566.5 million as of December 31, 2023. The increase was primarily driven by investing excess cash into U.S. Treasury securities maturing in the first quarter of 2025.
U.S. Treasury securities. U.S. Treasury securities represent debt securities backed by the the full faith and credit of the U.S. government, guaranteeing the timely payment of interest and principal when held to maturity. As of December 31, 2024, our U.S. government treasuries increased by $125.6 million, or 64.3%, compared to December 31, 2023. During 2024, we invested a portion of our excess cash reserves in short term U.S. Treasury securities that mature in the first quarter of 2025.
U.S. federal agency securities. U.S. federal agency securities represent obligations issued by U.S. federal government agencies or government-sponsored enterprises, which guarantee repayment of principal at maturity. As of December 31, 2024, our U.S. federal agencies securities decreased by $13.0 million, or 62.2%, compared to December 31, 2023. These bonds were called or matured during 2024, and were not replaced with similar investments.
Mortgage-backed securities. Our mortgage-backed securities portfolio consists of pass-through and agency-issued collateralized mortgage obligations. As of December 31, 2024, our mortgage-backed securities decreased by $1.3 million, or 13.0%, compared to December 31, 2023. During the period, mortgage-backed securities represented less than 2.0% of our securities portfolio.
Corporate bonds. Corporate bonds are debt obligations issued by companies to raise capital and refinance obligations of the issuer. As of December 31, 2024, our corporate bonds decreased by $13.7 million, or 11.9%, compared to December 31, 2023, due to maturities within the portfolio which have not been subsequently replaced with similar investments.
State and municipal securities. State and municipal securities are debt obligations issued by state and local governments. As of December 31, 2024, our state and municipal securities decreased by $5.3 million, or 2.3% compared to December 31, 2023, due to maturities within the portfolio that were not subsequently replaced with similar investments.
Allowance for Credit Losses — Securities
Management measures expected credit losses on HTM debt securities on a collective basis by major security type (U.S. government and federal agencies, agency mortgage-backed securities, corporate bonds and state and municipal securities). We estimate expected credit losses based on our historical credit loss information as adjusted for current conditions and reasonable and supportable forecasts. Securities issued by the U.S. Treasury or government agencies are not considered to be credit sensitive as they are explicitly or implicitly guaranteed by the U.S. government, and result in expectations of zero credit loss. Accordingly, management’s analysis of credit loss considers only the corporate and municipal segments.
For AFS debt securities in an unrealized loss position, management first assesses whether it intends to sell, or if it is more likely than not that it will be required to sell, the security before recovery of its amortized cost basis. If either of the criteria regarding intent or requirement to sell is met, the security’s amortized cost basis is written down to fair value
77
through income. For AFS debt securities that do not meet the aforementioned criteria, management evaluates whether the decline in fair value has resulted from credit losses or other factors. In making this assessment, management considers the extent to which fair value is less than amortized cost, any changes to the rating of the security by a rating agency, and adverse conditions specifically related to the security, among other factors. If this assessment indicates that a credit loss exists, the present value of cash flows expected to be collected from the security are compared to the amortized cost basis of the security. If the present value of cash flows expected to be collected is less than the amortized cost basis, a credit loss exists, and an allowance for credit loss is recorded for the credit loss, limited by the amount by which the fair value is less than the amortized cost basis. Any impairment that has not been recorded through an allowance for credit loss is recognized in other comprehensive income (loss).
The following table presents an analysis of the allowance for credit losses on securities:
| Held to Maturity: | As of and for the year ended December 31, |
||||||||||
(dollars in thousands)
|
2024 | 2023 | |||||||||
| Average HTM debt securities outstanding | $ | 305,885 | $ | 311,209 | |||||||
| Total outstanding HTM debt securities at end of each period | 300,653 | 308,406 | |||||||||
| Allowance for credit losses at the beginning of period | 348 | — | |||||||||
| Impact of adopting ASC 326 | — | 329 | |||||||||
| Provision for (recapture of) for credit losses | (146) | 19 | |||||||||
| Total charge-offs | — | — | |||||||||
| Total recoveries | — | — | |||||||||
| Net (charge-offs) recoveries | — | — | |||||||||
| Allowance for credit losses at end of period | 202 | 348 | |||||||||
| Ratio of allowance to total HTM debt securities outstanding at period end | 0.07 | % | 0.11 | % | |||||||
| Ratio of nonaccrual HTM securities to total HTM securities outstanding at period end | — | — | |||||||||
| Ratio of allowance to nonaccrual debt securities at period end | — | — | |||||||||
| Available-for-Sale: | As of and for the year ended December 31, |
||||||||||
(dollars in thousands)
|
2024 | 2023 | |||||||||
| Average AFS debt securities outstanding | $ | 263,243 | $ | 267,282 | |||||||
| Total outstanding AFS debt securities at end of each period | 358,329 | 258,114 | |||||||||
| Allowance for credit losses at the beginning of period | — | — | |||||||||
| Provision for (recapture of) for credit losses | (210) | 785 | |||||||||
| Charge-offs: | |||||||||||
| Corporate | — | (785) | |||||||||
| Total charge-offs | — | (785) | |||||||||
| Recoveries: | |||||||||||
| Corporate | 210 | — | |||||||||
| Total recoveries | 210 | — | |||||||||
| Net (charge-offs) recoveries | 210 | (785) | |||||||||
| Allowance for credit losses at end of period | — | — | |||||||||
| Ratio of allowance to total AFS debt securities outstanding at period end | — | % | — | % | |||||||
| Ratio of nonaccrual AFS securities to total AFS securities outstanding at period end | — | — | |||||||||
| Ratio of allowance to nonaccrual debt securities at period end | — | — | |||||||||
In 2023, we recorded a charge-off related to a credit loss on a specific bond due to regulatory actions against the issuer. This bond, initially classified as HTM, was reclassified to AFS based on significant credit deterioration. The bond
78
was partially sold at a loss, with the remainder written off. During the year ended December 31, 2024, we received proceeds totaling $210 thousand for the bond and recorded a recovery of credit loss. There was no further activity related to the AFS allowance for credit loss in 2024.
The following table presents the allocation of the allowance for credit losses on our HTM securities portfolios by segment. There was no ACL established for the AFS portfolio as of the indicated period ends.
| As of December, | |||||||||||||||||||||||
| 2024 | 2023 | ||||||||||||||||||||||
|
Balance at the end of each period
(dollars in thousands)
|
Amount | % to total HTM bonds |
Amount | % to total HTM bonds |
|||||||||||||||||||
| U.S. government and federal agencies | $ | — | — | % | $ | — | — | % | |||||||||||||||
| Mortgage-backed securities | — | — | % | — | — | % | |||||||||||||||||
| Corporate | 171 | 0.06 | % | 322 | 0.10 | % | |||||||||||||||||
| State and municipal | 31 | 0.01 | % | 26 | 0.01 | % | |||||||||||||||||
| Total | $ | 202 | 0.07 | % | $ | 348 | 0.11 | % | |||||||||||||||
The following tables present the allocation of the net charge offs within the AFS securities portfolio by segment.
| As of and for the year ended December 31, | |||||||||||||||||||||||||||||||||||
| 2024 | 2023 | ||||||||||||||||||||||||||||||||||
(dollars in thousands)
|
Net (charge-offs) recoveries |
Average AFS securities outstanding |
Ratio of net (charge-offs) recoveries to average total bonds outstanding |
Net (charge-offs) recoveries |
Average AFS securities outstanding |
Ratio of net (charge-offs) recoveries to average total bonds outstanding |
|||||||||||||||||||||||||||||
| U.S. government and federal agencies | $ | — | $ | 103,746 | — | % | $ | — | $ | 94,072 | — | % | |||||||||||||||||||||||
| Mortgage-backed securities | — | 8,165 | — | % | — | 9,562 | — | % | |||||||||||||||||||||||||||
| Corporate | 210 | 51,185 | 0.08 | % | (785) | 59,611 | (0.29) | % | |||||||||||||||||||||||||||
| State and municipal | — | 100,147 | — | % | — | 104,036 | — | % | |||||||||||||||||||||||||||
Loan Portfolio
Our loan portfolio consists of mortgage, commercial, and consumer loans to clients. A substantial portion of our loan portfolio is represented by residential real estate and commercial real estate loans throughout the Washington, D.C. metropolitan area. The ability of our debtors to honor their contracts is dependent upon a number of factors, including the real estate and general economic conditions in this area.
The following table summarizes our loan portfolio by the type of loans as of the dates indicated:
| As of December 31, | |||||||||||||||||||||||||||||||||||
| 2024 | 2023 | Change | |||||||||||||||||||||||||||||||||
(dollars in thousands)
|
Amount | % of Total Loans |
Amount | % of Total Loans |
$ | % | |||||||||||||||||||||||||||||
| Commercial real estate | $ | 53,480 | 17.1 | % | $ | 60,138 | 19.8 | % | $ | (6,658) | (11.1 | %) | |||||||||||||||||||||||
| Commercial | 27,883 | 8.9 | % | 12,438 | 4.1 | % | 15,445 | 124.2 | % | ||||||||||||||||||||||||||
| Residential real estate, closed-end | 210,730 | 67.2 | % | 210,358 | 69.1 | % | 372 | 0.2 | % | ||||||||||||||||||||||||||
| Other consumer loans | 21,194 | 6.8 | % | 21,210 | 7.0 | % | (16) | (0.1 | %) | ||||||||||||||||||||||||||
| Total | $ | 313,287 | 100.0 | % | $ | 304,144 | 100.0 | % | $ | 9,143 | 3.0 | % | |||||||||||||||||||||||
As of December 31, 2024, our total loans increased by $9.1 million or 3.0%, compared to December 31, 2023. The increase was primarily due to originations of commercial loans to our political clients, but was partially offset by a decrease in commercial real estate balances.
79
Residential real estate loans, closed-end. Single family (1-4 units) residential mortgage loans are primarily secured by owner-occupied primary and secondary residences and are “closed-end” mortgage loans, which means that the loan amount is fixed at the outset and repaid over a set term without the ability to re-borrow. As of December 31, 2024, our residential real estate loans increased by $372 thousand, or 0.2%, compared to December 31, 2023 reflecting tempered demand by consumers and a lower prepayment level amid elevated interest rates.
Commercial real estate loans. Commercial real estate loans are generally long-term loans secured by a commercial property that is either owner-occupied or investor owned. This category also includes commercial construction loans and multifamily residential property loans. Management has strategically allowed a decline in the commercial real estate portfolio. Rising interest rates have increased the cost of borrowing and remote work trends continue to be a concern. These factors negatively impact the value of commercial properties, making commercial real estate loans less attractive. As of December 31, 2024, our commercial real estate loans decreased by $6.7 million, or 11.1%, compared to December 31, 2023.
As of December 31, 2024, our commercial real estate portfolio included owner-occupied and non-owner-occupied commercial real estate loans and were concentrated in certain sectors and in the Washington, D.C. metropolitan area:
•Owner-Occupied vs. Non-Owner-Occupied Properties: Our commercial real estate loans include both owner-occupied and non-owner-occupied properties. As of December 31, 2024 and 2023, we had $18.7 million and $16.2 million, respectively, in owner-occupied loans and $34.8 million and $35.5 million, respectively, in non-owner-occupied loans. Non-owner-occupied properties depend on rental income for repayment. Factors such as market conditions, tenant defaults, and vacancies could reduce cash flow from these properties, leading to increased delinquencies and potential losses.
•Sector Concentration: Our commercial real estate loan portfolio is concentrated in the office, retail, multifamily, and hotels sectors. As of December 31, 2024, our non-owner-occupied office loans totaled $6.4 million, retail loans totaled $12.8 million, multifamily loans totaled $7.4 million, and hotel loans totaled $4.0 million.
•Geographic Concentration: Our commercial real estate loan portfolio is concentrated in the Washington, D.C. metropolitan area. This exposes us to risks tied to local economic conditions, property market trends, and regulatory changes. See “Risk Factors — Other Risks Related to Our Business — The geographic concentration of our business in the Washington, D.C. metropolitan area makes our business highly susceptible to local economic conditions and reductions or changes in government spending,” in this Annual Report on Form 10-K.
Commercial. Commercial loans are commercial and industrial (C&I) term loans or lines of credit and, due to the participation of political organizations in this segment, exhibit cyclicality when measured as a percentage of our loan portfolio. C&I loans include unsecured or UCC secured lending, accounts receivable, inventory or equipment financing loans or working capital loans. As of December 31, 2024, our commercial loans increased by $15.4 million, or 124.2%, compared to December 31, 2023.
Other consumer loans. Other consumer loans include residential construction loans, revolving loans secured by residential properties, commonly known as home equity lines of credit (“HELOCs”), and loans made directly to individuals for non-business purposes which may be secured or unsecured. As of December 31, 2024, other consumer loans decreased by $16 thousand, or 0.1%, from December 31, 2023. The following table presents the components of other consumer loans:
| As of December 31, |
|||||||||||
(dollars in thousands)
|
2024 | 2023 | |||||||||
| Residential construction loans | $ | 1,806 | $ | 3,445 | |||||||
| HELOCs | 16,373 | 14,664 | |||||||||
| Consumer secured | 2,428 | 2,527 | |||||||||
| Consumer unsecured | 587 | 574 | |||||||||
| Total consumer loans | $ | 21,194 | $ | 21,210 | |||||||
Loan Maturity and Sensitivity to Interest Rates
The information in the following table is based on the contractual maturities of individual loans, including loans that may be subject to renewal at their contractual maturity. Renewal of these loans is subject to review and credit approval, as well as modification of terms upon maturity. Actual repayments of the loans may differ from the maturities reflected below
80
because consumer borrowers and some commercial borrowers have the right to prepay obligations with or without prepayment penalties. As of December 31, 2024, variable rate loans, which include floating and adjustable rate structures, comprised 70.8% of our loan portfolio. Our variable rate loans primarily consist of adjustable residential real estate loans with initial fixed-rate periods of three, five, seven or ten years, which, depending on the loan program, reprice every one, three, or five years after the initial fixed-rate period. Variable rate loans provide a better match against our deposit liabilities and reduce our interest rate risk.
The following table details maturities and sensitivity to interest rate changes for our loan portfolio as of December 31, 2024, and the contractual maturity and interest-rate profile of our loan portfolio:
| At December 31, 2024 | Remaining Contractual Maturity Held for Investment | ||||||||||||||||||||||||||||
(dollars in thousands)
|
One year or less |
After one year through five years |
After five years and through fifteen years |
After fifteen years |
Total | ||||||||||||||||||||||||
| Fixed rate loans: | |||||||||||||||||||||||||||||
| Commercial real estate | $ | — | $ | 22,854 | $ | 21,206 | $ | — | $ | 44,060 | |||||||||||||||||||
| Commercial | — | 1,311 | — | — | 1,311 | ||||||||||||||||||||||||
| Residential real estate, closed-end | 473 | 743 | 35,140 | 7,421 | 43,777 | ||||||||||||||||||||||||
| Other consumer loans | 251 | 2,045 | — | — | 2,296 | ||||||||||||||||||||||||
| Total fixed rate loans | $ | 724 | $ | 26,953 | $ | 56,346 | $ | 7,421 | $ | 91,444 | |||||||||||||||||||
| Variable rate loans: | |||||||||||||||||||||||||||||
| Commercial real estate | $ | — | $ | 153 | $ | 8,718 | $ | 549 | $ | 9,420 | |||||||||||||||||||
| Commercial | 25,772 | — | 800 | — | 26,572 | ||||||||||||||||||||||||
| Residential real estate, closed-end | — | 2,158 | 2,754 | 162,041 | 166,953 | ||||||||||||||||||||||||
| Other consumer loans | 5,177 | 4,922 | 7,501 | 1,298 | 18,898 | ||||||||||||||||||||||||
| Total variable rate loans | $ | 30,949 | $ | 7,233 | $ | 19,773 | $ | 163,888 | $ | 221,843 | |||||||||||||||||||
| Total loans | $ | 31,673 | $ | 34,186 | $ | 76,119 | $ | 171,309 | $ | 313,287 | |||||||||||||||||||
Credit Policies and Procedures
Management employs a multi-pronged approach to address credit risk, guided by a defined risk appetite. The approach includes underwriting policies, loan risk classification grading, and an internal and external loan review process. In addition, it involves strategic portfolio management to address loan concentration and oversight by our Board. These policies and guidelines are designed with the intention of maintaining the quality of our loan portfolio while aiming to generate a return commensurate with the associated risks. However, it is important to recognize that all risk management strategies have inherent limitations.
The commercial underwriting process involves an evaluation of the borrower’s ability to repay, the quality of the available collateral (if applicable), the financial character of the borrower and the nature of the credit. It also includes an analysis of the borrower’s needs and an industry analysis to understand relevant external factors that might affect the borrower’s financial stability and repayment capacity. Commercial borrowers are often asked to maintain their primary banking relationship with the Bank to attract both loans and transaction deposits. Residential mortgage loans and consumer loans are underwritten based on an evaluation of the borrower’s repayment ability, which typically includes a review of documentation to verify income and assets. Consumers are encouraged to maintain deposit accounts with the Bank, and pricing incentives may be offered.
During the underwriting process, loans are assigned a loan risk classification grade. The risk rating scale is intended to provide a framework for analyzing risk across various credit exposures, regardless of their nature, type or location.
The internal loan review process, performed by our credit administration staff, aims to verify that basic requirements for loan origination have been met. Ongoing internal loan review processes monitor commercial borrower performance using a risk-based approach, which may result in grade confirmations or change recommendations. Certain scenarios such as delinquent payments, overdue taxes, overdrafts, lack of borrower cooperation, delayed financial statements, or significant changes to the borrower’s financial position may be considered potential indicators of problem loans. In such cases, the loan risk classification may be re-evaluated.
81
An external loan review is conducted annually by a third-party firm. This review examines a sample of the loan portfolio, focusing on areas such as underwriting practices, adherence to loan policies and banking regulations, loan documentation, watch list, and portfolio concentration.
Credit concentration policies are designed to address risk relative to our regulatory capital. Concentration limits are established for various categories including loans to individual borrowers or industries, specific loan types, collateral types, commercial real estate concentrations, and total real estate loans, among others.
We have exposures to certain categories of loans that we believe represent relatively higher credit risk, such as commercial real estate loans. To manage our exposures to these loans, our policy is to require low loan-to-value ratios and high debt service coverage ratios, and to conduct borrower credit assessments. To manage our exposure to commercial real estate, we have set specific concentration limits for commercial real estate loans by property type, and our policy is to monitor these limits quarterly. Our risk management practices include annual internal reviews of commercial mortgages with balances over $500 thousand, focusing on early warning signs like payment delinquencies, property performance, and borrower financial condition. We also engage a third party to conduct an external loan review audit of the entire loan portfolio annually. Additionally, we perform quarterly stress tests on our loan portfolio, including the commercial real estate segment, to assess the potential impact of adverse economic conditions. In response to the inherent risks in higher-risk segments like commercial real estate, we may increase our loan loss reserves to mitigate potential losses due to changing market conditions.
Asset Quality
We seek to maintain a prudent lending approach, which has historically been associated with our asset quality performance. Our loan underwriters employ underwriting guidelines, and we assign a loan risk classification grade at origination. These practices are designed to help us evaluate potential risks throughout the life of the loan. The Bank’s risk classification system utilizes a 10-grade risk-rating scale. The four lowest grade categories (7-10) correspond to the regulatory categories special mention, substandard, doubtful and loss.
The risk classification grade is a key component of our risk management process. Certain grades may result in a loan being added to the watch list report, which is a tool used in monitoring loans or commitments that may present elevated risks. This report is overseen by our Chief Credit Officer and presented to the Board monthly. Loan officers are responsible for managing credit risk within their loan portfolios and are encouraged to be proactive in considering whether to add a loan to the watch list report.
Management uses internal and external review processes, as described under “— Credit Policies and Procedures,” to monitor adherence to loan and credit policies, evaluate the loan portfolio, and identify areas that may require additional attention.
Non-performing Assets
An asset is classified as non-performing when it ceases to yield interest or principal repayments for a specified period, usually 90 days or more. This classification includes loans that are 90 days or more past due on scheduled payments, or assets where full repayment of principal and interest is in doubt due to the borrower’s financial difficulties. Additionally, assets that have been restructured due to the borrower’s financial difficulties may also be classified as non-performing if the restructuring does not restore the asset to a performing status.
A loan is considered non-performing when the borrower is 90 days or more past due on the scheduled payment of principal and interest, or if the loan’s terms have been restricted due to the borrower’s financial difficulties. Additionally, a loan may be classified as non-performing even if it is less than 90 days past due if there is a reasonable doubt about the collectability of the loan’s principal or interest.
Loans are generally considered delinquent when the required principal and interest payments have not been received by the assigned due date. Loans are typically placed on non-accrual status when a loan becomes 90 days delinquent, unless the credit is well-secured and in the process of collection. Management may, at its discretion, place loans on non-accrual status prior to 90 days delinquency if it determines that interest may be uncollectible. Loans determined to be non-performing or potentially uncollectible may be placed in non-accrual status pending further collection efforts or charged off if collection of principal or interest is deemed doubtful.
82
For loans placed in non-accrual status, all interest previously accrued but not collected is generally reversed against interest income. The interest on loans in non-accrual status is typically accounted for on the cash basis or cost recovery method until qualifying for return to accrual. Loans may be returned to accrual status when all the principal and interest amounts contractually due are brought current and future payments are reasonably assured.
As of December 31, 2024 and 2023, based on our internal classifications, we did not identify any assets that met our criteria for classification as non-performing assets or OREO.
Allowance for Credit Losses — Loans
The ACL represents an amount that is intended to absorb the lifetime expected credit losses that may be sustained on outstanding loans at the balance sheet date. Additional information regarding the ACL evaluation can be found in Note 1 and Note 4 to our audited consolidated financial statements and the notes thereto included elsewhere in this Form 10-K.
The estimate for expected credit losses is based on an evaluation of the various factors, including, but not limited to, size and current risk characteristics of the loan portfolio, past events, current conditions, reasonable and supportable forecasts of future economic conditions, and prepayment experience as related to credit contractual term information. The ACL is generally measured on a collective (pool) basis when similar risk characteristics exist and is typically recorded upon the initial recognition of a financial asset.
The ACL may be adjusted by charge-offs, net of recoveries of previous losses, and may be increased or decreased by a provision for or recapture of credit losses, which is recorded in the consolidated statements of income. Management estimates the allowance balance using various information sources, both internal and external, relating to past events, current conditions, and reasonable and supportable forecasts. Historical credit loss experience typically provides a basis for the estimation of expected credit losses. Adjustments to historical loss information may be made for differences in current loan-specific risk characteristics and changes in environmental conditions. Expected credit losses are typically estimated over the contractual term of the loans, adjusted for expected prepayments when appropriate. The contractual term generally excludes expected extensions, renewals, and modifications.
For loans that do not share risk characteristics with a pool of other loans, expected credit losses are measured on an individual loan basis. Management individually evaluates the expected credit loss for certain loans, such as those that are collateral-dependent, are graded doubtful, or are identified as having risk characteristics dissimilar to those of the established loan pools.
For loans considered collateral-dependent, the Company has adopted a practical expedient to the ACL, which allows for recording an ACL based on the fair value of the collateral rather than by estimating expected losses over the life of the loan.
While the ACL on loans follows these guidelines, and management believes the allowance is appropriate based on current information, the judgmental nature of the calculation could lead to fluctuations due to ongoing evaluations of the loan portfolio. These evaluations may be influenced by economic conditions in the Washington, D.C. metropolitan area, changes in asset quality, or loan portfolio growth, among other factors, which could potentially require additional provisions for the allowance for credit losses.
The quality of the loan portfolio and the adequacy of the allowance are subject to review by our internal and external auditors as well as our regulators.
83
The following table presents an analysis of the allowance for credit losses:
| As of and for the Year Ended December 31, |
||||||||
(dollars in thousands)
|
2024 | 2023 | ||||||
| Average loans outstanding | $ | 305,364 | $ | 314,444 | ||||
| Total loans outstanding at end of each period | 313,287 | 304,144 | ||||||
| Allowance for credit losses at the beginning of period | 4,319 | 4,482 | ||||||
| Provision for (recapture of) credit losses | 195 | (163) | ||||||
| Charge-offs | — | — | ||||||
| Recoveries | — | — | ||||||
| Allowance for credit losses at end of period | 4,514 | 4,319 | ||||||
| Ratio of allowance to total loans outstanding at period end | 1.44 | % | 1.42 | % | ||||
| Ratio of nonaccrual loans to total loans outstanding at period end | — | — | ||||||
| Ratio of allowance to nonaccrual loans at period end | — | — | ||||||
The following table presents the allocation of the allowance for credit losses:
| As of December 31, | As of December 31, | |||||||||||||
| 2024 | 2023 | |||||||||||||
|
(dollars in thousands)
|
Amount | % of total loans |
Amount | % of total loans |
||||||||||
| Commercial real estate | $ | 1,140 | 0.36 | % | $ | 1,233 | 0.41 | % | ||||||
| Commercial | 483 | 0.15 | % | 189 | 0.06 | % | ||||||||
| Residential real estate | 2,644 | 0.84 | % | 2,668 | 0.88 | % | ||||||||
| Other consumer loans | 247 | 0.08 | % | 229 | 0.08 | % | ||||||||
| Total | $ | 4,514 | 1.44 | % | $ | 4,319 | 1.42 | % | ||||||
The allocations of the allowance between loan segments did not vary significantly during the periods presented. However, we note a modest migration of applied allowances from the commercial real estate segment as of December 31, 2023 to the commercial segment as of December 31, 2024 caused by growth in the commercial non-real estate segment contrasted to an overall balance decline in the commercial real estate segment.
There were no loan charge-offs for the years ended December 31, 2024 or 2023. As a result, the ratio of loan charge-offs to average loans outstanding is 0.00% for all reported periods.
Deposits
We provide a wide range of commercial and personal deposit services. The deposit products we offer include noninterest-bearing and interest-bearing checking accounts, savings accounts, and money market accounts. We aim to attract transaction account deposits, particularly from commercial clients. Our deposit base is largely composed of funds from commercial entities, specifically federal political organizations, trade associations, non-profit organizations and business enterprises. Deposits from political organizations generally exhibit more seasonality than typical commercial or consumer deposits as federal election cycles often influence deposit levels of political organizations.
We are a member of the IntraFi® Cash Services network, which allows our deposit clients to enroll in the ICS® program. This program is designed to provide our clients with access to FDIC insurance beyond the standard maximum deposit insurance amount at a single insured depository institution. For accounts enrolled in this service, we select whether each account should be in a reciprocal position or a one-way sell position. A reciprocal position means that we receive an equal amount of network deposits for our enrolled accounts, and those deposits are reflected on our balance sheet. If we elect to receive reciprocal deposits, we are required to pay a fee to IntraFi® equal to our reciprocal deposits balances
84
multiplied by an annualized rate of 0.125% as of December 31, 2024. Conversely, we do not receive reciprocal network funding when accounts are positioned as One-Way Sell®, and therefore the deposits are not reported on the balance sheet. For deposits placed at other participating banks as One-Way Sell® deposits, we receive deposit placement services income, which is inversely related to the interest rate on the deposit account, meaning that we receive less deposit placement services income for placing deposits with a higher interest rate. At December 31, 2024, our One-Way Sell® deposits were comprised of higher cost accounts as compared to the average composition of One-Way Sell® deposits that we experienced throughout 2024.
During periods of increased political organization deposits, which typically occur in connection with election cycles, we may adjust the positioning of certain accounts enrolled in the ICS® program. These adjustments can include changing some accounts from a reciprocal position to a One-Way Sell® position, which affects whether and how these deposits are reflected on our balance sheet. These adjustments are part of our overall asset and liability management strategy, which aims to maintain appropriate balance sheet metrics in accordance with regulatory guidelines and our risk management policies. As of December 31, 2024, our balance sheet reflected $130.3 million of reciprocal ICS® deposits. Excess deposits totaling $63.3 million as of December 31, 2024 were placed at other participating banks as One-Way Sell® deposits. Our deposit placement services income was $6.2 million for the year ended December 31, 2024. If we were to convert some or all of the One-Way Sell® deposits into reciprocal deposits, bringing them back onto our balance sheet, we would expect to receive interest income by investing these deposits, but our deposit placement services income would decline and our interest on deposits, FDIC and regulatory assessments and the fee we pay to IntraFi® would increase.
Our participation in the ICS® network is subject to certain terms and conditions, and there can be no assurances that we will be able to participate in the ICS® network in the future. As of December 31, 2024, the terms and conditions for participation in the ICS® network include a $265.0 million limit on the amount of each participating client’s ICS® deposits that may be placed at other banks within the ICS® network, a $3.5 billion and $6.5 billion limit on the maximum amount of savings account deposits and demand account deposits, respectively, that a bank may place at other banks as reciprocal deposits, and a $10.0 billion limit on the maximum amount of deposits that a bank may place at other banks as One-Way Sell® deposits. The terms and conditions also include limitations on a bank’s ability to receive reciprocal deposits, place One-Way Sell® deposits, or receive One-Way Buy® deposits if the bank is not “well capitalized” under the applicable federal banking regulations.
The fees associated with our participation in the ICS® network require careful management. The IntraFi Placement Fee represents an additional cost that is not incurred with traditional deposit accounts. As such, this fee is factored into our overall asset and liability management strategy with the aim of ensuring that our participation in the ICS® network remains financially advantageous. These fees, together with our interest expense on deposits and other operational costs, contribute to the overall cost structure associated with our deposit services.
Throughout 2024, the Bank experienced fluctuations in deposit levels influenced by the federal election cycle. In the months leading up to the November 2024 federal elections, deposits from political organizations increased, consistent with historical patterns. As expected, deposit levels declined around the election as funds were disbursed for campaign-related activities. Following the election, certain political organization clients engaged in new fundraising and account openings associated with post-election activities, resulting in some deposit inflows. However, these post-election deposits were distinct from those tied directly to the election itself, and the timing and volume of such inflows varied.
At year-end, deposit balances included funds related to post-election activities and events. Historically, these deposits have been temporary. The precise amount and timing of any such outflows remain uncertain and may not follow historical patterns, as they depend on a range of external factors, including the fundraising and disbursement activities of our political organization clients.
85
The following table presents the types of deposits compared to total deposits for the periods indicated:
| As of December 31, | |||||||||||||||||||||||||||||||||||
| 2024 | 2023 | Change | |||||||||||||||||||||||||||||||||
(dollars in thousands)
|
Amount | % of total deposits |
Amount | % of total deposits |
$ | % | |||||||||||||||||||||||||||||
Noninterest-bearing |
$ | 913,379 | 73.1 | % | $ | 766,933 | 69.0 | % | $ | 146,446 | 19.1 | % | |||||||||||||||||||||||
| Savings, interest-bearing and money market accounts | 324,845 | 26.0 | % | 328,350 | 29.5 | % | (3,505) | (1.1 | %) | ||||||||||||||||||||||||||
| Time, $250 and over | 6,510 | 0.5 | % | 9,385 | 0.8 | % | (2,875) | (30.6 | %) | ||||||||||||||||||||||||||
| Other time | 5,201 | 0.4 | % | 7,357 | 0.7 | % | (2,156) | (29.3 | %) | ||||||||||||||||||||||||||
| Total | $ | 1,249,935 | 100.0 | % | $ | 1,112,025 | 100.0 | % | $ | 137,910 | 12.4 | % | |||||||||||||||||||||||
The following table presents the average balances and average rates paid for the periods indicated:
| Year Ended December 31, | |||||||||||||||||||||||
| 2024 | 2023 | ||||||||||||||||||||||
(dollars in thousands)
|
Average Balance |
Average Rate |
Average Balance |
Average Rate |
|||||||||||||||||||
| Noninterest-bearing | $ | 930,978 | — | % | $ | 645,418 | — | % | |||||||||||||||
| Savings, interest-bearing checking and money market accounts | 233,217 | 1.24 | % | 284,706 | 1.11 | % | |||||||||||||||||
| Time, $250 and over | 7,563 | 2.93 | % | 8,262 | 2.73 | % | |||||||||||||||||
| Other time | 5,778 | 2.84 | % | 9,775 | 2.98 | % | |||||||||||||||||
| Total average deposits | $ | 1,177,536 | 0.28 | % | $ | 948,161 | 0.39 | % | |||||||||||||||
FDIC deposit insurance covers $250 thousand per depositor, per FDIC-insured bank, for each account ownership category. We estimate total uninsured deposits were $857.8 million and $648.0 million as of December 31, 2024 and December 31, 2023, respectively, representing approximately 68.6% and 58.3% of our deposit portfolio as of December 31, 2024 and December 31, 2023, respectively.
The maturity profiles of our uninsured time deposits, those deposits that exceed the FDIC insurance limit, as of December 31, 2024 are as follows:
(dollars in thousands)
|
Three Months or Less |
More than Three Months to Twelve Months |
More than Twelve Months to Three Years |
More than Three years |
Total | ||||||||||||||||||||||||
| Time deposits, uninsured | $ | 1,711 | $ | 3,669 | $ | 1,130 | $ | — | $ | 6,510 | |||||||||||||||||||
Borrowings
The Bank has several supplementary funding sources, including a secured line of credit with the FHLB and various available secured and unsecured lines of credit with correspondent banks.
Federal Home Loan Bank Advance. The Bank maintains eligibility for a secured line of credit with the Federal Home Loan Bank (“FHLB”). To establish credit availability, the Bank will typically pledge eligible 1-4 family residential real estate loans from its loan portfolio as collateral. As of December 31, 2024 and 2023, the Bank had not pledged any collateral to the FHLB. Consequently, no credit availability was established, and no outstanding borrowings were recorded.
Short-Term Borrowings. As of December 31, 2024, the Company had no outstanding short-term borrowings. The Company fully repaid its previously outstanding balance on an unsecured line of credit from a correspondent bank. The line of credit, which had a total commitment of $10.0 million and an outstanding balance of $5.0 million as of December
86
31, 2023, was fully repaid on October 10, 2024, using a portion of the net proceeds from the IPO. The Company formally closed the line of credit on October 11, 2024. The interest rate on the line of credit was 7.95% at December 31, 2023.
The Bank maintains access to unsecured federal funds purchase lines of credit with:
•Pacific Coast Bankers’ Bank: $50.0 million, maturing June 30, 2025
•First National Bankers’ Bank: $10.0 million, maturing June 30, 2025
•Community Bankers’ Bank: $8.0 million, matured March 12, 2025, and subsequently renewed for a one year period to March 12, 2026
These federal funds lines renew annually, and balances may remain outstanding for periods ranging from 10 to 90 consecutive days. The use of these credit facilities is contingent upon compliance with specified financial conditions and covenants.
As of December 31, 2024 and December 31, 2023, the Bank had no outstanding balances under these federal funds purchase lines.
Off-Balance Sheet Arrangements
We are party to credit-related financial instruments with off-balance sheet risk in the normal course of business to meet the financing needs of our clients. These financial instruments include commitments to extend credit and standby letters of credit. Such commitments involve, in varying degrees, elements of credit and interest rate risk in excess of the amount recognized in the consolidated balance sheets.
Our exposure to credit loss is represented by the contractual amount of these commitments. We follow the same credit policies in making commitments as we do for on-balance sheet instruments.
The contractual amounts of financial instruments with off-balance sheet commitments are as follows:
| As of December 31, | ||||||||
| (dollars in thousands) | 2024 | 2023 | ||||||
| Commitments to grant loans | $ | 408 | $ | — | ||||
Credit card lines |
762 | 448 | ||||||
| Unfunded commitments under lines of credit | 22,230 | 22,499 | ||||||
| Standby letters of credit | 4,491 | 3,598 | ||||||
Commitments to grant loans increased from December 31, 2023 to December 31, 2024, due to one loan which was in the process of origination at December 31, 2024. Credit card lines increased by $314 thousand, or 70.1% during the year, due to growth in the business credit card program. Unfunded commitments under lines of credit decreased $717 thousand, or 3.1% from December 31, 2023 to December 31, 2024, staying relatively consistent. Standby letters of credit increased $893 thousand, or 24.8%, due to increases in the average letter of credit commitment.
For information regarding the arrangement related to the ICS® network and related One-Way Sell® deposits, see “— Deposits” above.
Liquidity and Capital Management
Liquidity Management
Liquidity refers to our capacity to meet cash and collateral obligations in a timely manner. Maintaining appropriate levels of liquidity depends on our ability to address both expected and unexpected cash flows and collateral needs while aiming to avoid adverse effects on our daily operations or the financial condition of the Bank. Effective liquidity management is considered essential to our business model, as deposits, which can generally be withdrawn on demand, form a primary source of our funding. We employ various strategies intended to manage liquidity. Our account at the Federal Reserve, which held approximately $406.7 million as of December 31, 2024, serves as a primary source of liquidity for daily and ongoing activities. We also maintain additional supplemental sources of liquidity, as discussed below. For regulatory reporting purposes, the liquidity ratio is typically calculated as the sum of our cash and cash equivalents plus unpledged securities classified as investment grade divided by total liabilities. Based on this calculation
87
method, as of December 31, 2024 and 2023, our reported liquidity ratios were 85.13% and 78.75%, respectively. As of December 31, 2024, we had $63.3 million in One-Way Sell® deposit accounts through the ICS® platform that could be converted to a reciprocal position in order to provide additional near-term liquidity. It is important to note that these ratios and amounts are point-in-time measurements and may not be indicative of future liquidity positions.
Historically, deposits from political organizations increase in the periods leading up to federal elections followed by a decline around the elections. Election outcomes may also impact the timing and scale of deposit inflows or outflows from political organizations, and this cycle was no exception. The results of the November 2024 election created opportunities for new post-election accounts and fundraising activities by certain of our political organization clients, which have led to some deposit inflows. However, the precise pace and scale of future deposit inflows and outflows remain uncertain and may deviate from historical patterns. External factors, including our political organization clients’ fundraising and disbursement activities, contribute to this uncertainty. Management seeks to address liquidity needs related to seasonal outflows by identifying political organization accounts, tracking activity, communicating with clients and retaining high cash balances at the Federal Reserve to fund deposit outflows.
In addition to traditional sources of liquidity, such as reciprocal deposits and lines of credit, we also utilize the ICS® network for both One-Way Buy® deposits and One-Way Sell® deposits, each serving distinct roles in our liquidity management strategy. One-Way Sell® deposits and reciprocal deposits involve placing deposits from our own clients with other participating banks through the ICS® network. One-Way Sell® deposits help us manage excess deposits by moving them off our balance sheet, while reciprocal deposits allow us to exchange deposit balances with other banks, ensuring those deposits remain insured. Both strategies help us to optimize our liquidity position while earning deposit placement fees, which contribute to our noninterest income. Conversely, One-Way Buy® deposits involve receiving deposits from other banks’ customers through the ICS® network. This mechanism can provide an additional source of liquidity by allowing us to increase our deposits without reciprocating. These transactions involve certain expenses, which include interest on the deposits and any associated fees, which we consider within our broader liquidity planning.
Management estimates that up to 68.6% of deposits were uninsured as of December 31, 2024. To obtain FDIC insurance for deposits exceeding the $250 thousand threshold, some clients enroll in the ICS®, which is described in greater detail under “— Deposits” above. As of December 31, 2024, deposit balances totaling $193.6 million were enrolled in the ICS® program. $63.3 million of these deposits were positioned as One-Way Sell® deposits and are therefore not reflected on the balance sheet. The Bank has the flexibility to convert these One-Way Sell® deposits into reciprocal deposits, which would then appear on the balance sheet. The balance of reciprocal deposits was $130.3 million as of December 31, 2024. To fund the outflow of deposits during phases of the federal election cycle when campaigns and committees are actively spending, management will rely on the Bank’s cash balances at the Federal Reserve and conversion of One-Way Sell® accounts to reciprocal as its primary sources of liquidity. Similar to other deposits, depositors may withdraw their One-Way Sell® deposits at any time, which could impact the volume of One-Way Sell® deposits available for conversion to reciprocal.
In addition to the primary sources of liquidity discussed above, we maintain secured lines of credit with the FHLB and the Federal Reserve Discount Window, for which we can borrow up to the allowable amount of pledged collateral. The Bank can advance FHLB funds of up to 25% of assets as reported in its latest Federal Financial Institutions Examination Council (“FFIEC”) Consolidated Reports of Condition and Income, which the Bank files with the FFIEC on a quarterly basis (“Call Report”), using pledged collateral such as qualifying mortgages and investment securities. Based on the December 31, 2024 Call Report, 25% of total assets equates to credit availability of $350.3 million. As of December 31, 2024, we had no collateral pledged or outstanding balance with the FHLB or Federal Reserve.
The Bank has access to additional unsecured funding through its account with ICS®. The Bank can request funding of up to 10% of total assets, which equates to $140.1 million as of the Bank’s December 31, 2024 Call Report, in a One-Way Buy® of daily maturing or term deposit products. Requesting One-Way Buy® deposits requires us to submit a bid including the rate we are willing to pay for the deposits, and such request may be fulfilled in whole, in part, or not at all. If demand for One-Way Buy® deposits is high, then the rate required to successfully bid for One-Way Buy® deposits would be expected to increase, and so One-Way Buy® deposits may be a less reliable source of liquidity. As of December 31, 2024, there was no outstanding balance.
The Bank maintains unsecured lines of credit with three correspondent banks that provide combined availability of $68.0 million. There were no outstanding balances as of December 31, 2024.
88
As an intermediate source of liquidity, we may sell AFS securities or allow AFS and HTM securities to mature without reinvestment in the securities portfolio. As of December 31, 2024, our AFS securities portfolio had a fair value of $358.3 million and our total AFS and HTM debt securities portfolio had an amortized cost of $666.0 million, including $281.0 million of bonds maturing within a year and $266.7 million of bonds maturing between one and five years. Our bond portfolio is structured to provide liquidity when management anticipates it will be needed, and a portion of our AFS bonds are invested in liquid investments like U.S. Treasury securities. In the event liquidity is needed from the bond portfolio, management will take into consideration a number of factors when determining which investments to sell. Variables include the marketability of the bonds, current prices and estimated losses, and other factors.
Liquidity Risk Management
Liquidity risk refers to the potential that the Bank’s financial condition or overall safety and soundness could be adversely affected by a real or perceived inability to meet contractual obligations. This risk category includes potential challenges in managing unplanned decreases or changes in funding sources. Liquidity risk management involves efforts to identify, measure, monitor and control liquidity events.
The ALCO typically reviews current and projected liquidity scenarios, including stressed scenarios, at its quarterly meetings. The ALCO seeks to ensure that measurement systems are designed to identify and quantify the Bank’s liquidity exposure, and that reporting systems and practices are intended to communicate relevant information about the level and sources of that exposure. Management is responsible for implementing board-approved policies, strategies, and procedures, and for monitoring liquidity on both a daily and long-term basis.
Capital Resources
Capital adequacy is generally considered an important indicator of financial stability and performance. Our objectives include maintaining capitalization at levels that we believe are sufficient to support asset growth and to promote confidence among our depositors, investors, and regulators. We recognize that robust capital management practices are integral to addressing various financial and operational challenges, which may include managing credit risk, liquidity risk, balance sheet growth, new products, regulatory changes and competitive pressures.
Stockholders’ equity as of December 31, 2024 was $144.2 million, an increase of $60.8 million compared to $83.4 million as of December 31, 2023. Proceeds from common stock issued contributed $36.5 million to the increase. Most of the remaining balance of the change was due to net income, which for the year ended December 31, 2024 was $20.9 million, increasing retained earnings.
Book value per share as of and December 31, 2024 and 2023 was $21.98 and $18.26, respectively. The increase between periods is primarily the result of the common stock issuance as well as earnings, which were $4.17 per share during the year ended December 31, 2024. The remaining increase is due to the improvement in the market value of the AFS securities portfolio which caused the accumulated other comprehensive loss to decline.
Because total assets on a consolidated basis are less than $3.0 billion, we are not subject to the consolidated capital requirements imposed by federal regulations. However, the Bank is subject to various regulatory capital requirements administered by the federal banking agencies. Certain regulatory measurements of capital adequacy are “risk based,” meaning they utilize a formula that considers the individual risk profile of the financial institution’s assets. For example, certain assets, such as cash at the Federal Reserve and investments in U.S. Treasury securities, are deemed to carry zero risk by the regulators because of explicit or implied federal government guarantees. As of December 31, 2024 and 2023, respectively, 52.4% and 42.5% of the Bank’s total assets were invested in such zero-risk assets. The tier 1 leverage ratio, another regulatory capital measurement, does not consider the riskiness of assets. The leverage ratio is computed as tier 1 capital divided by total average assets for the quarter.
89
The Bank’s capital level is characterized as “well capitalized” under the Basel III Capital Rules. A summary of the Bank’s regulatory capital ratios, and minimum requirement to be considered “well capitalized” are presented below:
| December 31, | Well- capitalized requirement |
||||||||||||||||||||||||||||||||||
| 2024 | 2023 | ||||||||||||||||||||||||||||||||||
| ($ in thousands) | Amount | Ratio | Amount | Ratio | Ratio | ||||||||||||||||||||||||||||||
| Total risk-based capital | $ | 131,750 | 32.94 | % | $ | 104,523 | 25.44 | % | 10.00 | % | |||||||||||||||||||||||||
| Tier 1 risk-based capital | 127,034 | 31.76 | % | 99,856 | 24.30 | % | 8.00 | % | |||||||||||||||||||||||||||
| Common equity tier one risk-based capital | 127,034 | 31.76 | % | 99,856 | 24.30 | % | 6.50 | % | |||||||||||||||||||||||||||
| Tier 1 leverage | 127,034 | 9.57 | % | 99,856 | 9.21 | % | 5.00 | % | |||||||||||||||||||||||||||
During periods of growth in deposits due to seasonality, our assets could reach a level that would require the Bank to control the level of these deposits or require the Company to obtain additional capital to maintain a Tier 1 leverage ratio that exceeds our internal regulatory capital policies or targets and satisfies regulatory requirements. We use the ICS® network to help manage our Tier 1 leverage ratio by moving certain deposit accounts off our balance sheet by placing the deposits at other banks as One-Way Sell® deposits. As of December 31, 2024, our deposits enrolled in the ICS® program which were in a One-Way Sell® position totaled $63.3 million.
Item 7A. Quantitative and Qualitative Disclosures About Market Risk
Interest Rate Sensitivity and Market Risk
Our business activities include attracting deposits and using those deposits to invest in cash, securities, and loans. These activities involve interest rate risk, which arises from factors such as timing and volume differences in the repricing of our rate-sensitive assets and liabilities, changes in credit spreads, fluctuations in the general level of market interest rates, and shifts in the shape and level of market yield curves. Changes in interest rates affects our current and future earnings by impacting our net interest income and the level of other interest-sensitive income and operating expenses. Interest rate fluctuations also influence the underlying economic value of our assets, liabilities and off-balance sheet items. This is because the present value of future cash flows, and in some cases the cash flows themselves, may change when interest rates vary.
Interest rate risk is generally considered a significant market risk for financial institutions. We have developed an interest rate risk policy that aims to provide management with guidelines for funds management. We have also established a system for monitoring our net interest rate sensitivity position. However, it’s important to note that despite these measures, significant changes in interest rates could potentially impact our earnings, liquidity and capital positions.
We had a total one-year cumulative gap in rate-sensitive assets and rate-sensitive liabilities of $616.5 million and $319.4 million as of December 31, 2024 and 2023, respectively, indicating that, overall, our assets will reprice before our liabilities. Generally, when interest-earning assets mature or reprice more quickly than interest-bearing liabilities, decreasing interest rates could reduce net interest income and increasing interest rates could increase net interest income.
Our ALCO is composed of our CEO and at least two independent directors and meets at least quarterly to manage interest rate risk in accordance with policies approved by the Bank’s board of directors. Members of management from various departments also participate in the ALCO meetings. The board of directors receives monthly interest rate risk measurement results. The ALCO monitors the volume, maturities, pricing and mix of assets and funding sources with the objective of managing assets and funding sources to provide results that are consistent with liquidity, growth, risk limits and profitability goals.
We use interest rate risk models and rate shock simulations to assess the interest rate risk (“IRR”) sensitivity of net interest income and the economic value of equity over a variety of parallel and non-parallel rate scenarios. Many assumptions are used to calculate the impact of interest rate fluctuations on our net interest income, such as asset prepayments, non-maturity deposit price sensitivity and decay rates, and rate drivers. Due to the inherent use of estimates and assumptions in the model, our actual results may, and most likely will, differ from our simulated results. Management reviews the assumptions on an as-needed basis and at least annually through a thorough examination. Key changes are presented to the ALCO.
90
The table below summarizes the results of our IRR analysis in simulating the change in net interest income over a 12-month horizon as of the indicated dates. The “ramped” scenario below presents the anticipated percentage change in net interest income when rates are increased or decreased in a parallel manner evenly over the 12-month time horizon, and the “immediate” scenario assumes that the parallel rate shift occurs immediately.
| Change in interest rates (ramped) | -400 bps | -300 bps | -200 bps | -100 bps | +100 bps | +200 bps | +300 bps | +400 bps | |||||||||||||||||||||||||||||||||||||||
| December 31, 2024 | (18.05 | %) | (13.46 | %) | (8.98 | %) | (4.55 | %) | 4.45 | % | 8.93 | % | 13.37 | % | 17.91 | % | |||||||||||||||||||||||||||||||
| December 31, 2023 | (16.22 | %) | (12.11 | %) | (8.06 | %) | (4.04 | %) | 4.00 | % | 8.02 | % | 12.14 | % | 16.11 | % | |||||||||||||||||||||||||||||||
| Change in interest rates (immediate) | -400 bps | -300 bps | -200 bps | -100 bps | +100 bps | +200 bps | +300 bps | +400 bps | |||||||||||||||||||||||||||||||||||||||
| December 31, 2024 | (48.48 | %) | (36.12 | %) | (23.86 | %) | (11.92 | %) | 11.80 | % | 23.50 | % | 35.42 | % | 47.20 | % | |||||||||||||||||||||||||||||||
| December 31, 2023 | (34.76 | %) | (25.74 | %) | (16.98 | %) | (8.41 | %) | 8.34 | % | 16.54 | % | 24.88 | % | 33.27 | % | |||||||||||||||||||||||||||||||
The results show that we are asset-sensitive, further indicating that we can expect net interest income to increase as rates rise and to decrease as rates decline. See “Risk Factors — Changes in interest rates may adversely affect our earnings and financial condition” in this Annual Report on Form 10-K. Interest rates do not normally move all at once or evenly over time, but this analysis assists in our understanding of the potential direction and magnitude of net interest income changes due to changing interest rates.
The following table illustrates the results of our interest rate risk analysis in simulating the change in fair value of equity as of the indicated dates.
| Change in interest rates | -400 bps | -300 bps | -200 bps | -100 bps | +100 bps | +200 bps | +300 bps | +400 bps | |||||||||||||||||||||||||||||||||||||||
| December 31, 2024 | (5.48 | %) | (3.37 | %) | (1.72 | %) | (1.19 | %) | 0.36 | % | 0.68 | % | 1.32 | % | 2.12 | % | |||||||||||||||||||||||||||||||
| December 31, 2023 | 14.25 | % | 12.33 | % | 8.27 | % | 3.21 | % | (4.81 | %) | (8.85 | %) | (12.35 | %) | (15.45 | %) | |||||||||||||||||||||||||||||||
Due to the nature of our client base, and the resulting balance sheet cyclicality, we will sometimes hold high volumes of immediately repricing assets (i.e., cash) to fund impending political organization deposit outflows. The changes in our balance sheet over the course of a two-year election cycle causes a degree of variability among our interest rate risk results over time.
91
Item 8. Financial Statements
| Page | |||||
Item 8 - Financial Statements |
|||||
Report of Independent Public Accounting Firm (PCAOB No. |
|||||
92
REPORT OF INDEPENDENT REGISTERED PUBLIC ACCOUNTING FIRM
To the Stockholders and the Board of Directors of Chain Bridge Bancorp, Inc.
Opinion on the Financial Statements
We have audited the accompanying consolidated balance sheets of Chain Bridge Bancorp, Inc. and its subsidiary (the Company) as of December 31, 2024 and 2023, the related consolidated statements of income, comprehensive income, stockholders’ equity, and cash flows for each of the years then ended, and the related notes to the consolidated financial statements (collectively, the financial statements). In our opinion, the financial statements present fairly, in all material respects, the financial position of the Company as of December 31, 2024 and 2023, and the results of its operations and its cash flows for the years then ended, in conformity with accounting principles generally accepted in the United States of America.
Basis for Opinion
These financial statements are the responsibility of the Company’s management. Our responsibility is to express an opinion on the Company’s financial statements based on our audits. We are a public accounting firm registered with the Public Company Accounting Oversight Board (United States) (PCAOB) and are required to be independent with respect to the Company in accordance with U.S. federal securities laws and the applicable rules and regulations of the Securities and Exchange Commission and the PCAOB.
We conducted our audits in accordance with the standards of the PCAOB. Those standards require that we plan and perform the audit to obtain reasonable assurance about whether the financial statements are free of material misstatement, whether due to error or fraud. The Company is not required to have, nor were we engaged to perform, an audit of its internal control over financial reporting. As part of our audits we are required to obtain an understanding of internal control over financial reporting but not for the purpose of expressing an opinion on the effectiveness of the Company’s internal control over financial reporting. Accordingly, we express no such opinion.
Our audits included performing procedures to assess the risks of material misstatement of the financial statements, whether due to error or fraud, and performing procedures that respond to those risks. Such procedures included examining, on a test basis, evidence regarding the amounts and disclosures in the financial statements. Our audits also included evaluating the accounting principles used and significant
estimates made by management, as well as evaluating the overall presentation of the financial statements. We believe that our audits provide a reasonable basis for our opinion.
/s/ Yount, Hyde & Barbour, P.C .
We have served as the Company's auditor since 2007.
March 21, 2025
93
|
Chain Bridge Bancorp, Inc. and Subsidiary
Consolidated Balance Sheets
December 31, 2024 and 2023
(Dollars in thousands, except per share data)
| |||||||||||
| 2024 | 2023 | ||||||||||
| Assets | |||||||||||
| Cash and due from banks | $ | $ | |||||||||
| Interest-bearing deposits in other banks | |||||||||||
| Total cash and cash equivalents | |||||||||||
| Securities available for sale, at fair value | |||||||||||
Securities held to maturity, at carrying value, net of allowance for credit losses of $ |
|||||||||||
| Equity securities, at fair value | |||||||||||
| Restricted securities, at cost | |||||||||||
| Loans held for sale | |||||||||||
Loans, net of allowance for credit losses of $ |
|||||||||||
Premises and equipment, net of accumulated depreciation of $ |
|||||||||||
| Accrued interest receivable | |||||||||||
| Other assets | |||||||||||
| Total assets | $ | $ | |||||||||
| Liabilities and stockholders’ equity | |||||||||||
| Liabilities | |||||||||||
| Deposits: | |||||||||||
| Noninterest-bearing | |||||||||||
| Savings, interest-bearing checking and money market accounts | |||||||||||
Time, $250 and over |
|||||||||||
| Other time | |||||||||||
| Total deposits | |||||||||||
| Short-term borrowings | |||||||||||
| Accrued interest payable | |||||||||||
| Accrued expenses and other liabilities | |||||||||||
| Total liabilities | |||||||||||
| Commitments and contingencies | |||||||||||
| Stockholders’ equity | |||||||||||
| Preferred Stock: 1 | |||||||||||
Class A Common Stock: 1
|
|||||||||||
$ |
|||||||||||
Class B Common Stock: 1
|
|||||||||||
$ |
|||||||||||
| Additional paid-in capital | |||||||||||
| Retained earnings | |||||||||||
| Accumulated other comprehensive loss | ( |
( |
|||||||||
| Total stockholders’ equity | |||||||||||
| Total liabilities and stockholders’ equity | $ | $ | |||||||||
|
See Notes to Consolidated Financial Statements.
|
|||||||||||
1 On October 3, 2024, the Company filed an Amended and Restated Certification of Incorporation with the Secretary of State of the State of Delaware, which reclassified and converted each outstanding share of the Company's existing common stock, into 170 shares of Class B Common Stock (the “Reclassification”). The Reclassification also authorized 20,000,000 shares of Class A Common Stock, and 10,000,000 shares of Preferred Stock. Historical share information is presented on an as adjusted basis giving effect to the Reclassification. All shares and balances from previously held common stock are reflected in Class B Common Stock.
94
Chain Bridge Bancorp, Inc. and Subsidiary
Consolidated Statements of Income
For the Years Ended December 31, 2024 and 2023
(Dollars in thousands, except per share data)
| 2024 | 2023 | |||||||||||||
| Interest and dividend income | ||||||||||||||
| Interest and fees on loans | $ | $ | ||||||||||||
| Interest and dividends on securities, taxable | ||||||||||||||
| Interest on securities, tax-exempt | ||||||||||||||
| Interest on interest-bearing deposits in banks | ||||||||||||||
| Total interest and dividend income | ||||||||||||||
| Interest expense | ||||||||||||||
| Interest on deposits | ||||||||||||||
| Interest on short-term borrowings | ||||||||||||||
| Total interest expense | ||||||||||||||
| Net interest income | ||||||||||||||
| Provision for (recapture of) credit losses | ||||||||||||||
| Provision for (recapture of) loan credit losses | ( |
|||||||||||||
| Provision for (recapture of) securities credit losses | ( |
|||||||||||||
| Total provision for (recapture of) credit losses | ( |
|||||||||||||
| Net interest income after provision for (recapture of) credit losses | ||||||||||||||
| Noninterest income | ||||||||||||||
| Deposit placement services | ||||||||||||||
| Service charges on accounts | ||||||||||||||
| Trust and wealth management | ||||||||||||||
| Gain on sale of mortgage loans | ||||||||||||||
| Loss on sale of securities | ( |
( |
||||||||||||
| Other income | ||||||||||||||
| Total noninterest income | ||||||||||||||
| Noninterest expenses | ||||||||||||||
| Salaries and employee benefits | ||||||||||||||
| Professional services | ||||||||||||||
| Data processing and communication expenses | ||||||||||||||
| Occupancy and equipment expenses | ||||||||||||||
| Virginia bank franchise tax | ||||||||||||||
| FDIC and regulatory assessments | ||||||||||||||
| Directors fees | ||||||||||||||
| Insurance expenses | ||||||||||||||
| Marketing and business development costs | ||||||||||||||
| Other operating expenses | ||||||||||||||
| Total noninterest expenses | ||||||||||||||
| Net income before taxes | ||||||||||||||
| Income tax expense | ||||||||||||||
| Net income | $ | $ | ||||||||||||
| Earnings per common share, basic and diluted 2 | $ | $ | ||||||||||||
See Notes to Consolidated Financial Statements.
2 Share information for historical periods gives effect to the Reclassification. All earnings are attributed to Class B shares for the historical periods because no Class A shares were outstanding during the historical periods. The number of basic and diluted shares are the same because there are no potentially dilutive instruments. Except in regard to voting and conversion rights, the rights of Class A Common Stock and Class B Common Stock are identical, and the classes rank equally and share ratably with regard to all other matters. Each share of Class B Common Stock is convertible at any time into one share of Class A Common Stock.
95
Chain Bridge Bancorp, Inc. and Subsidiary
Consolidated Statements of Comprehensive Income
For the Years Ended December 31, 2024 and 2023
(Dollars in thousands)
| 2024 | 2023 | ||||||||||
| Net income | $ | $ | |||||||||
| Other comprehensive income: | |||||||||||
| Unrealized holding gain on securities available for sale | |||||||||||
| Income tax expense related to above unrealized gain item | ( |
( |
|||||||||
| Amortization of unrealized holding loss on securities available for sale, transferred to held to maturity | |||||||||||
| Income tax expense related to above amortization item | ( |
( |
|||||||||
| Reclassification adjustment for losses included in net income | |||||||||||
| Income tax expense related to above reclassification item | ( |
( |
|||||||||
| Other comprehensive income, net of tax | |||||||||||
| Comprehensive income | $ | $ | |||||||||
|
See Notes to Consolidated Financial Statements.
| |||||||||||
96
Chain Bridge Bancorp, Inc. and Subsidiary
Consolidated Statements of Changes in Stockholders’ Equity
For the Years Ended December 31, 2024 and 2023
(Dollars in thousands)
| Common Stock3 |
|||||||||||||||||||||||||||||||||||||||||
| Class A Shares Outstanding | Class B Shares Outstanding | Total Amount | Additional Paid-In Capital |
Retained Earnings |
Accumulated Other Comprehensive Loss |
Total | |||||||||||||||||||||||||||||||||||
| Balance at December 31, 2022 | $ | $ | $ | $ | $ | $ | ( |
$ | |||||||||||||||||||||||||||||||||
| — | — | — | — | ( |
— | ( |
|||||||||||||||||||||||||||||||||||
| Net income | — | — | — | — | — | ||||||||||||||||||||||||||||||||||||
| Other comprehensive income | — | — | — | — | — | ||||||||||||||||||||||||||||||||||||
| Balance at December 31, 2023 | $ | $ | $ | $ | $ | $ | ( |
$ | |||||||||||||||||||||||||||||||||
| Balance at December 31, 2023 | $ | $ | $ | $ | $ | $ | ( |
$ | |||||||||||||||||||||||||||||||||
| Issuance of common stock, net of offering costs | — | — | — | ||||||||||||||||||||||||||||||||||||||
| Conversion of Class B to Class A Common Stock | ( |
— | — | — | — | ||||||||||||||||||||||||||||||||||||
| Net income | — | — | — | — | — | ||||||||||||||||||||||||||||||||||||
| Other comprehensive income | — | — | — | — | — | ||||||||||||||||||||||||||||||||||||
| Balance at December 31, 2024 | $ | $ | $ | $ | $ | $ | ( |
$ | |||||||||||||||||||||||||||||||||
See Notes to Consolidated Financial Statements.
97
Chain Bridge Bancorp, Inc. and Subsidiary
Consolidated Statements of Cash Flows
For the Years Ended December 31, 2024 and 2023
(Dollars in thousands)
| 2024 | 2023 | ||||||||||
| Cash flows from operating activities | |||||||||||
| Net income | $ | $ | |||||||||
| Reconciliation of net income to net cash provided by operating activities: | |||||||||||
| Depreciation and amortization of premises and equipment | |||||||||||
Premium amortization (discount accretion) on investment securities, net |
( |
||||||||||
| Recapture of impairment loss on securities previously recognized in earnings | ( |
( |
|||||||||
Fair value loss (gain) on equity security |
( |
||||||||||
| Provision for (recapture of) loan credit losses | ( |
||||||||||
| Provision for (recapture of) securities credit losses | ( |
||||||||||
| Loss on sale of securities | |||||||||||
| Gain on sale of mortgage loans | ( |
( |
|||||||||
| Origination of loans held for sale | ( |
( |
|||||||||
| Proceeds from sale of loans | |||||||||||
| Deferred income tax benefit | ( |
( |
|||||||||
| Changes in assets and liabilities: | |||||||||||
Net (increase) decrease in accrued interest receivable and other assets |
( |
||||||||||
| Net increase in accrued interest payable, accrued expenses and other liabilities | |||||||||||
| Net cash provided by operating activities | |||||||||||
| Cash flows from investing activities | |||||||||||
| Securities available for sale: | |||||||||||
| Purchases of securities | ( |
( |
|||||||||
| Proceeds from sales, calls, maturities, recoveries, and paydowns | |||||||||||
| Securities held to maturity: | |||||||||||
| Purchases of securities | ( |
||||||||||
| Proceeds from sales, calls, maturities and paydowns | |||||||||||
| Purchase of restricted securities, net | ( |
( |
|||||||||
| Reinvestment of dividends on equity security | ( |
( |
|||||||||
| Net (increase) decrease in loans | ( |
||||||||||
| Purchases of premises and equipment | ( |
( |
|||||||||
| Net cash provided by (used in) by investing activities | ( |
||||||||||
| Cash flows from financing activities | |||||||||||
| Net increase in noninterest-bearing, savings, interest-bearing checking and money market deposits | |||||||||||
| Net increase (decrease) in time deposits | ( |
||||||||||
Repayment of short-term borrowings |
( |
||||||||||
| Net proceeds from stock issuance | |||||||||||
| Net cash provided by financing activities | |||||||||||
| Net increase in cash and cash equivalents | |||||||||||
| Cash and cash equivalents, beginning of period | |||||||||||
| Cash and cash equivalents, end of period | $ | $ | |||||||||
| Supplemental disclosures of cash flow information | |||||||||||
| Cash payments for interest | $ | $ | |||||||||
| Cash payments for taxes | |||||||||||
| Supplemental disclosures of noncash investing activities | |||||||||||
| Fair value adjustment for available for sale securities | $ | $ | |||||||||
See Notes to Consolidated Financial Statements.
98
Chain Bridge Bancorp, Inc. and Subsidiary
Notes to Consolidated Financial Statements
Note 1. Organization and Summary of Significant Accounting Policies
Organization and Nature of Operations
Chain Bridge Bancorp, Inc. (the “Company”) is a Delaware corporation and a publicly traded bank holding company whose Class A common stock is listed on the New York Stock Exchange under the symbol “CBNA”. The Company was incorporated on May 26, 2006, and is subject to supervision and regulation by the Board of Governors of the Federal Reserve System under the Bank Holding Company Act of 1956, as amended. The Company serves as the registered bank holding company for Chain Bridge Bank, National Association (the “Bank”), its wholly-owned subsidiary. The Company does not own or control any other subsidiaries and conducts substantially all of its business through the Bank.
The Bank is a national banking association chartered by the Office of the Comptroller of the Currency (“OCC”) under the National Bank Act. The Bank commenced operations on August 6, 2007, following receipt of its Charter No. 24755 from the OCC. The Bank is a member of the Federal Deposit Insurance Corporation (“FDIC”) under Certificate No. 58595 and is also a Federal Reserve member bank, as required of national banks. In 2020, the Bank opened its Trust & Wealth department following authorization from the OCC to exercise full fiduciary powers in accordance with 12 U.S.C. § 92a.
The Bank uses a branchless operating model that integrates digital banking channels with in-person services at its headquarters in McLean, Virginia. It offers a broad range of commercial and personal banking services, including deposit accounts, multiple types of loan products, trust administration, wealth management, and asset custody. The Bank’s core deposit products include noninterest-bearing and interest-bearing checking accounts, as well as savings accounts. Its lending portfolio currently consists primarily of real-estate secured loans, with a significant portion being loans secured by first liens on single family residential properties in the Washington, D.C. area.
The Bank offers tailored financial solutions to individuals, families, businesses, non-profit organizations, and political organizations nationwide. The term “political organizations” refers to: campaign committees; party committees; separate segregated funds (including trade association political action committees (“PACs”) and corporate PACs); non-connected committees (including independent expenditure-only committees (“Super PACs”), committees maintaining separate accounts for direct contributions and independent expenditures (“Hybrid PACs”), and committees other than authorized campaign committees, or those affiliated with such committees that are maintained or controlled by a candidate or federal officeholder (collectively, “Leadership PACs”)); and other tax-exempt organizations under Section 527 of the Internal Revenue Code. A substantial portion of the Bank’s deposits is derived from these political organizations, and deposit levels fluctuate based on federal election cycles.
The accompanying consolidated financial statements have been prepared in accordance with accounting principles generally accepted in the United States of America (“GAAP”) for annual financial information.
The results of operations for the twelve months ended December 31, 2024 are not necessarily indicative of the results to be expected for any future interim period or any full fiscal year.
Principles of Consolidation
Reclassification
Certain amounts reported in prior years may be reclassified to conform to the current year’s presentation. Prior period common stock and additional paid-in capital were reclassified as described in Note 2, “Capital Structure.” Credit card lines, previously included in unused commitments under lines of credit, is now separately presented in Note 9, “Financial Instruments with Off-Balance Sheet Risk.” Marketing expenses, previously shown as a separate component, were combined into other expenses in the statements of income presented in Note 15, “Condensed Financial Statements of
99
Use of Estimates
To prepare financial statements in conformity with GAAP, management makes estimates and assumptions based on available information. These estimates and assumptions affect the amounts reported in the financial statements and the disclosures provided, and actual results could differ. Material estimates that are particularly susceptible to significant change in the near term relate to the determination of the allowance for credit losses and the fair value of investment securities.
Cash and Cash Equivalents
For purposes of the consolidated statement of cash flows, cash and cash equivalents include cash on hand, deposits with other financial institutions with maturities less than 90 days, and federal funds sold. Generally, federal funds are purchased and sold for one-day periods.
Cash Concentrations and Restrictions
The Bank maintains cash accounts in various correspondent banks. At December 31, 2024 and 2023 the total amount by which these deposits, combined with federal funds sold, exceeded the federally insured limits was $730 thousand and $657 thousand, respectively.
Under Federal Reserve Board Regulation D (12 C.F.R. Part 204), insured depository institutions are generally required to maintain certain minimum average reserve balances. However, on March 15, 2020, the Board of Governors set the reserve requirement ratio to zero percent, effective March 26, 2020, to support lending to households and businesses in response to economic conditions. Accordingly, the Bank was not subject to any reserve requirement at December 31, 2024 or 2023.
Securities
The Bank invests in debt securities issued by entities across various sectors. Under 12 CFR Part 1, banks are only permitted to invest in securities that are considered “investment grade.” A security is deemed “investment grade” when the issuer has an adequate capacity to meet its financial commitments under the security for the projected life of the asset or exposure. An issuer is considered to have an adequate capacity to meet financial commitments if the risk of default by the obligor is low and the full and timely repayment of principal and interest is expected. The Bank maintains policies and procedures designed to promote compliance with these requirements, including pre-purchase and ongoing credit monitoring activities for its investments in debt securities.
To determine whether a prospective or existing obligation meets investment-grade criteria, the Bank reviews the issuer’s financial statements, analyzes the issuer’s ability to repay, and, when available, considers external ratings opinions. The extent of the Bank’s assessment varies by security type and rating status, and the Bank maintains a structured policy detailing both pre-purchase and ongoing assessments. All new municipal, corporate, and non-agency structured bond purchases undergo a targeted analysis by the investment department prior to purchase. Thereafter, corporate bonds, non-agency structured assets, and non-rated municipal bonds are subject to an annual assessment by the investment department to assess the issuer’s ability to satisfy current and future debt obligations. Rated municipal securities undergo regular reviews by external parties. The results of these reviews provide data that enables the Bank to assess an issuer’s credit quality, beyond sole reliance upon third-party ratings and may include data related to the issuer’s financial condition, debt obligations, and additional factors. If an external review identifies a problematic issuer, the investment department performs further diligence. Through these practices, the Bank incorporates third-party credit ratings within broader security reviews while avoiding sole reliance on such ratings.
Debt securities that the Company has the intent and ability to hold to maturity are classified as held to maturity (“HTM”) and recorded at amortized cost. Trading securities are recorded at fair value, with changes in fair value reflected in earnings. Debt securities that are not classified as HTM or trading are classified as available for sale (“AFS”) and carried at fair value, with unrealized gains and losses excluded from earnings and reported in other comprehensive income (loss). Purchase premiums and discounts are recognized in interest income using the interest method over the securities’ terms. Premiums on callable debt securities are amortized to their earliest call date, and discounts on callable debt securities are amortized to maturity. Gains and losses on the sale of debt securities are recorded on the trade date and are determined using the specific identification method.
100
Transfers of debt securities from the AFS classification into HTM occur on the transfer date. The unrealized holding gain or loss on that date is reported in accumulated other comprehensive income (loss) and in the carrying value of the HTM securities. Such amounts are amortized over the remaining contractual lives of the securities. The net impact to income from the amortization and accretion of the unrealized loss recognized at the date of transfer is zero.
Equity securities with readily determinable fair values are carried at fair value, with changes reflected in net income. Equity securities without readily determinable fair values are carried at cost, minus impairment (if any), plus or minus changes resulting from observable price changes in orderly transactions for identical or similar investments. Restricted equity securities are carried at cost and are periodically evaluated for impairment based on the ultimate recovery of par value. The entirety of any impairment on equity securities is recognized in earnings.
The Bank is required to maintain an investment in the capital stock of the Federal Reserve Bank of Richmond, Virginia, as a condition of its membership in the Federal Reserve System. Additionally, as a member of the Federal Home Loan Bank of Atlanta, Georgia, the Bank holds an investment in its capital stock. The Bank also maintains investments in the capital stock of the holding companies of two correspondent banks: CBB Financial Corp., headquartered in Midlothian, Virginia, and Pacific Coast Bankers’ Bancshares, headquartered in Walnut Creek, California. The Bank records its investments in these correspondent bank stocks at cost, consistent with the redemption provisions governing these entities, and classifies them as restricted securities on the consolidated balance sheets.
Allowance for Credit Losses – Held to Maturity Securities
Management measures expected credit losses on HTM debt securities on a collective basis by major security type. on HTM debt securities totaled $1.6
The estimate of expected credit losses considers the Company’s historical credit loss information, is adjusted for current conditions and reasonable and supportable forecasts.
Management classifies the HTM portfolio into the following major security types: U.S. government and federal agencies (which includes U.S. treasury securities and debt securities issued by U.S. government agencies and government-sponsored enterprises (“GSEs”)), mortgage-backed securities, corporate bonds, and state and municipal securities. Debt securities issued by the U.S. Treasury or government agencies, including GSEs such as Fannie Mae and Freddie Mac, are not considered credit-sensitive, as they are explicitly or implicitly guaranteed by the U.S. government, resulting in an expectation of zero credit loss. Accordingly, management’s analysis of credit loss considers only the corporate and municipal segments.
Allowance for Credit Losses – Available for Sale Securities
For AFS debt securities in an unrealized loss position, the Company first assesses whether it intends to sell, or whether it is more likely than not that it will be required to sell, the security before recovery of its amortized cost basis. If either criterion regarding intent or requirement to sell is met, the security’s amortized costs basis is written down to fair value through income. For AFS debt securities that do not meet the aforementioned criteria, the Company evaluates whether the decline in fair value has resulted from credit losses or other factors. In making this assessment, management considers the extent to which fair value is less than amortized cost, any changes to the security’s rating by a rating agency, and adverse conditions specifically related to the security, among other factors. If this assessment indicates that a credit loss exists, the present value of cash flows expected to be collected from the security are compared to the amortized cost basis of the security. If the present value of cash flows expected to be collected is less than the amortized cost basis, a credit loss exists, and an ACL is recorded for the credit loss, limited to the amount by which the fair value is less than the amortized cost basis. Any impairment that has not been recorded through an ACL is recognized in other comprehensive income (loss).
101
Changes in the ACL are recorded as a credit loss provision (or reversal). Losses are charged against the allowance when management believes the uncollectibility of an AFS security is confirmed or when either criterion regarding intent or requirement to sell is met. At December 31, 2024 and 2023, there was no allowance related to the AFS securities portfolio.
Loans Held for Sale
Loans
The Bank grants mortgage, commercial, and consumer loans to clients. The Bank’s loan portfolio is primarily comprised of residential and commercial loans throughout the Washington, D.C. metropolitan area. The ability of the Bank’s loan clients to honor their obligations is dependent upon the real estate market and general economic conditions in this area.
Loans that the Company has the intent and ability to hold for the foreseeable future or until maturity or pay-off generally are reported at their outstanding unpaid principal balances adjusted for the allowance for credit losses and any deferred fees or costs on originated loans. Interest income is accrued on the unpaid principal balance. Loan origination and commitment fees and certain direct costs are deferred and the net amount is amortized as an adjustment to the related loan yield.
The accrual of interest on mortgage and commercial loans is discontinued when the loan becomes 90 days delinquent unless the credit is well-secured and in the process of collection. Management may place loans on non-accrual status prior to becoming 90 days past due if management believes interest is uncollectible. Non-performing or uncollectible loans are placed either on nonaccrual status pending further collection efforts or charged off if collection of principal or interest is considered doubtful.
All interest accrued but not collected for loans that are placed on nonaccrual or charged off is reversed against interest income. Interest income on loans in nonaccrual status is accounted for on the cash basis or cost recovery method until the loan qualifies for return to accrual. Loans are returned to accrual status when all contractually due principal and interest payments are brought current and future payments are reasonably assured.
Risk grading and ongoing credit monitoring of the loan portfolio
During management’s review of the adequacy of the allowance for credit losses, particular risk characteristics associated with segments of the loan portfolio are also considered. These characteristics are detailed below:
•Commercial and industrial loans that are not secured by real estate or other marketable collateral carry risks associated with the continued and successful operation of a business. The repayment of these loans is highly dependent on the profitability and cash flows generated by the business. Additional risks may arise from industry conditions or reliance on key individuals, which could impact the ability for the business to operate profitably or continue operations.
•Commercial real estate mortgages carry risks associated with the occupancy of the property, and the repayment of these loans depends on the net operating income generated from the property. Additional risk exists regarding the value of collateral, particularly in cases of depreciation or imprecise appraisals.
•Residential real estate mortgage loans carry risks associated with the borrower’s income stability, continued creditworthiness, and fluctuations in the value of the collateral.
•Other consumer loans carry risks associated with the borrower’s financial condition, creditworthiness, and the depreciation of collateral (if applicable), which may decline in value more rapidly than other asset types. Additionally, these loans may be unsecured, further increasing credit risk. Compared to real estate loans, consumer loans are more susceptible to immediate adverse impacts from job loss, divorce, illness, or personal bankruptcy.
All loans, regardless of type, are assigned a loan risk classification grade during the underwriting process. The Company categorizes commercial loans into risk categories based on relevant information about each borrower’s ability to service their debt, including: current financial information, historical payment experience, credit documentation, public
102
information and current economic trends, among other factors. Consumer loans receive a risk rating based on the type of loan. This risk classification grade is a key factor in determining whether a loan should be added to the watch list. The primary tool for managing and controlling problem loans is the watch list report, which identifies loans or commitments considered problem loans. The report is maintained by the Chief Credit Officer and reviewed by the Board on a monthly basis. Loan officers are responsible for actively managing credit risk within their loan portfolios and are expected to act proactively in determining whether a loan should be added to the watch list.
The following criteria may trigger the inclusion of a loan (other than consumer and residential mortgage loans) to the watch list report:
•Loans classified as substandard, doubtful or loss by bank examiners, external loan review, the Chief Credit Officer or the Chief Executive Officer, due to adverse financial trends in the borrower’s business.
•Loans placed on nonaccrual status.
•Loans more than 30 days delinquent.
•Loans renewed or extended despite a demonstrated inability to repay principal.
•Loans identified by management as requiring heightened monitoring due to unexpected changes or events that could negatively impact the borrower’s ability to repay.
The following factors are commonly used by loan officers to detect emerging credit risk. The presence of one or more of these conditions may also prompt a reevaluation of the loan’s assigned risk classification:
•Financial Statement Analysis – Significant deterioration in a borrower’s financial statements may indicate increased credit risk.
•Delayed Financial Statements – Failure to provide timely financial statements may signal financial distress.
•Delinquent Principal or Interest – Payment delinquencies are often an early indication of credit problems. The Bank’s policy is to review each loan upon becoming past due.
•Delinquent Real Estate Taxes – Late property tax payments may indicate cash flow difficulties. The Bank monitors real estate tax payments using third-party services and reviews delinquent tax notices as they become available.
•Overdrafts – Frequent overdrafts in a borrower’s deposit account may suggest cash flow problems.
•Lack of Cooperation – A borrower’s unwillingness to cooperate with the Bank may indicate underlying financial issues.
•Other – Additional risk indicators include serious health issues or the death of a key principal, family difficulties, unexpected renewals or unanticipated new borrowing, inventory levels inconsistent with industry norms, unusual borrower behavior, rising trade payables, or lapses in required insurance coverage.
In addition to a loan officer identifying the need to re-evaluate a loan’s current risk classification grade based upon the detection of potential issues with the loan or the borrower, the Bank performs both internal and external loan reviews for a significant portion of the portfolio. The external loan review function independently evaluates the Bank’s underwriting and ongoing portfolio monitoring, which includes the confirmation of the grade or alternatively the recommendation to change the risk classification grade. The Bank’s internal loan review process monitors the performance of commercial borrowers using a risk-based approach and includes the confirmation of the grade or alternatively the recommendation to change the risk classification grade. Characteristics of the Bank’s risk classification grades are as follows:
•Pass – Loans to borrowers with sound financial standing, appropriate collateral, adequate cash flow to service the debt, and a prudent leverage ratio. The borrower has a history of timely payments, and future repayment ability is expected to remain strong. Guarantors, if applicable, provide additional support.
•Special Mention – Loans with potential weaknesses requiring close monitoring. If left unresolved, these weaknesses could lead to deterioration in repayment prospects or collateral values. These loans are not adversely classified and do not yet pose an undue risk to the Bank.
•Substandard – Loans inadequately supported by the borrower’s financial condition or collateral valuation. These loans have a well-defined weakness that could jeopardize repayment. There is a distinct possibility of loss if these deficiencies are not corrected.
103
•Doubtful – Loans with all the weaknesses of a substandard classification, but with a heightened probability that full collection of principal and interest is unlikely.
•Loss – Loans deemed uncollectible and of insufficient value to warrant retention as a bankable asset. These loans are charged off.
Allowance for Credit Losses - Loans
The ACL represents an amount which, in management’s judgment, is adequate to absorb the lifetime expected credit losses that may be sustained on outstanding loans at the balance sheet date. The estimate for expected credit losses is based on an evaluation of the size and current risk characteristics of the loan portfolio, past events, current conditions, reasonable and supportable forecasts of future economic conditions, and prepayment experience as related to credit contractual term information. The ACL is measured and recorded upon the initial recognition of a financial asset. The ACL is reduced by charge-offs, net of recoveries of previous losses, and is increased (or decreased) by a provision for (or recovery of) credit losses, which is recorded in the consolidated statements of income. Management estimates the allowance balance using information, from internal and external sources, relating to past events, current conditions, and reasonable and supportable forecasts. Historical credit loss experience provides the basis for the estimation of expected credit losses. Adjustments to historical loss information are made for differences in current loan-specific risk characteristics such as differences in underwriting standards, portfolio mix, delinquency level, or term, as well as for changes in environmental conditions, such as changes in unemployment rates, property values, or other relevant factors. Expected credit losses are estimated over the contractual term of the loans, adjusted for expected prepayments when appropriate. The contractual term excludes expected extensions, renewals, and modifications.
The ACL is measured on a collective (pool) basis when similar risk characteristics exist. Under the current expected loss (“CECL”) methodology, management uses the weighted average remaining maturity (“WARM”) method to calculate quantitative allowances for all collectively evaluated loan categories. Management generally segments loans based on their federal call codes in order to aggregate loans with similar risk characteristics.
To adjust the Bank’s loss rates over a reasonable and supportable forecast period of one year, management collects and analyzes one or a combination of loss drivers which may include unemployment rates, home price indices, interest rates, gross domestic product, or other macroeconomic indicators as appropriate. Following the reasonable and supportable forecast period, expected losses immediately revert to rates that are based on the historical information baseline, plus or minus qualitative adjustments.
To further adjust the allowance for credit losses for expected losses not already included within the quantitative component of the calculation, the Bank may consider the following qualitative adjustment factors: levels of and trends in delinquencies and individually evaluated loans; level of and trends in charge-off and recovery activity; trends in volume and terms of loans; effect of changes in risk selection and underwriting standards, and other changes in lending policies, procedures and practices; effect of changes in experience, ability and depth of lending management and other staff; national and local economic trends and conditions; industry conditions and other external factors; effects of changes in credit concentrations; and changes in the quality of the Bank’s loan review system and loan grading.
If a loan does not share risk characteristics with a pool of other loans, expected credit losses are then measured on the individual loan basis. When a loan’s expected credit loss is measured individually, it is excluded from any collective assessment. Management will individually evaluate the expected credit loss for any loans that are collateral dependent, are graded doubtful, or are otherwise determined to have risk characteristics that are dissimilar to the established loan pools. The individual evaluation will consider collateral value, an observable market price, or the present value of future cash flows. If the measured value of the loan using one of these methods is less than the carrying value of the loan, a specific reserve is applied to the loan in the amount of the difference.
104
Allowance for Credit Losses - Off-Balance Sheet Credit
Modifications to Borrowers Experiencing Financial Difficulty
In situations where a borrower is experiencing financial difficulty, management grants a concession to the borrower that it would not otherwise consider, and the modification results in a more than insignificant change in contractual cash flows, the related loan is subject to specific disclosure requirements. Management strives to identify borrowers in financial difficulty early and work with them to modify their loans to more affordable terms before their loans reach nonaccrual status. These modified terms may include rate reductions, principal forgiveness, payment forbearance and other actions intended to minimize the economic loss and to avoid foreclosure or repossession of the collateral. The Bank did not extend any modifications to borrowers experiencing financial difficulty that had a more than insignificant change in the contractual cash flows of a loan during the periods ending December 31, 2024 and 2023.
Premises and Equipment
Land is carried at cost. Premises and equipment are stated at cost less accumulated depreciation. Depreciation is computed using the straight-line method over the assets’ estimated useful lives. The estimated useful lives range from to years for furniture, fixtures and equipment, 10 years for improvements, and 40 years for buildings.
Foreclosed Properties
Assets acquired through, or in lieu of, foreclosure are held for sale. Foreclosed assets are initially recorded at fair market value at the date of foreclosure less estimated selling costs, thus establishing a new cost basis. Subsequent to foreclosure, valuations of the assets are periodically performed by management. Adjustments are made to the lower of the carrying amount or fair market value of the assets less selling costs. Revenue and expenses from operations and valuation changes are included in non-interest expense. The Bank had no foreclosed assets during the years ending December 31, 2024 and 2023.
Rate Lock Commitments
The Bank enters into commitments to originate mortgage loans whereby the interest rate on the loan is determined prior to funding (rate lock commitments). Rate lock commitments on mortgage loans that are intended to be sold are considered to be derivatives. The period of time between issuance of a loan commitment and closing and sale of the loan generally ranges from 30 to 120 days. The Bank protects itself from changes in interest rates through the use of best-efforts forward delivery commitments, whereby the Bank commits to sell a loan at the time the borrower commits to an interest rate with the intent that the buyer has assumed interest rate risk on the loan. As a result, the Bank is not exposed to losses and will not realize significant gains related to its rate lock commitments due to changes in interest rates. The correlation between the rate lock commitments and the best-efforts contracts is very high due to their similarity.
Income Taxes
Deferred income tax assets and liabilities are determined using the asset and liability (or balance sheet) method. Under this method, the net deferred tax asset or liability is determined based upon the tax effects of the temporary differences between the book and tax bases of the various balance sheet assets and liabilities and give current recognition to changes in tax rates and laws. Deferred tax assets are recognized for deductible temporary differences, operating loss carryforwards, and tax
105
credit carryforwards. Deferred tax liabilities are recognized for taxable temporary differences. Temporary differences are the differences between the reported amounts of assets and liabilities and their tax bases.
Transfers of Financial Assets
Earnings Per Share
Advertising Costs
Comprehensive Income
Fair Value Measurements
The Company uses fair value measurements to record fair value adjustments to certain assets and liabilities and to determine fair value disclosures. In accordance with the Fair Value Measurements and Disclosures Topic of the Financial Accounting Standards Board’s Accounting Standards Codification, the fair value of a financial instrument is the price that would be received to sell an asset or paid to transfer a liability (an exit price) in the principal or most advantageous market for the asset or liability in an orderly transaction between market participants at the measurement date. Fair value is best determined based upon quoted market prices. However, in many instances, there are not quoted market prices for the Company’s various financial instruments.
106
In cases where quoted market prices are not available, fair values are based on estimates using present value or other valuation techniques. Those techniques are significantly affected by the assumptions used, including the discount rate and estimates of future cash flows. Accordingly, the fair value estimates may not be realized in an immediate settlement of the instrument.
If there has been a significant decrease in volume and level of activity for the asset or liability, a change in valuation technique or the use of multiple valuation techniques may be appropriate. In such instances, determining the price at which willing market participants would transact at the measurement date under current market conditions depends on the facts and circumstances and requires the use of significant judgment. The fair value is a reasonable point within the range that is most representative of fair value under current market conditions.
Loss Contingencies
Certain conditions may exist as of the date the financial statements are issued, which may result in a loss to the Company, but which will only be resolved when one or more future events occur or fail to occur. The Company’s management and its legal counsel assess such contingent liabilities, and such assessment inherently involves an exercise of judgment. In assessing loss contingencies related to legal proceedings that are pending against the Company or unasserted claims that may result in such proceedings, the Company’s legal counsel evaluates the perceived merits of any legal proceedings or unasserted claims as well as the perceived merits of the amount of relief sought or expected to be sought therein.
If the assessment of a contingency indicates that it is probable that a material loss has been incurred and the amount of the liability can be estimated, then the estimated liability would be accrued in the Company’s consolidated financial statements. If the assessment indicates that a potentially material loss contingency is not probable, but is reasonably possible, or is probable but cannot be estimated, then the nature of the contingent liability, together with an estimate of the range of possible loss if determinable and material, would be disclosed.
Management is not aware of any litigation, claims or legal actions during 2024, and does not believe there are now any such matters that will have a material effect on the financial statements.
Revenue Recognition
Accounting Standards Codification Topic 606 (“ASC 606”), “Revenue from Contracts with Customers,” creates a single framework for recognizing revenue from contracts with customers that fall within its scope and revises when it is appropriate to recognize gains or losses from the transfer of nonfinancial assets such as other real estate. The majority of the Company’s revenues come from interest income and other sources, including loans and securities that are outside the scope of ASC 606. The Company’s services that fall within the scope of ASC 606 are presented in non-interest income in the consolidated statements of income and are recognized as revenue when the Company satisfies its obligation to the customer.
ASC 606 is applicable to noninterest revenue streams such as service charges on deposit accounts, other service charges and fees, credit and debit card fees, and trust and wealth management income. The primary noninterest revenue streams within the scope of ASC 606 are discussed below.
Service Charges on Accounts
Service charges on accounts consist primarily of income from three areas. The Company earns income from account analysis, monthly service charges, and from overdraft, nonsufficient funds, and other deposit account related services as well as income from transaction-based services such as wire transfers and debit card fee income.
The Company’s performance obligation for account analysis and monthly service charges is generally satisfied, and the related revenue recognized, over the period in which the service is provided. Payment for account analysis and service charges on deposit accounts is primarily received immediately or in the following month through a direct charge to clients’ accounts. Nonsufficient funds and other deposit account related service charges are transaction-based, and therefore, the Company’s performance obligation is satisfied, and related revenue recognized, at a point in time.
Other account related service charges include transaction-based charges for wire transfers, safety deposit box rentals, lockbox, and other services. Safe deposit box rentals are charged to the client on an annual basis and income is recognized upon receipt of payment. The Company has determined that since rentals and renewals occur fairly consistently over time,
107
revenue is recognized on a basis consistent with the duration of the performance obligation. The Company’s performance obligations for wire transfer and other service charges are largely satisfied, and the related revenue recognized, upon completion of the service. Payment is typically received immediately or in the following month.
Debit card income is primarily comprised of interchange fee income. Interchange fees are earned whenever debit cards issued by the Company are processed through card payment networks. The Company’s performance obligation for interchange fee income is largely satisfied, and related revenue recognized, when the services are rendered or upon completion. Payment is received immediately or in the following month. During the year ending December 31, 2023, credit card income arose from the Bank’s agency agreement with the First National Bank of Omaha. The Bank terminated this agreement as of September 30, 2023. Prior to the termination of this agreement, the Bank referred clients to this credit card provider and, in return, received a percentage of the profits earned on the referred accounts. Income was recorded on a quarterly basis as payments were received.
Trust and Wealth Management Income
Segment Reporting
The Company operates as a single reportable segment. The Company’s chief operating decision-makers, including senior management and the Board of Directors, evaluate financial performance and allocates resources on a consolidated basis. Although the Company offers a variety of financial products and services, including deposit accounts, loans, treasury management, and trust and wealth management services, management considers these activities to be components of a single business unit. Individual financial results of specific product lines or services are not separately reviewed by senior management for the purpose of making operating decisions. Accordingly, the Company has determined that it operates in one reportable segment under applicable accounting guidance.
Recent Accounting Pronouncements
In December 2023, the Financial Accounting Standards Board (“FASB”) issued ASU 2023-09, “Income Taxes (Topic 740): Improvements to Income Tax Disclosures.” The amendments in this ASU require an entity to disclose specific categories in the rate reconciliation and provide additional information for reconciling items that meet a quantitative threshold, which is greater than five percent of the amount computed by multiplying pretax income by the entity’s applicable statutory rate, on an annual basis. Additionally, the amendments in this ASU require an entity to disclose the amount of income taxes paid (net of refunds received) disaggregated by federal, state, and foreign taxes and the amount of income taxes paid (net of refunds received) disaggregated by individual jurisdictions that are equal to or greater than five percent of total income taxes paid (net of refunds received). Lastly, the amendments in this ASU require an entity to disclose income (or loss) from continuing operations before income tax expense (or benefit) disaggregated between domestic and foreign and income tax expense (or benefit) from continuing operations disaggregated by federal, state, and foreign. This ASU is effective for annual periods beginning after December 15, 2024. Early adoption is permitted. The amendments should be applied on a prospective basis; however, retrospective application is permitted. The Company does not expect the adoption of ASU 2023-09 to have a material impact on its consolidated financial statements.
In November 2024, the FASB issued ASU 2024-03, “Income Statement—Reporting Comprehensive Income—Expense Disaggregation Disclosures (Subtopic 220-40): Disaggregation of Income Statement Expenses.” ASU 2024-03 requires public companies to disclose, in the notes to the financial statements, specific information about certain costs and expenses at each interim and annual reporting period. This includes disclosing amounts related to employee compensation, depreciation, and intangible asset amortization. In addition, public companies will need to provide qualitative description of the amounts remaining in relevant expense captions that are not separately disaggregated quantitatively. ASU 2024-03 is effective for public business entities for annual reporting periods beginning after December 15, 2026, and interim reporting periods beginning after December 15, 2027. Implementation of ASU 2024-03 may be applied prospectively or retrospectively. The Company does not expect the adoption of ASU 2024-03 to have a material impact on its consolidated financial statements.
108
Note 2.
On September 13, 2024, the Company filed a Registration Statement on Form S-1 with the U.S. Securities and Exchange Commission (“SEC”) in connection with its initial public offering (“IPO”), as amended on September 30, 2024, and declared effective by the SEC on October 3, 2024 (the “Registration Statement”). On October 7, 2024, the Company issued 1,850,000 shares of Class A common stock, par value of $0.01 (“Class A Common Stock”), at a public offering price of $22.00 per share. On October 7, 2024, the Company completed its IPO and received total net proceeds of $37.1 million, after deducting the underwriters’ discount and reimbursements for the underwriters’ legal and other out of pocket expenditures. The net proceeds less other related expenses, including audit fees, legal fees, listing fees, and other expenses, totaled $33.6 million.
On November 1, 2024, the Company issued an additional 142,897 shares of Class A Common Stock as a result of the underwriters’ exercise of their 30-day option to purchase up to an additional 277,500 shares of its Class A Common Stock. The issuance resulted in net proceeds to the Company of approximately $2.9 million, after deducting underwriting discounts and commissions.
In connection with the IPO, on October 3, 2024, the Company filed an Amended and Restated Certificate of Incorporation with the Secretary of State of the State of Delaware, which established two new classes of common stock, Class A Common Stock and Class B common stock, par value $0.01 1.00 per share (“Old Common Stock”), into 170 shares of Class B Common Stock (the “Reclassification”). The Amended and Restated Certificate of Incorporation with the Secretary of State of the State of Delaware also changed the number of authorized shares of Preferred Stock from 100,000 to 10,000,000 .
As of December 31, 2023, the Company had 26,872 no no 4,568,240 1.00 par value and additional paid-in capital, is now reported as 170 shares of Class B Common Stock at $0.01 par value and additional paid-in capital.
Note 3. Securities & Allowance for Securities Credit Losses
The Company invests in a variety of debt securities, principally obligations of the U.S. government and federal agencies, mortgage-backed securities, state and municipal agencies, and corporations. As of December 31, 2024 and December 31, 2023, all debt securities were classified as held to maturity (“HTM”) or available for sale (“AFS”).
Management considers the appropriateness of the accounting treatment applied to the Company’s debt securities portfolio on an ongoing basis. During a prior year, certain AFS bonds were transferred to the HTM portfolio. Bonds selected for transfer included U.S. government and federal agencies, corporate bonds, and state and municipal bonds. The unrealized loss at the time of transfer is being amortized monthly over the remaining lives of the debt securities with an increase to the carrying value of the debt securities and a decrease to the related accumulated other comprehensive loss, which is included in the stockholders’ equity section of the consolidated balance sheets.
109
The following tables summarize the amortized cost, gross unrealized gains and losses, fair value and allowance for credit losses of AFS and HTM debt securities at December 31, 2024 and December 31, 2023 (dollars in thousands):
| December 31, 2024 | |||||||||||||||||||||||||||||
| Amortized Cost |
Gross Unrealized Gains |
Gross
Unrealized
Losses
|
Fair Value |
Allowance for Credit Losses |
|||||||||||||||||||||||||
| Securities available for sale: | |||||||||||||||||||||||||||||
| U.S. government and federal agencies | $ | $ | $ | ( |
$ | $ | |||||||||||||||||||||||
| Mortgage-backed securities | ( |
||||||||||||||||||||||||||||
| Corporate bonds | ( |
||||||||||||||||||||||||||||
| State and municipal securities | ( |
||||||||||||||||||||||||||||
| Total securities available for sale | $ | $ | $ | ( |
$ | $ | |||||||||||||||||||||||
| Securities held to maturity: | |||||||||||||||||||||||||||||
| U.S. government and federal agencies | $ | $ | $ | ( |
$ | $ | |||||||||||||||||||||||
| Mortgage-backed securities | ( |
||||||||||||||||||||||||||||
| Corporate bonds | ( |
( |
|||||||||||||||||||||||||||
| State and municipal securities | ( |
( |
|||||||||||||||||||||||||||
| Total securities held to maturity | $ | $ | $ | ( |
$ | $ | ( |
||||||||||||||||||||||
| Total securities | $ | $ | $ | ( |
$ | $ | ( |
||||||||||||||||||||||
| December 31, 2023 | |||||||||||||||||||||||||||||
| Amortized Cost |
Gross Unrealized Gains |
Gross
Unrealized
Losses
|
Fair Value |
Allowance for Credit Losses |
|||||||||||||||||||||||||
| Securities available for sale: | |||||||||||||||||||||||||||||
| U.S. government and federal agencies | $ | $ | $ | ( |
$ | $ | |||||||||||||||||||||||
| Mortgage-backed securities | ( |
||||||||||||||||||||||||||||
| Corporate bonds | ( |
||||||||||||||||||||||||||||
| State and municipal securities | ( |
||||||||||||||||||||||||||||
| Total securities available for sale | $ | $ | $ | ( |
$ | $ | |||||||||||||||||||||||
| Securities held to maturity: | |||||||||||||||||||||||||||||
| U.S. government and federal agencies | $ | $ | $ | ( |
$ | $ | |||||||||||||||||||||||
| Mortgage-backed securities | ( |
||||||||||||||||||||||||||||
| Corporate bonds | ( |
( |
|||||||||||||||||||||||||||
| State and municipal securities | ( |
( |
|||||||||||||||||||||||||||
| Total securities held to maturity | $ | $ | $ | ( |
$ | $ | ( |
||||||||||||||||||||||
| Total securities | $ | $ | $ | ( |
$ | $ | ( |
||||||||||||||||||||||
There were no holdings of any municipal or corporate debt issuer that equaled or exceeded 10.0% of stockholders’ equity at December 31, 2024 and December 31, 2023.
There were no
Proceeds from calls, maturities, paydowns and sales of debt securities available for sale totaled $187.6 million for the twelve months ended December 31, 2024 and $50.8 million for the twelve months ended December 31, 2023. Proceeds from sales, calls, maturities, and paydowns of debt securities held to maturity totaled $7.4 million and $3.2 million for the twelve month periods ended December 31, 2024 and 2023, respectively.
110
During the twelve months ended December 31, 2024, the Bank sold an AFS bond that was charged off during a prior year for $210 thousand. The proceeds were recorded as a recapture of credit loss. Because this sale did not result in a realized gain or loss on sale of securities, it is excluded from the related tables below.
The proceeds, gross realized gains and losses from sales of debt securities during the twelve months ended December 31, 2024 and 2023 were as follows (dollars in thousands):
| Twelve Months Ended December 31, 2024 |
||||||||
| Available for Sale | Held to Maturity | |||||||
| Proceeds from sales and calls of securities | $ | $ | ||||||
| Gross gains | ||||||||
| Gross losses | ( |
( |
||||||
| Net losses on sale of a securities | $ | ( |
$ | ( |
||||
| Income tax benefit attributable to realized net losses on sale of securities | $ | $ | ||||||
| Twelve Months Ended December 31, 2023 |
||||||||
| Available for Sale | Held to Maturity | |||||||
| Proceeds from sales of securities | $ | $ | ||||||
| Gross gains | ||||||||
| Gross losses | ( |
( |
||||||
| Net losses on sale of a securities | $ | ( |
$ | ( |
||||
| Income tax benefit attributable to realized net losses on sale of securities | $ | $ | ||||||
Management classifies bonds as HTM only when the Company has the ability and intent to hold the bond to maturity, and certain sales or transfers of HTM could call into question management’s ability or intent to hold the remaining HTM bond portfolio to maturity, thereby “tainting” the entire portfolio and triggering a reclassification of the entire portfolio to available for sale. However, there are limited situations, including evidence of deterioration in the issuer’s creditworthiness, in which the Company could sell an HTM bond without tainting the remaining HTM portfolio. During 2024, the Company sold two HTM bonds from a single issuer due to significant documented deterioration of the issuer’s creditworthiness evidenced by the downgrading of the issuer’s public credit rating, compared to 2023, when one HTM bond was sold under similar circumstances. The sales are included in the tables above. Under these circumstances, the sales did not taint the HTM portfolio.
The amortized cost and fair value of debt securities by contractual maturity at December 31, 2024 is as follows (dollars in thousands):
| Available for Sale | Held to Maturity | ||||||||||||||||||||||
| Amortized Cost |
Fair Value |
Amortized Cost |
Fair Value |
||||||||||||||||||||
| Within one year | $ | $ | $ | $ | |||||||||||||||||||
| After one year through five years | |||||||||||||||||||||||
| After five years through ten years | |||||||||||||||||||||||
| Over ten years | |||||||||||||||||||||||
| Total | $ | $ | $ | $ | |||||||||||||||||||
Expected maturities may differ from contractual maturities if issuers have the right to call or repay obligations with or without prepayment penalties.
111
The following table shows the gross unrealized losses and fair value of the Company’s AFS debt securities with unrealized losses aggregated by investment category and length of time that individual debt securities have been in a continuous unrealized loss position at December 31, 2024 and December 31, 2023 (dollars in thousands):
| December 31, 2024 | |||||||||||||||||||||||||||||||||||
| Less Than Twelve Months |
Over Twelve Months | Total | |||||||||||||||||||||||||||||||||
| Gross Unrealized Loss |
Fair Value |
Gross Unrealized Loss |
Fair Value |
Gross Unrealized Loss |
Fair Value |
||||||||||||||||||||||||||||||
| Securities available for sale: | |||||||||||||||||||||||||||||||||||
| U.S. government and federal agencies | $ | ( |
$ | $ | ( |
$ | $ | ( |
$ | ||||||||||||||||||||||||||
| Mortgage-backed securities | ( |
( |
|||||||||||||||||||||||||||||||||
| Corporate bonds | ( |
( |
( |
||||||||||||||||||||||||||||||||
| State and municipal securities | ( |
( |
( |
||||||||||||||||||||||||||||||||
| Total securities available for sale | $ | ( |
$ | $ | ( |
$ | $ | ( |
$ | ||||||||||||||||||||||||||
| December 31, 2023 | |||||||||||||||||||||||||||||||||||
| Less Than Twelve Months |
Over Twelve Months | Total | |||||||||||||||||||||||||||||||||
| Gross Unrealized Loss |
Fair Value |
Gross Unrealized Loss |
Fair Value |
Gross Unrealized Loss |
Fair Value |
||||||||||||||||||||||||||||||
| Securities available for sale: | |||||||||||||||||||||||||||||||||||
| U.S. government and federal agencies | $ | ( |
$ | $ | ( |
$ | $ | ( |
$ | ||||||||||||||||||||||||||
| Mortgage-backed securities | ( |
( |
|||||||||||||||||||||||||||||||||
| Corporate bonds | ( |
( |
( |
||||||||||||||||||||||||||||||||
| State and municipal securities | ( |
( |
( |
||||||||||||||||||||||||||||||||
| Total securities available for sale | $ | ( |
$ | $ | ( |
$ | $ | ( |
$ | ||||||||||||||||||||||||||
In the AFS portfolio at December 31, 2024, 37 out of 49 debt securities of the U.S. government and federal agencies, 14 out of 19 mortgage-backed securities, 76 out of 90 corporate bonds, and 269 out of 298 state and municipal securities were in an unrealized loss position. All of the Company’s investment portfolio was evaluated under the monitoring process described in Note 1, and all investments were deemed investment grade. All of the unrealized losses are attributed to changes in market interest rates, and are not a result of deterioration of creditworthiness among any of the issuers.
Of the total AFS and HTM portfolio at December 31, 2024 and December 31, 2023, 776 and 880 debt securities had unrealized losses with aggregate impairment of 4.3 % and 6.0 %, respectively, of the Company’s amortized cost basis. These unrealized losses related principally to interest rate movements and not the creditworthiness of the issuer. In analyzing an issuer’s financial condition, management considers whether the debt securities are issued by the federal government or its agencies, whether downgrades by bond rating agencies have occurred, and industry analysts’ reports. Credit loss allowances for the AFS and HTM portfolios are described in the following sections.
Allowance for Credit Losses—AFS Securities
Management evaluates debt securities to determine whether the unrealized loss is due to credit-related factors or non-credit-related factors. This analysis occurs on a quarterly basis. Consideration is given to the extent to which fair value is less than cost, the financial condition and near-term prospects of the issuer, and the intent and ability of the Company to retain its investment in the security for a period of time sufficient to allow for full recovery of its amortized cost. If the assessment reveals that a credit loss exists, the present value of the expected cash flows of the security is compared to the amortized cost basis of the security. If the present value of future cash flows expected to be collected is less than the amortized cost, an allowance for the credit loss is recorded. The loss is limited by the amount that the amortized cost exceeds fair value.
112
As of the reporting date, the Company did not intend to sell any of the AFS debt securities, did not expect to be required to sell these debt securities, and expected to recover the entire amortized cost basis of all of the debt securities.
The Company did not
The table below presents a rollforward by major security type of the allowance for credit losses on AFS debt securities for the twelve months ended December 31, 2024 and 2023 (dollars in thousands):
| December 31, 2024 | |||||||||||||||||||||||||||||
| U.S. Government and Federal Agencies |
Mortgage Backed Securities |
Corporate Bonds |
State and Municipal Securities |
Total AFS Securities |
|||||||||||||||||||||||||
| Allowance for credit losses: | |||||||||||||||||||||||||||||
| Beginning balance, December 31, 2023 | $ | $ | $ | $ | $ | ||||||||||||||||||||||||
| Provision for (recapture of) credit losses | ( |
( |
|||||||||||||||||||||||||||
| Write offs charged against the allowance | |||||||||||||||||||||||||||||
| Recoveries of amounts previously written off | |||||||||||||||||||||||||||||
| Ending balance, December 31, 2024 | $ | $ | $ | $ | $ | ||||||||||||||||||||||||
At December 31, 2024, there was no allowance for credit losses on AFS debt securities recorded. During the twelve months ended December 31, 2024, the Bank received proceeds totaling $210 thousand for a bond that was fully charged off during 2023, and recorded a recovery of credit loss. The entire ACL recovery during 2024 was recorded in the first quarter.
| December 31, 2023 | |||||||||||||||||||||||||||||
| U.S. Government and Federal Agencies |
Mortgage Backed Securities |
Corporate Bonds |
State and Municipal Securities |
Total AFS Securities |
|||||||||||||||||||||||||
| Allowance for credit losses: | |||||||||||||||||||||||||||||
| Beginning balance, December 31, 2022 | $ | $ | $ | $ | $ | ||||||||||||||||||||||||
| Impact of adopting ASC 326 | |||||||||||||||||||||||||||||
| Provision for credit losses | |||||||||||||||||||||||||||||
| Write offs charged against the allowance | ( |
( |
|||||||||||||||||||||||||||
| Recoveries of amounts previously written off | |||||||||||||||||||||||||||||
| Ending balance, December 31, 2023 | $ | $ | $ | $ | $ | ||||||||||||||||||||||||
At December 31, 2023, there was no allowance for credit losses on AFS debt securities recorded. The entire ACL provision recorded for the AFS portfolio during 2023 was recorded in the first quarter and pertained to a holding from a single corporate issuer whose business was ultimately closed by a regulatory authority. The bond, initially classified as HTM, was transferred to the AFS portfolio based on the unlikely collectability of the unsecured bond and significant documented credit deterioration. A portion of the bond was subsequently sold at a loss, and the remaining unsold portion was written off entirely. The write-off was subsequently partially recovered during 2024.
113
Credit Quality Indicators and Allowance for Credit Losses - HTM Securities
The Company evaluates the credit risk of its HTM debt securities on a quarterly basis. The Company estimates expected credit losses on HTM debt securities using an instrument-level process described in Note 1. The primary indicators of credit quality for the Company’s HTM portfolio are security type, time remaining to maturity, and credit rating. Credit ratings may be influenced by a number of factors including obligor cash flows, geography, seniority and others. The HTM portfolio includes debt securities issued by the U.S. Treasury and agencies of the federal government, and mortgage-backed securities issued by government agencies. These types of investments carry implicit or explicit backing of the U.S. Treasury, and therefore are deemed to carry no credit risk for purposes of the ACL evaluation.
The following table presents the amortized cost of HTM debt securities as of December 31, 2024 and December 31, 2023 by security type and credit rating (dollars in thousands):
| December 31, 2024 | |||||||||||||||||||||||||||||
| U.S. Government and Federal Agencies |
Mortgage Backed Securities |
Corporate Bonds |
State and Municipal Securities |
Total HTM Securities |
|||||||||||||||||||||||||
| AAA / AA / A | $ | $ | $ | $ | $ | ||||||||||||||||||||||||
| BBB / BB / B | |||||||||||||||||||||||||||||
| Total | $ | $ | $ | $ | $ | ||||||||||||||||||||||||
114
| December 31, 2023 | |||||||||||||||||||||||||||||
| U.S. Government and Federal Agencies |
Mortgage Backed Securities |
Corporate Bonds |
State and Municipal Securities |
Total HTM Securities |
|||||||||||||||||||||||||
| AAA / AA / A | $ | $ | $ | $ | $ | ||||||||||||||||||||||||
| BBB / BB / B | |||||||||||||||||||||||||||||
| Total | $ | $ | $ | $ | $ | ||||||||||||||||||||||||
The following tables summarize the change in the allowance for credit losses on HTM debt securities for the twelve months ended December 31, 2024 and 2023 (dollars in thousands):
| December 31, 2024 | |||||||||||||||||||||||||||||
| U.S. Government and Federal Agencies |
Mortgage Backed Securities |
Corporate Bonds |
State and Municipal Securities |
Total HTM Securities |
|||||||||||||||||||||||||
| Allowance for credit losses: | |||||||||||||||||||||||||||||
| Beginning balance, December 31, 2023 | $ | $ | $ | $ | $ | ||||||||||||||||||||||||
| Provision for (recapture of) credit losses | ( |
( |
|||||||||||||||||||||||||||
| Write offs charged against the allowance | |||||||||||||||||||||||||||||
| Recoveries of amounts previously written off | |||||||||||||||||||||||||||||
| Ending balance, December 31, 2024 | $ | $ | $ | $ | $ | ||||||||||||||||||||||||
| December 31, 2023 | |||||||||||||||||||||||||||||
| U.S. Government and Federal Agencies |
Mortgage Backed Securities |
Corporate Bonds |
State and Municipal Securities |
Total HTM Securities |
|||||||||||||||||||||||||
| Allowance for credit losses: | |||||||||||||||||||||||||||||
| Beginning balance, December 31, 2022 | $ | $ | $ | $ | $ | ||||||||||||||||||||||||
| Impact of adopting ASC 326 | |||||||||||||||||||||||||||||
| Provision for credit losses | |||||||||||||||||||||||||||||
| Write offs charged against the allowance | |||||||||||||||||||||||||||||
| Recoveries of amounts previously written off | |||||||||||||||||||||||||||||
| Ending balance, December 31, 2023 | $ | $ | $ | $ | $ | ||||||||||||||||||||||||
At December 31, 2024, the Company had no HTM debt securities that were 30 days or more past due as to principal and interest payments. The Company had no debt securities held to maturity classified as non-accrual as of December 31, 2024.
Equity Securities
115
Note 4. Loans and Allowance for Loan Credit Losses
A summary of the composition of the loan portfolio at December 31, 2024 and December 31, 2023 is as follows (dollars in thousands):
| December 31, 2024 | December 31, 2023 | ||||||||||
| Commercial real estate | $ | $ | |||||||||
| Commercial | |||||||||||
| Residential real estate closed-end | |||||||||||
| Other consumer loans | |||||||||||
| Less allowance for credit losses | ( |
( |
|||||||||
| Loans, net | $ | $ | |||||||||
Overdrafts totaling $27 thousand and $10 thousand at December 31, 2024 and December 31, 2023, respectively, were reclassified from deposits to loans.
The totals above include deferred costs (net of deferred fees) of $519 thousand at December 31, 2024 and $466 thousand at December 31, 2023.
The following tables present the activity in the allowance for credit losses by portfolio segment for the twelve months ended December 31, 2024 and 2023 (dollars in thousands):
| December 31, 2024 | |||||||||||||||||||||||||||||
| Commercial Real Estate |
Commercial | Residential Real Estate Closed-End |
Other Consumer Loans |
Total | |||||||||||||||||||||||||
| Allowance for credit losses: | |||||||||||||||||||||||||||||
| Beginning balance, December 31, 2023 | $ | $ | $ | $ | $ | ||||||||||||||||||||||||
| Provision for (recapture of) credit losses | ( |
( |
|||||||||||||||||||||||||||
| Loans charged-off | |||||||||||||||||||||||||||||
| Recoveries collected | |||||||||||||||||||||||||||||
| Ending balance, December 31, 2024 | $ | $ | $ | $ | $ | ||||||||||||||||||||||||
| December 31, 2023 | |||||||||||||||||||||||||||||
| Commercial Real Estate |
Commercial | Residential Real Estate Closed-End |
Other Consumer Loans |
Total | |||||||||||||||||||||||||
| Allowance for credit losses: | |||||||||||||||||||||||||||||
| Beginning balance, December 31, 2022 | $ | $ | $ | $ | $ | ||||||||||||||||||||||||
| Impact of adopting ASC 326 | ( |
( |
|||||||||||||||||||||||||||
| Provision for (recapture of) credit losses | ( |
( |
|||||||||||||||||||||||||||
| Loans charged-off | |||||||||||||||||||||||||||||
| Recoveries collected | |||||||||||||||||||||||||||||
| Ending balance, December 31, 2023 | $ | $ | $ | $ | $ | ||||||||||||||||||||||||
There were no nonaccrual loans, loans 90 days past due and still accruing, or past due for 30 or more days as of December 31, 2024 and December 31, 2023.
116
The Company categorizes loans into risk categories based on relevant information about the ability of borrowers to service their debt such as: current financial information, historical payment experience, credit documentation, public information and current economic trends, among other factors. The Company’s loan risk grading system and ongoing monitoring process is discussed in Note 1.
The following table presents the outstanding balance of the loan portfolio, by year of origination, loan classification, and credit quality, as of December 31, 2024 and December 31, 2023 (dollars in thousands):
| December 31, 2024 | Term Loans by Year of Origination | Revolving Loans | Revolving to Term Loans | Total | |||||||||||||||||||||||||||||||||||||||||||||||||
| 2024 | 2023 | 2022 | 2021 | 2020 | Prior | ||||||||||||||||||||||||||||||||||||||||||||||||
| Commercial real estate | |||||||||||||||||||||||||||||||||||||||||||||||||||||
| Pass | $ | $ | $ | $ | $ | $ | $ | $ | $ | ||||||||||||||||||||||||||||||||||||||||||||
| Special Mention | |||||||||||||||||||||||||||||||||||||||||||||||||||||
| Substandard | |||||||||||||||||||||||||||||||||||||||||||||||||||||
| Doubtful | |||||||||||||||||||||||||||||||||||||||||||||||||||||
| Loss | |||||||||||||||||||||||||||||||||||||||||||||||||||||
| Total | $ | $ | $ | $ | $ | $ | $ | $ | $ | ||||||||||||||||||||||||||||||||||||||||||||
Current period gross charge-offs |
$ | $ | $ | $ | $ | $ | $ | $ | $ | ||||||||||||||||||||||||||||||||||||||||||||
| Commercial | |||||||||||||||||||||||||||||||||||||||||||||||||||||
| Pass | $ | $ | $ | $ | $ | $ | $ | $ | $ | ||||||||||||||||||||||||||||||||||||||||||||
| Special Mention | |||||||||||||||||||||||||||||||||||||||||||||||||||||
| Substandard | |||||||||||||||||||||||||||||||||||||||||||||||||||||
| Doubtful | |||||||||||||||||||||||||||||||||||||||||||||||||||||
| Loss | |||||||||||||||||||||||||||||||||||||||||||||||||||||
| Total | $ | $ | $ | $ | $ | $ | $ | $ | $ | ||||||||||||||||||||||||||||||||||||||||||||
Current period gross charge-offs |
$ | $ | $ | $ | $ | $ | $ | $ | $ | ||||||||||||||||||||||||||||||||||||||||||||
| Residential real estate closed-end | |||||||||||||||||||||||||||||||||||||||||||||||||||||
| Pass | $ | $ | $ | $ | $ | $ | $ | $ | $ | ||||||||||||||||||||||||||||||||||||||||||||
| Special Mention | |||||||||||||||||||||||||||||||||||||||||||||||||||||
| Substandard | |||||||||||||||||||||||||||||||||||||||||||||||||||||
| Doubtful | |||||||||||||||||||||||||||||||||||||||||||||||||||||
| Loss | |||||||||||||||||||||||||||||||||||||||||||||||||||||
| Total | $ | $ | $ | $ | $ | $ | $ | $ | $ | ||||||||||||||||||||||||||||||||||||||||||||
Current period gross charge-offs |
$ | $ | $ | $ | $ | $ | $ | $ | $ | ||||||||||||||||||||||||||||||||||||||||||||
| Other consumer loans | |||||||||||||||||||||||||||||||||||||||||||||||||||||
| Pass | $ | $ | $ | $ | $ | $ | $ | $ | $ | ||||||||||||||||||||||||||||||||||||||||||||
| Special Mention | |||||||||||||||||||||||||||||||||||||||||||||||||||||
| Substandard | |||||||||||||||||||||||||||||||||||||||||||||||||||||
| Doubtful | |||||||||||||||||||||||||||||||||||||||||||||||||||||
| Loss | |||||||||||||||||||||||||||||||||||||||||||||||||||||
| Total | $ | $ | $ | $ | $ | $ | $ | $ | $ | ||||||||||||||||||||||||||||||||||||||||||||
Current period gross charge-offs |
|||||||||||||||||||||||||||||||||||||||||||||||||||||
| Total Portfolio Loans | |||||||||||||||||||||||||||||||||||||||||||||||||||||
| Pass | $ | $ | $ | $ | $ | $ | $ | $ | $ | ||||||||||||||||||||||||||||||||||||||||||||
| Special Mention | |||||||||||||||||||||||||||||||||||||||||||||||||||||
| Substandard | |||||||||||||||||||||||||||||||||||||||||||||||||||||
| Doubtful | |||||||||||||||||||||||||||||||||||||||||||||||||||||
| Loss | |||||||||||||||||||||||||||||||||||||||||||||||||||||
| Total Portfolio Loans | $ |
|
$ |
|
$ |
|
$ |
|
$ |
|
$ |
|
$ |
|
$ |
|
$ |
|
|||||||||||||||||||||||||||||||||||
| Current period gross charge-offs |
|
|
|
|
|
|
|
|
|
||||||||||||||||||||||||||||||||||||||||||||
117
| December 31, 2023 | Term Loans by Year of Origination | Revolving Loans |
Revolving to Term Loans | Total | |||||||||||||||||||||||||||||||||||||||||||||||||
| 2023 | 2022 | 2021 | 2020 | 2019 | Prior | ||||||||||||||||||||||||||||||||||||||||||||||||
| Commercial real estate | |||||||||||||||||||||||||||||||||||||||||||||||||||||
| Pass | $ | $ | $ | $ | $ | $ | $ | $ | $ | ||||||||||||||||||||||||||||||||||||||||||||
| Special Mention | |||||||||||||||||||||||||||||||||||||||||||||||||||||
| Substandard | |||||||||||||||||||||||||||||||||||||||||||||||||||||
| Doubtful | |||||||||||||||||||||||||||||||||||||||||||||||||||||
| Loss | |||||||||||||||||||||||||||||||||||||||||||||||||||||
| Total | $ | $ | $ | $ | $ | $ | $ | $ | $ | ||||||||||||||||||||||||||||||||||||||||||||
Current period gross charge-offs |
$ | $ | $ | $ | $ | $ | $ | $ | $ | ||||||||||||||||||||||||||||||||||||||||||||
| Commercial | |||||||||||||||||||||||||||||||||||||||||||||||||||||
| Pass | $ | $ | $ | $ | $ | $ | $ | $ | $ | ||||||||||||||||||||||||||||||||||||||||||||
| Special Mention | |||||||||||||||||||||||||||||||||||||||||||||||||||||
| Substandard | |||||||||||||||||||||||||||||||||||||||||||||||||||||
| Doubtful | |||||||||||||||||||||||||||||||||||||||||||||||||||||
| Loss | |||||||||||||||||||||||||||||||||||||||||||||||||||||
| Total | $ | $ | $ | $ | $ | $ | $ | $ | $ | ||||||||||||||||||||||||||||||||||||||||||||
Current period gross charge-offs |
$ | $ | $ | $ | $ | $ | $ | $ | $ | ||||||||||||||||||||||||||||||||||||||||||||
| Residential real estate closed end | |||||||||||||||||||||||||||||||||||||||||||||||||||||
| Pass | $ | $ | $ | $ | $ | $ | $ | $ | $ | ||||||||||||||||||||||||||||||||||||||||||||
| Special Mention | |||||||||||||||||||||||||||||||||||||||||||||||||||||
| Substandard | |||||||||||||||||||||||||||||||||||||||||||||||||||||
| Doubtful | |||||||||||||||||||||||||||||||||||||||||||||||||||||
| Loss | |||||||||||||||||||||||||||||||||||||||||||||||||||||
| Total | $ | $ | $ | $ | $ | $ | $ | $ | $ | ||||||||||||||||||||||||||||||||||||||||||||
Current period gross charge-offs |
$ | $ | $ | $ | $ | $ | $ | $ | $ | ||||||||||||||||||||||||||||||||||||||||||||
| Other consumer loans | |||||||||||||||||||||||||||||||||||||||||||||||||||||
| Pass | $ | $ | $ | $ | $ | $ | $ | $ | $ | ||||||||||||||||||||||||||||||||||||||||||||
| Special Mention | |||||||||||||||||||||||||||||||||||||||||||||||||||||
| Substandard | |||||||||||||||||||||||||||||||||||||||||||||||||||||
| Doubtful | |||||||||||||||||||||||||||||||||||||||||||||||||||||
| Loss | |||||||||||||||||||||||||||||||||||||||||||||||||||||
| Total | $ | $ | $ | $ | $ | $ | $ | $ | $ | ||||||||||||||||||||||||||||||||||||||||||||
Current period gross charge-offs |
$ | $ | $ | $ | $ | $ | $ | $ | $ | ||||||||||||||||||||||||||||||||||||||||||||
| Total Portfolio Loans | |||||||||||||||||||||||||||||||||||||||||||||||||||||
| Pass | $ | $ | $ | $ | $ | $ | $ | $ | $ | ||||||||||||||||||||||||||||||||||||||||||||
| Special Mention | |||||||||||||||||||||||||||||||||||||||||||||||||||||
| Substandard | |||||||||||||||||||||||||||||||||||||||||||||||||||||
| Doubtful | |||||||||||||||||||||||||||||||||||||||||||||||||||||
| Loss | |||||||||||||||||||||||||||||||||||||||||||||||||||||
| Total Portfolio Loans | $ |
|
$ |
|
$ |
|
$ |
|
$ |
|
$ |
|
$ |
|
$ |
|
$ |
|
|||||||||||||||||||||||||||||||||||
| Current period gross charge-offs |
|
|
|
|
|
|
|
|
|
||||||||||||||||||||||||||||||||||||||||||||
118
Collateral Dependent Loans
FASB ASC Topic 326 describes a collateral-dependent asset as a financial asset for which the repayment is expected to be provided substantially through the operation or sale of the collateral when the borrower, based on management’s assessment, is experiencing financial difficulty as of the reporting date. Whether the underlying collateral is expected to be a substantial source of repayment for an asset depends on the availability, reliability, and capacity of sources other than the collateral to repay the debt. Collateral-dependent loans are individually evaluated for expected credit losses as of the reporting date, and they are removed from their respective pools of collectively evaluated assets. Expected credit losses for these types of assets are based on the fair value of the collateral at the measurement date, adjusted for estimated selling costs. There were no collateral-dependent loans that were individually evaluated for purposes of determining the allowance for credit loss under FASB ASC Topic 326 as of December 31, 2024 and December 31, 2023.
Modifications to Borrowers Experiencing Financial Difficulty
The Company may modify loans to borrowers in financial distress by providing principal forgiveness, term extension, and other-than-insignificant payment delay or interest rate reduction. When principal forgiveness is provided, the amount of forgiveness is charged-off against the allowance for credit losses. There were no loan modifications provided to borrowers exhibiting financial distress during the twelve months ended December 31, 2024 and 2023, and there were no such prior modifications in existence during the periods reported. During the reported periods, there were no payment defaults from any such loans during the twelve months preceding the modification because no such modifications were in existence during the periods.
Related Party Loan Transactions
Note 5. Premises and Equipment
A summary of the cost and accumulated depreciation of premises and equipment follows (dollars in thousands):
| December 31, | |||||||||||
| 2024 | 2023 | ||||||||||
| Land | $ | $ | |||||||||
| Building | |||||||||||
| Furniture, fixtures and equipment | |||||||||||
| Building improvements | |||||||||||
| Construction in process | |||||||||||
| $ | $ | ||||||||||
| Less accumulated depreciation | ( |
( |
|||||||||
| Ending balance | $ | $ | |||||||||
For December 31, 2024 and 2023, depreciation expense was $494 thousand and $491 thousand, respectively.
Note 6. Deposits
Remaining maturities on certificates of deposit are as follows (dollars in thousands):
119
| 2025 | $ | ||||
| 2026 | |||||
| 2027 | |||||
| 2028 and thereafter | |||||
| $ | |||||
The Bank held no 130.3 million and $177.3 million, respectively, of reciprocal deposits through ICS®, which were included on the consolidated balance sheets. Additionally, total ICS® One-Way Sell® deposits of $63.3 million and $130.1 million as of December 31, 2024, and December 31, 2023, respectively, were sold to the network and therefore excluded from the Company’s consolidated balance sheets. The Company receives fee income for the deposits that are sold, which is reported under deposit placement services income on the consolidated statements of income.
As of December 31, 2024, two clients each maintained an individual deposit balance exceeding 5.0% of total deposits. The combined total deposit balance related to these clients was $202.6 million, accounting for 16.2 % of total deposits. As of December 31, 2023, there were no clients whose individual deposit balances exceeded 5.0% of total deposits.
Deposits from related parties held by the Company amounted to $2.0
Note 7. Borrowings
Federal Home Loan Bank Credit Availability
The Bank maintains eligibility for a secured line of credit with the Federal Home Loan Bank (“FHLB”). To establish credit availability, the Bank will typically pledge eligible 1-4 family residential real estate loans from its loan portfolio as collateral.
As of December 31, 2024 and 2023, the Bank had not pledged any collateral to the FHLB. Consequently, no credit availability was established, and no outstanding borrowings were recorded.
Short-Term Borrowing Facilities
As of December 31, 2024, the Company had no outstanding short-term borrowings. The Company fully repaid its previously outstanding balance on an unsecured line of credit from a correspondent bank. The line of credit, which had a total commitment of $10.0 million and an outstanding balance of $5.0 million as of December 31, 2023, was fully repaid on October 10, 2024, using a portion of the net proceeds from the IPO. The Company formally closed the line of credit on October 11, 2024. The interest rate on the line of credit was 7.95 % at December 31, 2023.
The Bank maintains access to unsecured federal funds purchase lines of credit with:
•Pacific Coast Bankers’ Bank: $50.0 million, maturing June 30, 2025
•First National Bankers’ Bank: $10.0 million, maturing June 30, 2025
•Community Bankers’ Bank: $8.0 million, matured March 12, 2025 and subsequently renewed for a one year period to March 12, 2026
These federal funds lines renew annually, and balances may remain outstanding for periods ranging from 10 to 90 consecutive days. The use of these credit facilities is contingent upon compliance with specified financial conditions and covenants.
As of December 31, 2024 and December 31, 2023, the Bank had no
120
Note 8. Income Taxes
The tax effects of temporary differences that give rise to significant portions of the deferred tax assets and deferred tax liabilities at December 31, 2024 and 2023 are presented below (dollars in thousands):
| December 31 | |||||||||||
| 2024 | 2023 | ||||||||||
| Deferred Tax Assets | |||||||||||
| Securities available for sale | $ | $ | |||||||||
| Allowance for credit losses on loans | |||||||||||
| Deferred compensation | |||||||||||
| Depreciation | |||||||||||
| Allowance for credit losses on securities | |||||||||||
| Loss on devalued bond | |||||||||||
| Other | |||||||||||
| $ | $ | ||||||||||
| Deferred Tax Liabilities | |||||||||||
| Deferred loan costs | $ | ( |
$ | ( |
|||||||
| Net deferred tax assets | $ | $ | |||||||||
Deferred tax assets are reported as other assets on the consolidated balance sheets.
The provision for income taxes charged to operations for the years ended December 31, 2024 and 2023, consists of the following (dollars in thousands):
| December 31, | |||||||||||
| 2024 | 2023 | ||||||||||
| Current tax expense | $ | $ | |||||||||
| Deferred tax benefit | ( |
( |
|||||||||
| Net provision for income taxes | $ | $ | |||||||||
The reasons for the difference between the Company’s reported income tax expense and the amount computed by multiplying the statutory rate are as follows (dollars in thousands):
| December 31, | |||||||||||
| 2024 | 2023 | ||||||||||
| Computed tax at applicable rate | $ | $ | |||||||||
| Tax-exempt income | ( |
( |
|||||||||
| Other | |||||||||||
| Net provision for income taxes | $ | $ | |||||||||
The Company files an income tax return in the U.S. federal jurisdiction and is subject to the bank franchise tax in the Commonwealth of Virginia. With few exceptions, the Company is no longer subject to federal or state tax examinations for years prior to 2021.
121
Note 9. Financial Instruments with Off-Balance Sheet Risk
The Company is party to credit related financial instruments with off-balance-sheet risk in the normal course of business to meet the financing needs of its clients. These financial instruments include commitments to extend credit and standby letters of credit. Such commitments involve, to varying degrees, elements of credit and interest rate risk in excess of the amount recognized in the consolidated balance sheets.
The Company’s exposure to credit loss is represented by the contractual amount of these commitments. The Company follows the same credit policies in making commitments as it does for on-balance-sheet instruments.
At December 31, 2024 and 2023, the contractual amounts of financial instruments with off-balance commitments are as follows (dollars in thousands):
| December 31, | |||||||||||
| 2024 | 2023 | ||||||||||
| Commitments to grant loans | $ | $ | |||||||||
Credit card lines |
|||||||||||
| Unfunded commitments under lines of credit | |||||||||||
| Standby letters of credit | |||||||||||
Commitments to grant loans are agreements to extend loans to clients provided the clients are in compliance with terms and conditions outlined in the respective loan documents. These commitments often come with specific expiration dates or other termination conditions, such as maturity dates, and may necessitate the payment of fees. Notably, lines of credit commitments might expire without being utilized, implying that the total commitment amounts do not accurately forecast future cash outflows. For collateral requirements, the Bank determines the necessity and amount based on an analysis of the borrower.
Unfunded commitments under credit card lines are related to business credit cards and represent potential future extensions of credit to current clients. These commitments, which are revolving in nature, allow cardholders to access credit up to a pre-approved limit without additional underwriting at the time of each transaction. Unlike traditional term loans, business credit card commitments may be partially or fully drawn at the discretion of the cardholder, and the outstanding balance fluctuates based on usage and repayment. The Bank evaluates the creditworthiness of business credit card holders at origination and may periodically reassess risk exposure. The Bank offers both secured and unsecured cards and aims to mitigate associated credit risk through monitoring, transaction limits, and credit reviews.
Unfunded commitments under lines of credit represent potential future credit extensions to current clients. Commercial lines of credit typically feature maturity dates within one year and do not automatically renew. Conversely, consumer revolving lines of credit and home equity lines, offer draw periods ranging from three to ten years, respectively, also without automatic renewal. These lines of credit are discretionary, with actual funding potentially falling short of the full commitment amount.
Standby letters of credit are conditional commitments by the Bank, serving as guarantees of a client’s performance to a third party. These instruments are typically utilized to facilitate both public and private borrowing arrangements. Almost all letters of credit issued are set to expire within one year, subject to automatic renewal unless terminated by the Bank in accordance with the terms of the agreement. The credit risk associated with issuing letters of credit mirrors that of extending traditional loan facilities to clients, with collateral being secured as deemed necessary by the Bank.
Note 10. Regulatory Capital Requirements
The Bank is subject to various regulatory capital requirements administered by the federal banking agencies. Failure to meet minimum capital requirements can initiate certain mandatory, possibly additional discretionary, actions by regulators that, if undertaken, could have a direct material effect on the Company’s and the Bank’s financial statements. Under capital adequacy guidelines and the regulatory framework for prompt corrective action, financial institutions must meet specific capital guidelines that involve quantitative measures of assets, liabilities, and certain off-balance-sheet items as
122
calculated under regulatory accounting practices. A financial institution’s capital amounts and classification are also subject to qualitative judgments by the regulators about components, risk weightings, and other factors. Prompt corrective action provisions are not applicable to bank holding companies.
The final rules implementing Basel Committee on Banking Supervision’s Capital guidelines for U.S. banks require the Bank to hold a capital conservation buffer of 2.5 % above the adequately capitalized risk-based capital ratios. Although the capital conservation buffer is not part of regulatory minimum risk-based capital requirements, it does determine the minimums that must be met to avoid limitation on paying dividends, engaging in share repurchases, and paying discretionary bonuses if capital levels fall below the buffer amount. The net unrealized gain or loss on securities available for sale is not included in computing regulatory capital.
To be categorized as well capitalized under the OCC’s regulatory framework for prompt corrective action, the Bank must maintain minimum risk-based capital and leverage ratios as set forth in the table below. The Bank currently satisfies the requirement under the OCC’s capital regulation to be “well capitalized.”
The following tables set forth the capital position and analysis for the Company and Bank (dollars in thousands). Because total assets on a consolidated basis are less than $3.0 billion, the Company is not subject to the consolidated capital requirements imposed by federal regulations. However, the Company elects to include those ratios for this report. Minimum capital ratios below include the capital conservation buffer. At December 31, 2023, the Company had a borrowing from a correspondent bank which it used to downstream capital to the Bank, with a balance of $5.0 million. This borrowing was paid off and subsequently closed during 2024.
Minimum Capital Requirement (including applicable capital conservation buffer) |
Minimum To Be Well Capitalized Under Prompt Corrective Action Provisions | ||||||||||||||||||||||||||||||||||
| Actual | |||||||||||||||||||||||||||||||||||
| December 31, 2024 | Amount | Ratio | Amount | Ratio | Amount | Ratio | |||||||||||||||||||||||||||||
| Total Risk-Based Capital | |||||||||||||||||||||||||||||||||||
| Company | $ | N/A | N/A | N/A | N/A | ||||||||||||||||||||||||||||||
| Bank | $ | % | $ | % | $ | % | |||||||||||||||||||||||||||||
| Tier 1 Risk-Based Capital | |||||||||||||||||||||||||||||||||||
| Company | $ | N/A | N/A | N/A | N/A | ||||||||||||||||||||||||||||||
| Bank | $ | % | $ | % | $ | % | |||||||||||||||||||||||||||||
| Common Equity Tier 1 Capital | |||||||||||||||||||||||||||||||||||
| Company | $ | N/A | N/A | N/A | N/A | ||||||||||||||||||||||||||||||
| Bank | $ | % | $ | % | $ | % | |||||||||||||||||||||||||||||
| Tier 1 Leverage Ratio | |||||||||||||||||||||||||||||||||||
| Company | $ | N/A | N/A | N/A | N/A | ||||||||||||||||||||||||||||||
| Bank | $ | % | $ | % | $ | % | |||||||||||||||||||||||||||||
123
Minimum Capital Requirement (including applicable capital conservation buffer) |
Minimum To Be Well Capitalized Under Prompt Corrective Action Provisions | ||||||||||||||||||||||||||||||||||
| Actual | |||||||||||||||||||||||||||||||||||
| December 31, 2023 | Amount | Ratio | Amount | Ratio | Amount | Ratio | |||||||||||||||||||||||||||||
| Total Risk-Based Capital | |||||||||||||||||||||||||||||||||||
| Company | $ | % | N/A | N/A | N/A | N/A | |||||||||||||||||||||||||||||
| Bank | $ | % | $ | % | $ | % | |||||||||||||||||||||||||||||
| Tier 1 Risk-Based Capital | |||||||||||||||||||||||||||||||||||
| Company | $ | % | N/A | N/A | N/A | N/A | |||||||||||||||||||||||||||||
| Bank | $ | % | $ | % | $ | % | |||||||||||||||||||||||||||||
| Common Equity Tier 1 Capital | |||||||||||||||||||||||||||||||||||
| Company | $ | % | N/A | N/A | N/A | N/A | |||||||||||||||||||||||||||||
| Bank | $ | % | $ | % | $ | % | |||||||||||||||||||||||||||||
| Tier 1 Leverage Ratio | |||||||||||||||||||||||||||||||||||
| Company | $ | % | N/A | N/A | N/A | N/A | |||||||||||||||||||||||||||||
| Bank | $ | % | $ | % | $ | % | |||||||||||||||||||||||||||||
Note 11. Employee Benefit Plans
401(k) Plan
The Company has a 401(k) Plan whereby substantially all employees participate in the plan. Employees may contribute portions of their compensation subject to limits based on federal tax laws. The Company may make discretionary matching contributions to the plan. For 2024 and 2023, expense attributable to the plan amounted to $471 thousand and $401 thousand, respectively. The 401(k) expense is reported as salaries and employee benefits on the consolidated statements of income.
Long-Term Cash Incentive Plan
The Company maintains a long-term cash incentive compensation plan under which awarded participants are entitled to receive cash payments equivalent to the increase in Retained Earnings Per Share (“REPS”), as defined in the plan, with a vesting period extending over seven years . As of December 31, 2024 and December 31, 2023, the accrued liability for obligations under this plan was $3.2 million and $1.9 million, respectively. For the years 2024 and 2023, expenses attributable to the plan amounted to $1.6 million and $631 thousand, respectively.
On September 10, 2024, the Board of Directors adopted the Amended and Restated Long-Term Cash Incentive Plan, which became effective immediately. Under this plan, all awards granted in 2024 or later vest over five years , reflecting a change from the previous plan, under which awards granted prior to 2024 vest over seven years .
The accrued liability for vested and unvested awards is reported under accrued expenses and other liabilities on the consolidated balance sheets, while plan-related expenses are recognized in salaries and employee benefits in the consolidated statements of income.
124
Note 12. Fair Value Measurements
Determination of Fair Value
Fair value is defined as the exchange price that would be received for an asset or paid to transfer a liability (an exit price) in the principal or most advantageous market for the asset or liability in an orderly transaction between market participants on the measurement date. The fair value measurements and disclosure topic specifies a hierarchy of valuation techniques based on whether the inputs to these valuation techniques are observable or unobservable. Observable inputs reflect market data obtained from independent sources, while unobservable inputs reflect the Company’s market assumptions. U.S. GAAP requires that valuation techniques maximize the use of observable inputs and minimize the use of unobservable inputs.
Fair Value Hierarchy
U.S. GAAP establishes a fair value hierarchy which categorizes the valuation inputs into three broad levels. Based on the underlying inputs, each fair value measurement in its entirety is reported in one of the three levels. These levels are:
Level 1 - Valuation is based on quoted prices in active markets for identical assets and liabilities that the reporting entity has the ability to access at the measurement date. Level 1 assets and liabilities generally include debt and equity securities that are traded in an active exchange market. Valuations are obtained from readily available pricing sources for market transactions involving identical assets or liabilities.
Level 2 - Valuation is based on inputs other than quoted prices included within Level 1 that are observable for the asset or liability, either directly or indirectly. The valuation may be based on quoted prices for similar assets or liabilities; quoted prices in markets that are not active; or other inputs that are observable or can be corroborated by observable market data for substantially the full term of the asset or liability.
Level 3 - Valuation is based on unobservable inputs that are supported by little or no market activity and that are significant to the fair value of the assets or liabilities. Level 3 assets and liabilities include financial instruments whose value is determined using pricing models, discounted cash flow methodologies, or similar techniques, as well as instruments for which determination of fair value requires significant management judgment or estimation.
An asset or liability’s categorization within the valuation hierarchy is based upon the lowest level of input that is significant to the fair value measurement.
Assets and Liabilities Measured at Fair Value on a Recurring Basis
The following describes the valuation techniques used by the Company to measure certain financial assets and liabilities recorded at fair value on a recurring basis in the financial statements:
Securities Available for Sale and Equity Securities
Debt securities available for sale and equity securities are recorded at fair value on a recurring basis. Fair value measurement is based upon quoted market prices, when available (Level 1). If quoted market prices are not available, fair values are measured utilizing independent valuation techniques of identical or similar securities for which significant assumptions are derived primarily from or corroborated by observable market data (Level 2). If the inputs used to provide the evaluation for certain securities are unobservable and/or there is little, if any, market activity then the security would fall to the lowest level of the hierarchy (Level 3).
The Company’s investment portfolio is valued using fair value measurements that are considered to be Level 1 or Level 2 but may also use Level 3 measurements if required by the composition of the portfolio. The Bank has contracted with a securities portfolio accounting service provider for valuation of its securities portfolio. Most security types are priced using the securities accounting provider’s internally developed pricing software which appraises securities from an online real-time database. Subscription pricing services such as ICE Data Services and Bloomberg Valuation Services may be used to supplement the internal pricing system for security types where the underlying collateral, cash flow projections or trade data is not readily available. If Level 1 or Level 2 inputs are not available, the software may rely upon a discounted cash flow analysis based on the net present value of a security’s projected cash flow to arrive at fair market value. Valuations for direct obligations of the U.S. Treasury, exchange listed stock and preferred stock are obtained from on-line real-time databases.
125
The securities accounting service provider utilizes proprietary valuation matrices for valuing all municipal securities. The initial curves for determining the price, movement, and yield relationships within the municipal matrices are derived from industry benchmark curves or sourced from a municipal trading desk. The securities are further broken down according to issuer, credit support, state of issuance and rating to incorporate additional spreads to the industry benchmark curves.
The following table presents the balances of financial assets measured at fair value on a recurring basis (dollars in thousands):
| Fair Value Measurements Using | |||||||||||||||||||||||
| Financial Assets | Balances | Level 1 | Level 2 | Level 3 | |||||||||||||||||||
| As of December 31, 2024: | |||||||||||||||||||||||
| Available for sale securities: | |||||||||||||||||||||||
| U.S. government and federal agencies | $ | $ | $ | $ | |||||||||||||||||||
| Mortgage-backed securities | |||||||||||||||||||||||
| Corporate bonds | |||||||||||||||||||||||
| State and municipal securities | |||||||||||||||||||||||
| Total available for sale securities | $ | $ | $ | $ | |||||||||||||||||||
| Equity securities | |||||||||||||||||||||||
| Total | $ | $ | $ | $ | |||||||||||||||||||
| As of December 31, 2023: | |||||||||||||||||||||||
| Available for sale securities: | |||||||||||||||||||||||
| U.S. government and federal agencies | $ | $ | $ | $ | |||||||||||||||||||
| Mortgage-backed securities | |||||||||||||||||||||||
| Corporate bonds | |||||||||||||||||||||||
| State and municipal securities | |||||||||||||||||||||||
| Total available for sale securities | $ | $ | $ | $ | |||||||||||||||||||
| Equity securities | |||||||||||||||||||||||
| Total | $ | $ | $ | $ | |||||||||||||||||||
Assets Measured at Fair Value on a Non-recurring Basis
Certain assets are measured at fair value on a nonrecurring basis in accordance with generally accepted accounting principles. Adjustments to the fair value of these assets usually result from the application of lower-of-cost-or-market accounting or write-downs of individual assets.
Collateral Dependent Loans
Individually evaluated loans are analyzed to determine whether they are collateral dependent. Any individually evaluated loans, which are deemed to be collateral dependent, with an allocation to the ACL are measured at fair value on a non-recurring basis. Any fair value adjustments are recorded in the period incurred as provision for credit losses on the consolidated statements of income.
The measurement of loss associated with collateral dependent loans can be based on either the observable market price of the loan or fair value of the collateral. Fair value is measured based on the value of the collateral securing the loans. Collateral may be in the form of real estate or business assets including equipment, inventory, and accounts receivable. The vast majority of the collateral is real estate. The value of real estate collateral is determined utilizing a market valuation approach based on an appraisal conducted by an independent, licensed appraiser outside of the Company using observable market data (Level 2). However, if the collateral is a house or building in the process of construction or if an appraisal of the real estate property using an income approach or is over two years old, then the fair value is considered Level 3. The value of business equipment is based upon an outside appraisal if deemed significant, or the net book value on the applicable business’s financial statements if not considered significant using observable market data. Likewise, values for inventory and accounts receivables collateral are based on financial statement balances or aging reports (Level 3). Any fair
126
value adjustments are recorded in the period incurred as a provision for loan credit losses on the consolidated statements of income. There were no collateral dependent loans with a recorded reserve as of December 31, 2024 and December 31, 2023.
Other Real Estate Owned
Other real estate owned (“OREO”) is measured at fair value less costs to sell. Valuation of OREO is determined using current appraisals from independent parties, a Level 2 input. If current appraisals cannot be obtained, or if declines in value are identified after a recent appraisal is received, appraisal values may be discounted, resulting in a Level 3 estimate. If the Company markets the property with a realtor, estimated selling costs reduce the fair value, resulting in a valuation based on Level 3 inputs. Fair value adjustments are recorded in the period incurred and expensed against current earnings. The Bank held no OREO at December 31, 2024 and December 31, 2023.
Loans Held for Sale
Loans held for sale are carried at the lower of cost or fair value. These loans currently consist of 1-4 family residential loans originated for sale in the secondary market. Fair value is based on the price secondary markets are currently offering for similar loans using observable market data which is not materially different than cost due to the short duration between origination and sale (Level 2). As such, the Company records any fair value adjustments on a nonrecurring basis. No
There were no
Fair Value of Financial Instruments
The following tables present the carrying value and estimated fair value including the level within the fair value hierarchy of the Company’s financial instruments as of December 31, 2024 and December 31, 2023 (dollars in thousands):
| Carrying Amount |
Fair Value Measurements Using | Total Fair Value |
|||||||||||||||||||||||||||
| Level 1 | Level 2 | Level 3 | |||||||||||||||||||||||||||
| As of December 31, 2024: | |||||||||||||||||||||||||||||
| Financial assets: | |||||||||||||||||||||||||||||
| Cash and due from banks | $ | $ | $ | $ | $ | ||||||||||||||||||||||||
| Securities available for sale | |||||||||||||||||||||||||||||
| Securities held to maturity, net | |||||||||||||||||||||||||||||
| Equity securities | |||||||||||||||||||||||||||||
| Restricted securities | |||||||||||||||||||||||||||||
Loans held for sale |
|||||||||||||||||||||||||||||
| Loans, net | |||||||||||||||||||||||||||||
| Accrued interest receivable | |||||||||||||||||||||||||||||
| Financial liabilities: | |||||||||||||||||||||||||||||
| Demand and savings deposits | $ | $ | $ | $ | $ | ||||||||||||||||||||||||
| Time deposits | |||||||||||||||||||||||||||||
| Accrued interest payable | |||||||||||||||||||||||||||||
127
| Carrying Amount |
Fair Value Measurements Using | Total Fair Value |
|||||||||||||||||||||||||||
| Level 1 | Level 2 | Level 3 | |||||||||||||||||||||||||||
| As of December 31, 2023: | |||||||||||||||||||||||||||||
| Financial assets: | |||||||||||||||||||||||||||||
| Cash and due from banks | $ | $ | $ | $ | $ | ||||||||||||||||||||||||
| Securities available for sale | |||||||||||||||||||||||||||||
| Securities held to maturity, net | |||||||||||||||||||||||||||||
| Equity securities | |||||||||||||||||||||||||||||
| Restricted securities | |||||||||||||||||||||||||||||
| Loans, net | |||||||||||||||||||||||||||||
| Accrued interest receivable | |||||||||||||||||||||||||||||
| Financial liabilities: | |||||||||||||||||||||||||||||
| Demand and savings deposits | $ | $ | $ | $ | $ | ||||||||||||||||||||||||
| Time deposits | |||||||||||||||||||||||||||||
| Short-term borrowings | |||||||||||||||||||||||||||||
| Accrued interest payable | |||||||||||||||||||||||||||||
Note 13. Accumulated Other Comprehensive Loss
The following table presents the changes in each component in accumulated other comprehensive loss, net of tax for the twelve months ended December 31, 2024 and 2023 (dollars in thousands):
|
Unrealized Loss
on Available for
Sale Securities
|
Unrealized Loss
on Securities Transferred
from Available for Sale
to Held to Maturity
|
Accumulated Other Comprehensive Loss |
|||||||||||||||
| Balance at December 31, 2022 | $ | ( |
$ | ( |
$ | ( |
|||||||||||
Unrealized holding gains, net of tax of $ |
— | ||||||||||||||||
Amortization of unrealized holding losses, net of tax of $ |
— | ||||||||||||||||
Reclassification adjustment, net of tax of $ |
|||||||||||||||||
| Balance at December 31, 2023 | $ | ( |
$ | ( |
$ | ( |
|||||||||||
| Balance at December 31, 2023 | $ | ( |
$ | ( |
$ | ( |
|||||||||||
Unrealized holding gains, net of tax of $ |
|||||||||||||||||
Amortization of unrealized holding losses, net of tax of $ |
|||||||||||||||||
Reclassification adjustment, net of tax of $ |
|||||||||||||||||
| Balance at December 31, 2024 | $ | ( |
$ | ( |
$ | ( |
|||||||||||
The following table presents the amounts reclassified out of accumulated other comprehensive loss, net of tax for the period ending December 31, 2024 (dollars in thousands):
| Year Ended December 31, 2024 |
Line Item in the Consolidated
Statements of Income
|
||||||||||
| Securities held to maturity | |||||||||||
| Net securities loss reclassified into earnings | $ | ( |
Loss on sale of securities | ||||||||
| Related income tax benefit | Income tax expense | ||||||||||
| Total reclassifications into net income | $ | ( |
Net of tax | ||||||||
128
| Year Ended December 31, 2024 |
Line Item in the Consolidated
Statements of Income
|
||||||||||
| Securities available for sale | |||||||||||
| Net securities loss reclassified into earnings | $ | ( |
Loss on sale of securities | ||||||||
| Related income tax benefit | Income tax expense | ||||||||||
| Total reclassifications into net income | $ | ( |
Net of tax | ||||||||
The following table presents the amounts reclassified out of accumulated other comprehensive loss, net of tax for the period ending December 31, 2023 (dollars in thousands):
| Year Ended December 31, 2023 |
Line Item in the Consolidated
Statements of Income
|
||||||||||
| Securities available for sale | |||||||||||
| Net securities loss reclassified into earnings | $ | ( |
Loss on sale of securities | ||||||||
| Related income tax benefit | Income tax expense | ||||||||||
| Total reclassifications into net income | $ | ( |
Net of tax | ||||||||
Note 14.
The Company’s stock is comprised of two classes: Class A Common Stock and Class B Common Stock. Except in regard to voting and conversion rights, the rights of Class A Common Stock and Class B Common Stock are identical, and the classes rank equally and share ratably with regard to all other matters. Each share of Class B Common Stock is convertible at any time into one share of Class A Common Stock. Because Class A Common Stock and Class B Common Stock share in earnings equally, any potential conversions of Class B Common Stock to Class A Common Stock do not have a dilutive impact.
On October 3, 2024, 26,876 existing shares of Old Common Stock held by the company’s pre-IPO investors were reclassified into 4,568,920 1,850,000 shares of Class A Common Stock on October 7, 2024 and 142,897 shares of Class A Common Stock on November 1, 2024. Additional information regarding the stock Reclassification and the IPO is described in Note 2.
When declared by the Company’s Board of Directors, holders of Class A Common Stock and Class B Common Stock are entitled to receive dividends equally and ratably on a per-share basis. The Company did not pay dividends to any stockholder during the twelve months ended December 31, 2024 or 2023.
Under the two-class method, earnings available to common stockholders are allocated ratably on a per-share basis between Class A Common Stock and Class B Common Stock. The table below provides a reconciliation of the combined Class A and Class B Common Stock numerators and denominators of the earnings per share computations (dollars in thousands, except per share data). The number of basic and diluted shares are the same because there are no potentially dilutive instruments.
| Year Ended | ||||||||
| December 31, | December 31, | |||||||
| 2024 | 2023 | |||||||
| Net Income | $ | $ | ||||||
| Dividends declared on common stock | ||||||||
| Class A Common Stock | $ | $ | ||||||
| Class B Common Stock | $ | $ | ||||||
| Undistributed net income for basic and diluted earnings per share | $ | $ | ||||||
129
| Weighted average shares outstanding | ||||||||
| Class A Common Stock | ||||||||
| Class B Common Stock | ||||||||
| Weighted average shares outstanding, basic and dilutive | ||||||||
| Year Ended | ||||||||
| December 31, | December 31, | |||||||
| 2024 | 2023 | |||||||
| Earnings per common share, basic and diluted | ||||||||
| Class A Common Stock | ||||||||
| Per share dividends distributed | $ | $ | ||||||
| Undistributed earnings per share4 | ||||||||
| Total basic and diluted earnings per share - Class A Common Stock | $ | $ | ||||||
| Class B Common Stock | ||||||||
| Per share dividends distributed | $ | $ | ||||||
Undistributed earnings per share4
|
||||||||
| Total basic and diluted earnings per share - Class B Common Stock | $ | $ | ||||||
Note 15. Condensed Financial Statements of Parent Company
Financial information pertaining only to Chain Bridge Bancorp, Inc. is as follows (dollars in thousands):
| December 31, | |||||||||||
| Balance Sheets | 2024 | 2023 | |||||||||
| Assets | |||||||||||
| Cash | $ | $ | |||||||||
| Receivable from subsidiary | |||||||||||
| Investment in common stock of Chain Bridge Bank, N.A. | |||||||||||
| Total assets | $ | $ | |||||||||
| Liabilities and stockholders' equity | |||||||||||
| Short-term borrowings | $ | $ | |||||||||
| Accrued expenses | |||||||||||
| Total liabilities | $ | ||||||||||
| Stockholders’ equity | |||||||||||
| Total liabilities and stockholders’ equity | $ | $ | |||||||||
4 To arrive at undistributed earnings per share, undistributed net income is first pro rated between Class A and Class B Common shares. The resulting pro-rated, undistributed net income for each class is then divided by the weighted average shares for each class.
130
| December 31, | |||||||||||
| Statements of Income | 2024 | 2023 | |||||||||
| Dividend from Chain Bridge Bank, N.A. | $ | $ | |||||||||
| Operating expenses | |||||||||||
| Interest expense and fees on short-term borrowings | |||||||||||
| Professional services | |||||||||||
| Other expenses | |||||||||||
| Total operating expenses | |||||||||||
| Loss before allocated tax expense and undistributed net income of Chain Bridge Bank, N.A. | ( |
( |
|||||||||
| Income tax benefit | ( |
( |
|||||||||
| Undistributed net income of Chain Bridge Bank, N.A. | |||||||||||
| Net income | $ | $ | |||||||||
| December 31, | |||||||||||
| Statements of Cash Flows | 2024 | 2023 | |||||||||
| Cash flows from operating activities | |||||||||||
| Net income | $ | $ | |||||||||
| Adjustments to reconcile net income to net cash used in operating activities: | |||||||||||
| Undistributed net income of Chain Bridge Bank, N.A. | ( |
( |
|||||||||
| Decrease (increase) in receivable from subsidiary | ( |
||||||||||
| Increase (decrease) in accrued expenses | ( |
||||||||||
| Net cash used in operating activities | ( |
( |
|||||||||
| Cash flows from investing activities | |||||||||||
| Investment in Chain Bridge Bank, N.A. | ( |
||||||||||
| Net cash used in investing activities | ( |
||||||||||
| Cash flows from financing activities | |||||||||||
| Net proceeds from common stock issued | |||||||||||
| Repayment of short-term borrowings | ( |
||||||||||
| Net cash provided by financing activities | |||||||||||
| Net increase (decrease) in cash and cash equivalents | ( |
||||||||||
| Cash and cash equivalents at beginning of period | |||||||||||
| Cash and cash equivalents at end of period | $ | $ | |||||||||
131
Note 16. Subsequent Events
The Company evaluates subsequent events that have occurred after the balance sheet date but before the financial statements are issued. There are two types of subsequent events: (1) recognized, or those that provide additional evidence about conditions that existed at the date of the balance sheet, including the estimates inherent in the process of preparing financial statements, and (2) non-recognized, or those that provide evidence about conditions that did not exist at the date of the balance sheet but arose after that date. The Company evaluated subsequent events through March 21, 2025.
The Company did not identify any subsequent events that would have required adjustment to or disclosure in the financial statements.
132
ITEM 9. CHANGES IN AND DISAGREEMENTS WITH ACCOUNTANTS ON ACCOUNTING AND FINANCIAL DISCLOSURE
None.
ITEM 9A. CONTROLS AND PROCEDURES
Evaluation of Disclosure Controls and Procedures
The Company’s management, including our Principal Executive Officer and Principal Financial Officer, have evaluated the effectiveness of our disclosure controls and procedures (as defined in Rule 13a-15(e)) under the Securities Exchange Act of 1934, as amended (the “Exchange Act”)) as of the end of the period covered by this report. Based upon that evaluation, our Principal Executive Officer and Principal Financial Officer concluded that our disclosure controls and procedures were effective to ensure that information required to be disclosed in the reports we file and submit under the Exchange Act is (i) recorded, processed, summarized and reported as and when required and (ii) accumulated and communicated to our management, including our Principal Executive Officer and the Principal Financial Officer, as appropriate to allow timely decisions regarding required disclosure.
Management’s Annual Report on Internal Control over Financial Reporting
This Annual Report on Form 10-K does not include a report of management’s assessment regarding internal control over financial reporting or an attestation report of the company’s registered public accounting firm due to a transition period established by rules of the SEC for newly public companies.
Attestation Report of Independent Auditor
In accordance with the JOBS Act enacted on April 5, 2012, the Company qualifies as an “emerging growth company” (“EGC”), which entitles the Company to take advantage of certain exemptions from various reporting requirements that are applicable to other public companies that are not EGCs. Specifically, the JOBS Act defers the requirement to have the Company’s independent auditor assess the Company’s internal control over financial reporting under Section 404(b) of the Sarbanes-Oxley Act. As such, the Company is exempted from the requirement to include an auditor attestation report in this Annual Report for so long as the Company remains an EGC, which may be for as long as five years following its initial registration in the United States.
Changes in Internal Control over Financial Reporting
There have been no changes, in the Company’s internal control over financial reporting (as such term is defined in Rule 13a-15(f) under the Exchange Act) during the fiscal quarter to which this report relates that have materially affected, or are reasonably likely to materially affect, the Company’s internal control over financial reporting.
ITEM 9B. OTHER INFORMATION
Rule 10b5-1 Trading Plans
During the year ended December 31, 2024, no
ITEM 9C. DISCLOSURE REGARDING FOREIGN JURISDICTIONS THAT PREVENT INSPECTIONS
Not Applicable.
133
PART III
ITEM 10. DIRECTORS, EXECUTIVE OFFICERS, AND CORPORATE GOVERNANCE
The information required to be disclosed by this item will be disclosed in, and is incorporated herein by reference to, the Company’s definitive proxy statement for its 2025 Annual Meeting of Stockholders (“Proxy Statement”) to be filed with the SEC no later than 120 days after December 31, 2024.
ITEM 11. EXECUTIVE COMPENSATION
The information required to be disclosed by this item will be disclosed in, and is incorporated herein by reference to, the Company’s Proxy Statement to be filed with the SEC no later than 120 days after December 31, 2024.
ITEM 12. SECURITY OWNERSHIP OF CERTAIN BENEFICIAL OWNERS AND MANAGEMENT AND RELATED STOCKHOLDER MATTERS
The information required to be disclosed by this item will be disclosed in, and is incorporated herein by reference to, the Company’s Proxy Statement to be filed with the SEC no later than 120 days after December 31, 2024.
ITEM 13. CERTAIN RELATIONSHIPS AND RELATED TRANSACTIONS AND DIRECTOR INDEPENDENCE
The information required to be disclosed by this item will be disclosed in, and is incorporated herein by reference to, the Company’s Proxy Statement to be filed with the SEC no later than 120 days after December 31, 2024.
ITEM 14. PRINCIPAL ACCOUNTANT FEES AND SERVICES
The information required to be disclosed by this item will be disclosed in, and is incorporated herein by reference to, the Company’s Proxy Statement to be filed with the SEC no later than 120 days after December 31, 2024.
134
PART IV
ITEM 15. EXHIBITS AND FINANCIAL STATEMENT SCHEDULES
We have filed the following documents as part of this Annual Report on Form 10-K:
1.Consolidated Financial Statements
See Index to Consolidated Financial Statements in Part II, Item 8, “Financial Statements” in this Annual Report on Form 10-K.
2.Financial Statement Schedules
No financial statement schedules are provided because the information called for is not required or is shown in the financial statements or the notes thereto.
3.Exhibits
The documents set forth below are filed herewith or incorporated herein by reference to the location indicated.
| Number | Description | |||||||
| 3.1 | ||||||||
| 3.2 | ||||||||
| 4.1 | ||||||||
| 10.1 | ||||||||
| 10.2 | ||||||||
| 10.3 | ||||||||
| 19.1 | ||||||||
| 21.1 | ||||||||
| 31.1 | ||||||||
| 31.2 | ||||||||
| 32.1 | ||||||||
| 97.1 | ||||||||
| 101 | Inline XBRL Interactive Data | |||||||
| 104 | Cover Page Interactive Data File (embedded within the Inline XBRL document in Exhibit 101) | |||||||
†Certain confidential information contained in this document has been omitted pursuant to Item 601(b)(10)(iv) of Regulation S-K, because the Company customarily and actually treats such information as private or confidential and the omitted information is not material.
ITEM 16. FORM 10-K SUMMARY
None.
135
SIGNATURES
Pursuant to the requirements of Section 13 or 15(d) of the Securities Exchange Act of 1934, the Registrant has duly caused this report to be signed on its behalf by the undersigned, thereunto duly authorized.
| CHAIN BRIDGE BANCORP, INC. | ||||||||
Dated: March 21, 2025 |
By: | /s/ John J. Brough | ||||||
| Name: | John J. Brough | |||||||
| Title: |
Chief Executive Officer and Director
(Principal Executive Officer)
|
|||||||
Pursuant to the requirements of the Securities Exchange Act of 1934, this report has been signed below by the following persons on behalf of the registrant and in the capacities and on the dates indicated.
Name |
Position |
Date |
||||||||||||
/s/ Peter G. Fitzgerald |
Chairman of the Board |
March 21, 2025 |
||||||||||||
Peter G. Fitzgerald |
||||||||||||||
/s/ John J. Brough |
Chief Executive Officer & Director
(Principal Executive Officer)
|
March 21, 2025 |
||||||||||||
John J. Brough |
||||||||||||||
/s/ Joanna R. Williamson |
Executive Vice President & Chief Financial Officer (Principal Financial Officer & Principal Accounting Officer) |
March 21, 2025 |
||||||||||||
| Joanna R. Williamson | ||||||||||||||
/s/ David M. Evinger |
President, Chief Credit Officer & Director |
March 21, 2025 |
||||||||||||
David M. Evinger |
||||||||||||||
/s/ Leigh-Alexandra Basha |
Director |
March 21, 2025 |
||||||||||||
Leigh-Alexandra Basha |
||||||||||||||
/s/ Michael J. Conover |
Director |
March 21, 2025 |
||||||||||||
Michael J. Conover |
||||||||||||||
/s/ Andrew J. Fitzgerald |
Director |
March 21, 2025 |
||||||||||||
Andrew J. Fitzgerald |
||||||||||||||
/s/ Joseph M. Fitzgerald |
Director |
March 21, 2025 |
||||||||||||
Joseph M. Fitzgerald |
||||||||||||||
/s/ Thomas G. Fitzgerald |
Director |
March 21, 2025 |
||||||||||||
Thomas G. Fitzgerald |
||||||||||||||
/s/ Michelle L. Korsmo |
Director |
March 21, 2025 |
||||||||||||
Michelle L. Korsmo |
||||||||||||||
136
Name |
Position |
Date |
||||||||||||
/s/ Paul W. Leavitt |
Director |
March 21, 2025 |
||||||||||||
Paul W. Leavitt |
||||||||||||||
/s/ Mark Martinelli |
Director |
March 21, 2025 |
||||||||||||
Mark Martinelli |
||||||||||||||
/s/ Yonesy F. Núñez |
Director |
March 21, 2025 |
||||||||||||
Yonesy F. Núñez |
||||||||||||||
/s/ Benita Thompson-Byas |
Director |
March 21, 2025 |
||||||||||||
Benita Thompson-Byas |
||||||||||||||
137