DRS: Draft registration statement submitted by Emerging Growth Company under Securities Act Section 6(e) or by Foreign Private Issuer under Division of Corporation Finance policy
Published on July 2, 2024
Table of Contents
As confidentially submitted to the Securities and Exchange Commission on July 2, 2024
This draft registration statement has not been publicly filed with the Securities and Exchange Commission and all
information herein remains strictly confidential
Registration No. 333-
UNITED STATES
SECURITIES AND EXCHANGE COMMISSION
Washington, D.C. 20549
FORM S-1
REGISTRATION STATEMENT
UNDER
THE SECURITIES ACT OF 1933
Chain Bridge Bancorp, Inc.
(Exact Name of Registrant as Specified in Its Charter)
| Delaware | 6021 | 20-4957796 | ||
| (State or Other Jurisdiction of Incorporation or Organization) |
(Primary Standard Industrial Classification Code Number) |
(IRS Employer Identification Number) |
1445-A Laughlin Avenue
McLean, VA 22101
(703)-748-2005
(Address, Including Zip Code, and Telephone Number, Including Area Code, of Registrants Principal Executive Offices)
Rachel G. Miller
Senior Vice President, Counsel & Corporate Secretary
Chain Bridge Bancorp, Inc.
1445-A Laughlin Avenue
McLean, VA 22101
(703)-748-2005
(Name, Address, Including Zip Code, and Telephone Number, Including Area Code, of Agent for Service)
Copies to:
| Catherine M. Clarkin Stephen M. Salley Sullivan & Cromwell LLP 125 Broad Street New York, New York 10004 Telephone: (212) 558-4000 |
Kevin M. Houlihan William H. Levay Holland & Knight LLP 800 17th Street N.W. Washington, DC 20006 Telephone: (202) 955-3000 |
Approximate date of commencement of the proposed sale of the securities to the public: As soon as practicable after the Registration Statement is declared effective.
If any of the securities being registered on this form are to be offered on a delayed or continuous basis pursuant to Rule 415 under the Securities Act of 1933, check the following box. ☐
If this form is filed to register additional securities for an offering pursuant to Rule 462(b) under the Securities Act, please check the following box and list the Securities Act registration statement number of the earlier effective registration statement for the same offering. ☐
If this form is a post-effective amendment filed pursuant to Rule 462(c) under the Securities Act, check the following box and list the Securities Act registration statement number of the earlier effective registration statement for the same offering. ☐
If this form is a post-effective amendment filed pursuant to Rule 462(d) under the Securities Act, check the following box and list the Securities Act registration statement number of the earlier effective registration statement for the same offering. ☐
Indicate by check mark whether the registrant is a large accelerated filer, an accelerated filer, a non-accelerated filer, smaller reporting company, or an emerging growth company. See the definitions of large accelerated filer, accelerated filer, smaller reporting company, and emerging growth company in Rule 12b-2 of the Exchange Act.
| Large accelerated filer | ☐ | Accelerated filer | ☐ | |||
| Non-accelerated filer | ☒ | Smaller reporting company | ☒ | |||
| Emerging growth company | ☒ | |||||
If an emerging growth company, indicate by check mark if the registrant has elected not to use the extended transition period for complying with any new or revised financial accounting standards provided pursuant to Section 7(a)(2)(B) of the Securities Act. ☒
The Registrant hereby amends this Registration Statement on such date or dates as may be necessary to delay its effective date until the Registrant shall file a further amendment which specifically states that this Registration Statement shall thereafter become effective in accordance with Section 8(a) of the Securities Act of 1933 or until the Registration Statement shall become effective on such date as the Securities and Exchange Commission, acting pursuant to said Section 8(a), may determine.
Table of Contents
The information in this preliminary prospectus is not complete and may be changed. We may not sell these securities until the registration statement filed with the Securities and Exchange Commission is effective. This preliminary prospectus is not an offer to sell, nor does it seek an offer to buy, these securities in any jurisdiction where such offer or sale is not permitted.
Subject to Completion
Preliminary Prospectus dated , 2024
PROSPECTUS
Shares

Chain Bridge Bancorp, Inc.
Class A Common Stock
This is the initial public offering of shares of Class A common stock, par value $0.01 per share, of Chain Bridge Bancorp, Inc. We are offering shares of our Class A common stock.
Prior to this offering, there has been no public market for our Class A common stock. It is currently estimated that the initial public offering price per share of our Class A common stock will be between $ and $ per share. We intend to apply to list our Class A common stock on The New York Stock Exchange under the symbol CBNA.
Following this offering, we will have two classes of common stock, Class A common stock and Class B common stock. The rights of Class A common stock and Class B common stock are identical, except voting and conversion rights. Each share of Class A common stock is entitled to one vote. Each share of Class B common stock is entitled to 10 votes and is convertible at any time into one share of Class A common stock. After the completion of this offering, the holders of our Class B common stock are expected to collectively beneficially own shares of our common stock representing a substantial majority of the combined voting power of our common stock. Members of the Fitzgerald Family (as defined herein) are expected to beneficially own in the aggregate at least % of our outstanding Class B common stock. The dual class structure of our common stock has the effect of concentrating voting power with the holders of our Class B common stock, including the members of the Fitzgerald Family, which will limit or preclude your ability to influence corporate matters, including the election of our board of directors. Our amended and restated certificate of incorporation will provide certain protections for the holders of Class A common stock. See Description of Capital Stock.
We are an emerging growth company and a smaller reporting company as defined under the U.S. federal securities laws and, as such, may elect to comply with certain reduced public company reporting requirements. See Summary Implications of Being an Emerging Growth Company and a Smaller Reporting Company.
Shares of our common stock are not saving accounts, deposits or other obligations of a bank and are not insured by the Federal Deposit Insurance Corporation or any other government agency.
Investing in our Class A common stock involves significant risks. See Risk Factors beginning on page 26 of this prospectus for a discussion of certain risks you should consider before deciding to invest in our Class A common stock.
Neither the Securities and Exchange Commission, any state securities commission, the Federal Deposit Insurance Corporation, the Board of Governors of the Federal Reserve System nor any other regulatory body has approved or disapproved of these securities or passed upon the accuracy or adequacy of this prospectus. Any representation to the contrary is a criminal offense.
| Per Share | Total | |||||||
| Initial public offering price |
$ | $ | ||||||
| Underwriting discount and commissions(1) |
$ | $ | ||||||
| Proceeds, before expenses, to us |
$ | $ | ||||||
| (1) | We have agreed to reimburse the underwriters for certain expenses in connection with this offering. See Underwriting. |
We have granted the underwriters an option to purchase up to an additional shares of our Class A common stock at the public offering price, less the underwriting discount, within 30 days from the date of this prospectus.
The underwriters expect to deliver the shares of Class A common stock against payment on or about , 2024.
| Piper Sandler | Raymond James |
| Hovde |
The date of this prospectus is , 2024.
Table of Contents
| Page | ||||
| 1 | ||||
| 26 | ||||
| 56 | ||||
| 58 | ||||
| 59 | ||||
| 60 | ||||
| 62 | ||||
| Managements Discussion and Analysis of Financial Condition and Results of Operations |
64 | |||
| 96 | ||||
| 115 | ||||
| 125 | ||||
| 135 | ||||
| Security Ownership of Certain Beneficial Owners andManagement |
140 | |||
| 144 | ||||
| 146 | ||||
| 152 | ||||
| Material United States Tax Consequences to Non-U.S. Holders of Common Stock |
154 | |||
| 158 | ||||
| 162 | ||||
| 162 | ||||
| 162 | ||||
| F-1 | ||||
We have not, and the underwriters have not, authorized anyone to provide any information or to make any representation other than those contained in this prospectus or any free writing prospectuses we have prepared. We and the underwriters take no responsibility for, and can provide no assurance as to the reliability of, any other information that others may give you. We are offering to sell, and seeking offers to buy, shares of our Class A common stock only in jurisdictions where offers and sales are permitted. You should assume that the information appearing in this prospectus is accurate only as of the date of this prospectus, regardless of the time of delivery of this prospectus or any sale of shares of our Class A common stock. Our business, financial condition, results of operations and prospects may have changed since that date.
Through and including , 2024 (the 25th day after the date of this prospectus), all dealers effecting transactions in our Class A common stock, whether or not participating in this offering, may be required to deliver a prospectus. This is in addition to a dealers obligation to deliver a prospectus when acting as an underwriter and with respect to an unsold allotment or subscription.
Market and Industry Data
Within this prospectus, we reference certain industry and sector information and statistics. We have obtained this information and statistics from various independent, third-party sources. Nothing in the data used or derived from third-party sources should be construed as advice. Some data and other information are also based on our good faith estimates, which are derived from our review of internal surveys and independent sources. We believe that these external sources and estimates are reliable, but have not independently verified them. Statements as to our market position are based on market data currently available to us. Although we are not aware of any misstatements regarding the demographic, economic, employment, industry and trade association data presented herein, these estimates involve inherent risks and uncertainties and are based on assumptions that are subject to change.
i
Table of Contents
Trademarks, Service Marks and Copyrights
We own or have rights to certain trademarks, trade names and service marks appearing in this prospectus that are used in our business. This prospectus also contains additional trademarks, trade names and service marks belonging to Chain Bridge or one of its affiliates or another third party. Solely for convenience, the trademarks, trade names and service marks appearing in this prospectus are without the ® and symbols, but such references are not intended to indicate, in any way, that we will not assert, to the fullest extent under applicable law, our rights or the rights of the applicable licensors to these trademarks, trade names and service marks. All trademarks, trade names and service marks appearing in this prospectus are the property of their respective owners.
Basis of Presentation, Historical Performance
All consolidated financial statements presented in this prospectus have been prepared in U.S. dollars in accordance with generally accepted accounting principles in the United States of America (GAAP). All financial information presented in this prospectus is derived from the consolidated financial statements included elsewhere in this prospectus and has been presented in accordance with GAAP.
Any discrepancies included in this prospectus between totals and the sums of the percentages and dollar amounts presented are due to rounding.
Our historical performance is not a guarantee of future results or returns. We make no representation regarding future performance. See Risk Factors.
Certain Defined Terms
Unless we state otherwise or the context otherwise requires, references in this prospectus to:
| | the Bank and Chain Bridge Bank, N.A. refer to Chain Bridge Bank, National Association, a nationally chartered bank; |
| | BHC Act refers to the U.S. Bank Holding Company Act of 1956, as amended; |
| | our Charter refers to our amended and restated certificate of incorporation that will take effect prior to the completion of this offering. The Charter will authorize the establishment of our Class A common stock and Class B common stock and effect the reclassification of each outstanding share of our common stock into 170 shares of Class B common stock; |
| | Class A common stock refers to our Class A common stock, par value $0.01 per share; |
| | Class B common stock refers to our Class B common stock, par value $0.01 per share; |
| | our common stock refers to our Class A common stock and our Class B common stock; |
| | FDIC means the Federal Deposit Insurance Corporation; |
| | Federal Reserve refers to the Board of Governors of the Federal Reserve System; |
| | Fitzgerald Family refers collectively to the lineal descendants of Gerald Francis Fitzgerald, deceased, and Marjorie Gosselin Fitzgerald, their spouses or surviving spouses, children, and grandchildren, and the spouses of their children and grandchildren. These persons include, but are not limited to, Peter Gosselin Fitzgerald, Gerald Francis Fitzgerald, Jr., James Gosselin Fitzgerald, Thomas Gosselin Fitzgerald, Julie Fitzgerald Schauer, Thomas Gosselin Fitzgerald, Jr., and Andrew James Fitzgerald; |
| | OCC means the Office of the Comptroller of the Currency; |
| | old common stock refers to our common stock, par value $1.00 per share, prior to the Reclassification; |
| | the term political organizations means campaign committees, party committees, separate segregated funds (including trade association political action committees (PACs) and corporate PACs), non-connected committees (including independent expenditure-only organizations (Super PACs), Hybrid PACs, and Leadership PACs), and other tax-exempt 527 organizations; |
ii
Table of Contents
| | the Reclassification refers to the reclassification of each outstanding share of our common stock into 170 shares of Class B common stock; |
| | transaction accounts have the meaning as defined in the instructions for the Federal Financial Institutions Examination Council (FFIEC) Consolidated Reports of Condition and Income; and |
| | we, our, us, Chain Bridge, our company and the Company refer to Chain Bridge Bancorp, Inc., a Delaware corporation, and its consolidated subsidiary, Chain Bridge Bank, National Association. |
iii
Table of Contents
This summary highlights selected information contained elsewhere in this prospectus. This summary does not contain all of the information that you should consider before deciding to invest in our Class A common stock. You should read this entire prospectus carefully, including the sections titled Risk Factors and Managements Discussion and Analysis of Financial Condition and Results of Operations and our consolidated financial statements and the related notes thereto, before making an investment decision. This prospectus involves forward-looking statements that involve risks and uncertainties. See Cautionary Note Regarding Forward-Looking Statements for more information.
Our Company
Chain Bridge Bancorp, Inc. is a Delaware-chartered bank holding company and the parent of its wholly-owned subsidiary, Chain Bridge Bank, N.A., a nationally chartered commercial bank with fiduciary powers granted by the OCC. The Company was incorporated on May 26, 2006, and the Bank opened on August 6, 2007. The Company conducts substantially all of its operations through the Bank and has no other subsidiaries.
We offer a range of commercial and personal banking services, including deposits, treasury management, payments, loans, commercial lending, residential mortgage financing, consumer loans, trusts and estate administration, wealth management, and asset custody.
Our mission is to deliver exceptional banking and trust services nationwide, blending financial strength, personalized service, and advanced technology to offer tailored solutions to businesses, non-profit organizations, political organizations, individuals, and families. We aspire to grow responsibly by adapting our personalized service and advanced technology solutions to our clients evolving needs while emphasizing strong liquidity, asset quality, and financial strength. We aim to be recognized for our Strength, Service, Solutions: Your Bridge to Better Banking Nationwide.
As of March 31, 2024, we held total assets of $1.2 billion, including $346.3 million in cash and cash equivalents, of which $338.0 million were interest-bearing reserves held at the Federal Reserve. Our portfolio included $562.8 million in securities available for sale and held to maturity, with $196.2 million of that in U.S. Treasuries. Net loans held for investment, after accounting for deferred fees and allowances, totaled $300.9 million. Our total deposits stood at $1.1 billion, with stockholders equity at $87.6 million. Approximately 91.8% of these deposits were held in transaction accounts. Our loan-to-deposit ratio was 26.9%.
Our Trust & Wealth department oversaw $186.8 million in assets under custody and $80.7 million in assets under management as of March 31, 2024. Additionally, we had $289.2 million in excess deposits placed at other participating banks as one-way sales using the IntraFi Cash Service® (ICS®) program.
1
Table of Contents
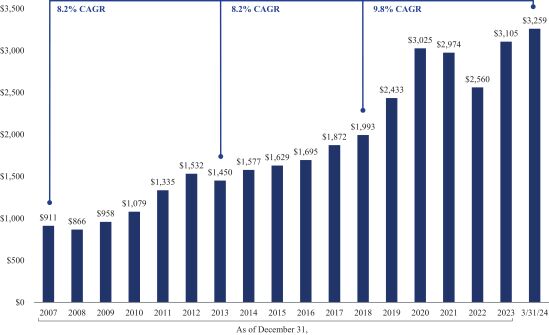
The Company aims to enhance stockholder value while managing risk. One of the metrics that we use to measure our performance is book value per share. The following chart shows that the Company has increased its book value per share at a compound annual growth rate (CAGR) of 8.2% since December 31, 2007, 8.2% from December 31, 2013 and 9.8% from December 31, 2018:
Chain Bridge Bancorp, Inc.
Historical Book Value per Share
Our Regulatory Framework and Banking Philosophy
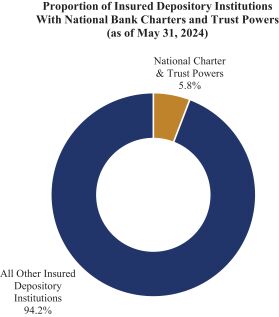
Chain Bridge Bank, N.A. operates under a national charter with full fiduciary powers granted by the OCC. As of March 31, 2024, only approximately 5.8% of insured depository institutions held this combination of charter and powers, according to FDIC data.
Our national charter allows us to offer banking services across state lines without additional state banking licenses. The OCC serves as our primary federal regulator, overseeing our operations and compliance with applicable federal banking laws and regulations. Additionally, our national bank fiduciary powers enable us to offer trust services broadly.
2
Table of Contents
The following chart shows the proportion of insured depository institutions with a national charter and trust powers as of March 31, 2024:
Within this regulatory context, the Banks operations reflect a banking philosophy that emphasizes liquidity, asset quality, and financial strength. This approach guides our asset allocation strategy, risk management practices, and deposit gathering efforts.
Deposit Composition and Strategy
We aim to attract transaction account deposits, particularly from commercial clients. Our investment approach for these funds is intended to be relatively conservative, based on our interpretation of prudent banking practices and current regulatory guidelines.
3
Table of Contents
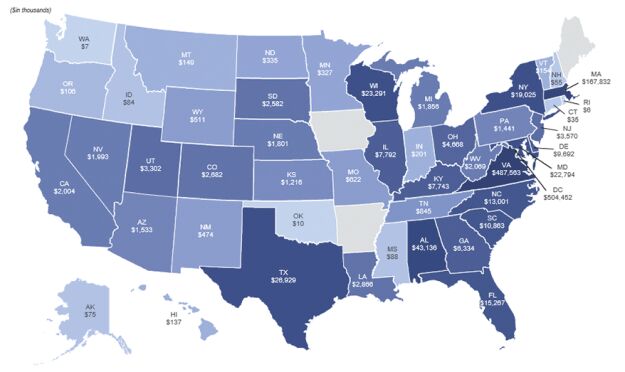
As of March 31, 2024, we served deposit clients in 47 states, the District of Columbia, the U.S. Virgin Islands, and Puerto Rico. Approximately 36% of our total deposits and our one-way sell ICS® deposits originated from the District of Columbia and approximately 35% originated from Virginia. A substantial portion of our deposits, particularly those from outside the District of Columbia and Virginia, came from firms providing treasury and regulatory compliance services for political organizations. The following chart shows the distribution of the Banks total deposits and one-way sell ICS® deposits by dollar amount across the United States as of March 31, 2024:
To support our strategy of attracting commercial transaction account deposits, we emphasize services designed to attract commercial clients who manage high transaction volumes. These services include digital onboarding solutions, image cash letter (ICL) processing and treasury management offerings that accommodate multiple users with customizable approval hierarchies. This focus aligns with our goal of attracting and retaining commercial clients with complex transactional needs.
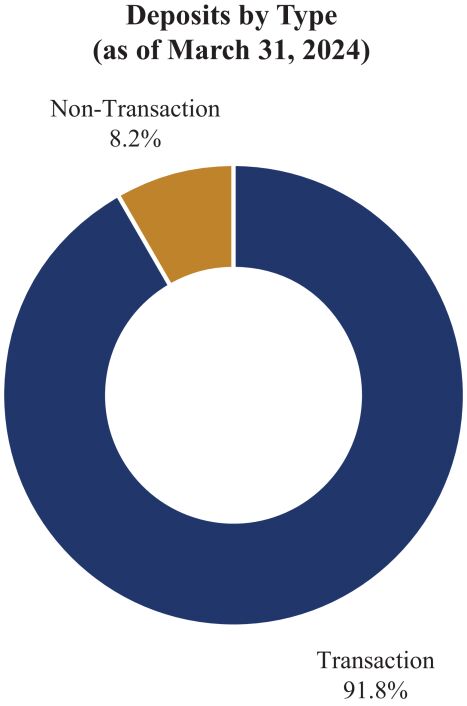
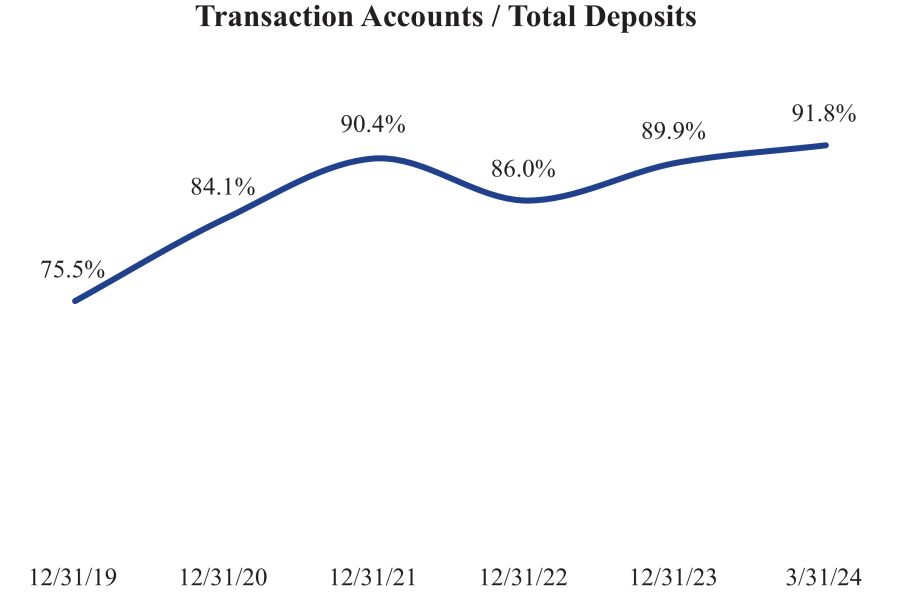
At March 31, 2024, our deposit base included a substantial portion of accounts which we classify as transaction accounts, representing 91.8% of total deposits. For the three months ended March 31, 2024, our cost of funds was 0.35%. The composition of our deposit base and the resulting cost of funds reflect our focus on transaction accounts. Based on our experience, we believe that clients using transaction accounts typically engage more frequently with our banking services and relationship officers compared to those using non-transaction accounts. This potentially increased engagement may lead to higher utilization of our services and aligns with our focus on building strong, long-term client relationships.
4
Table of Contents
The following charts show the composition of the Banks deposits as of March 31, 2024 and the Banks transaction deposits as a percentage of total deposits as of December 31, 2019 through 2023 and March 31, 2024:
|
|
Balance Sheet Strategy and Composition
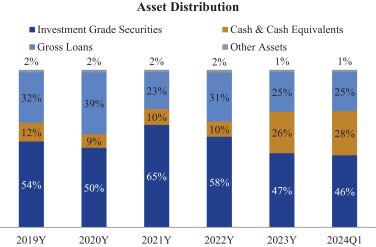
Our balance sheet composition reflects our banking philosophy of emphasizing liquidity, asset quality, and financial strength. Compared to many banks, we aim to allocate a higher proportion of our assets to interest-bearing reserves at the Federal Reserve and to securities that we believe qualify as investment grade. The following chart shows the Companys asset composition as of December 31, 2019 through 2023 and March 31, 2024:
5
Table of Contents
Our asset allocation strategy is designed to balance liquidity maintenance with income generation. We prioritize investments in securities that we believe qualify as investment grade, with a significant portion allocated to U.S. Treasury securities. This approach reflects our focus on managing credit risk while maintaining liquidity. The following chart shows the composition of the Companys securities portfolio as of March 31, 2024:
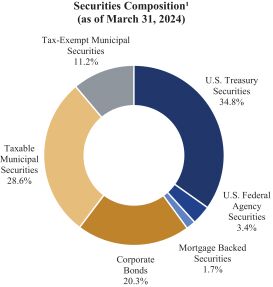
1. Available for sale securities are reported at fair value, and held to maturity securities are reported at amortized cost.
As of March 31, 2024, our liquidity ratiocalculated as the sum of cash and cash equivalents plus unpledged securities classified as investment grade, divided by total liabilitieswas 79.36%. Recent interest rate increases, however, have created a situation where most securities purchased prior to the last year would realize losses if sold before maturity. This dynamic could potentially constrain their actual liquidity in scenarios requiring immediate liquidation.
6
Table of Contents
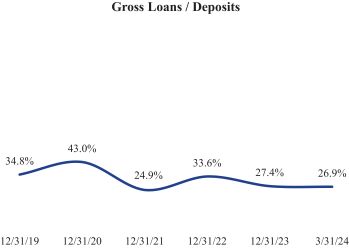
Compared to many other banks, we maintain a lower proportion of assets we consider to be illiquid. This is evident in our lack of bank owned life insurance (BOLI) and our loan-to-deposit ratio of 26.9% as of March 31, 2024. We consider BOLI illiquid due to difficulties in selling and significant early termination penalties, including taxation of gains and a 10% IRS penalty. The following chart shows the Companys loan-to-deposit ratio from December 31, 2019 through March 31, 2024:
Lending Approach and Credit Risk Management
Our lending policies are designed to manage credit risk. Owner-occupied and non-owner-occupied commercial real estate loans, including construction and development loans, represented 20.6% of our gross loans as of March 31, 2024. Our approach has historically resulted in what we consider to be low levels of non-performing assets and charge-offs. As of March 31, 2024, we have reported no non-performing assets since June 30, 2012. The Company has not incurred any charge-offs since the third quarter of 2017 and has incurred a cumulative of $265 thousand of net-charge-offs in its history.
7
Table of Contents
The chart below shows the Banks asset and loan composition as of March 31, 2024:
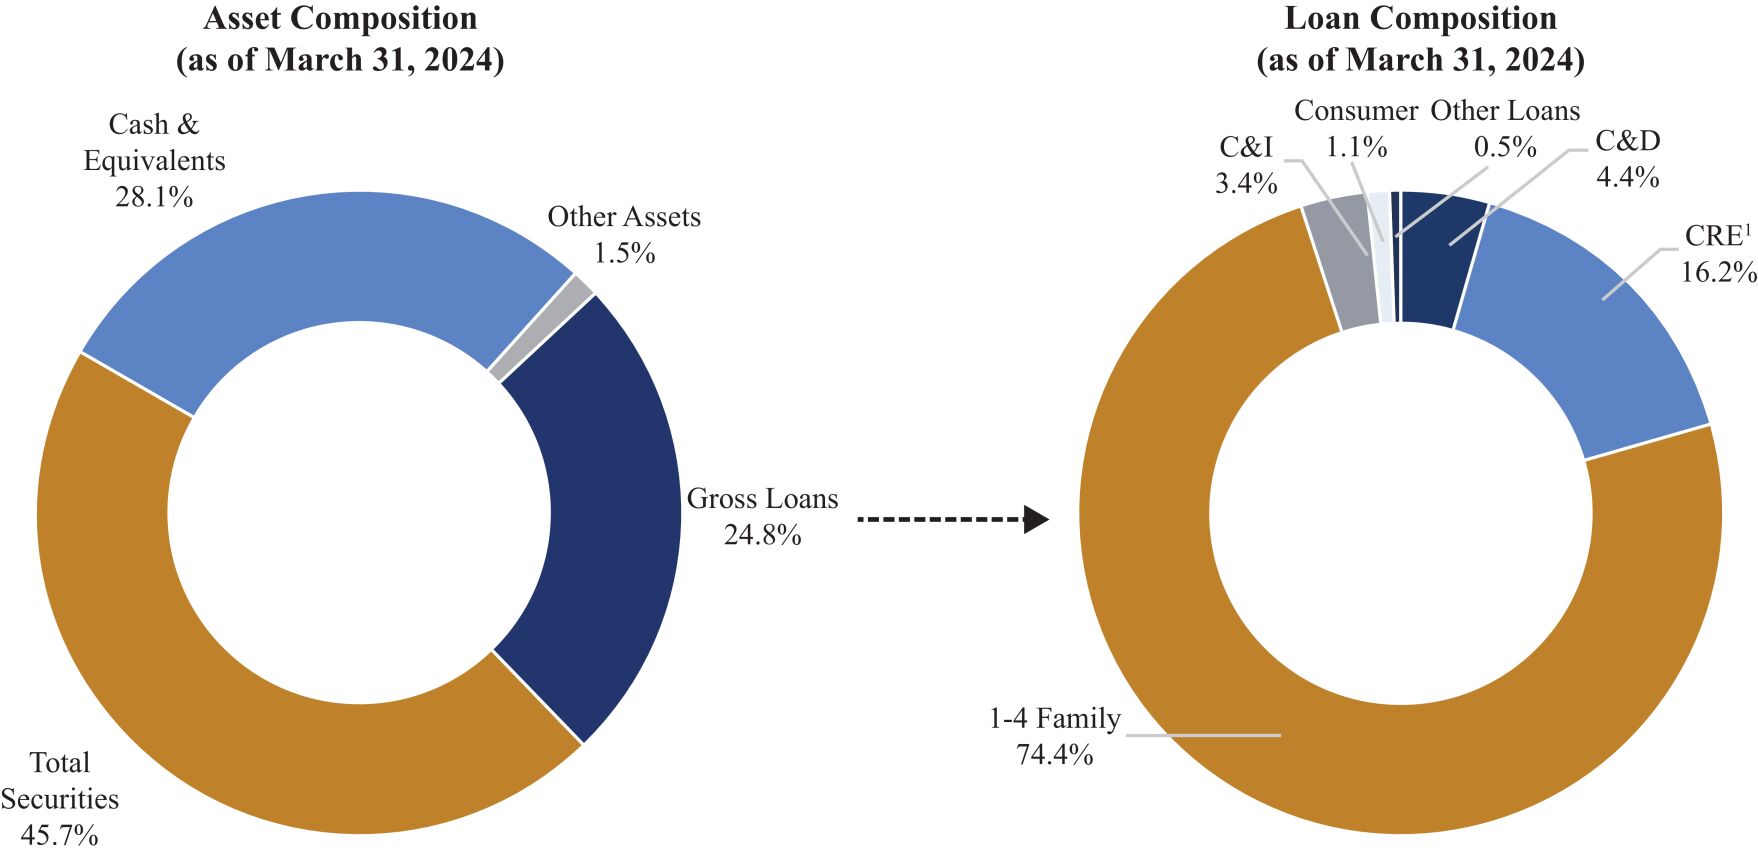
1. C&D loans include construction and development loans and CRE loans include other owner-occupied and non-owner-occupied commercial real estate loans.
Performance Considerations
The foregoing description reflects our banking philosophy and practices as of March 31, 2024. Our banking approach may lead to performance variations under different economic conditions. Our earnings and growth patterns may differ from banks with alternative strategies, particularly in low interest rate environments where our high liquidity may generate comparatively lower returns. The effectiveness of our approach is subject to various factors, including interest rate fluctuations, economic conditions, regulatory changes, and competitive pressures. As such, we may alter our strategies, practices, and asset composition in response to changing circumstances.
Operational Model and Technology Focus
Our model emphasizes attentive, relationship-based service enhanced by technology solutions. This strategy allows the Bank to serve clients efficiently across a wide geographic area while maintaining lower overhead costs compared to some branch-based banking models.
We believe our use of technology allows us to deliver banking services efficiently, with a focus on meeting the needs of commercial clients who manage high transaction volumes. Our treasury management system is designed to handle substantial transaction volumes and accommodate complex organizational structures often found in larger commercial entities. The system features multi-user access with customizable approval hierarchies, allowing clients to tailor the system to their specific operational needs. It also offers integration capabilities with popular accounting software and includes mobile batch check deposit functionality.
Our technology infrastructure includes systems for processing ICLs in X9.37 file formats. This feature allows us to handle electronic deposits efficiently for transaction-intensive clients. The ICL processing can benefit organizations requiring streamlined payment processing. While this service may be particularly useful for certain high-volume clients, we aim to provide efficient banking solutions to a diverse range of commercial enterprises. As payment technologies evolve, we strive to adapt our services to meet changing client needs.
8
Table of Contents
The Bank operates without a branch network. As of March 31, 2024, we maintain our headquarters location but do not operate any branches. This approach offers several potential advantages, including cost-efficiency and broad geographic reach. Since our inception, we have prioritized the digital delivery of our services. Our digital platform enables us to serve clients nationwide without the need for a local physical presence. We allocate the savings from our branch-less model to invest more in our technology infrastructure and human capital.
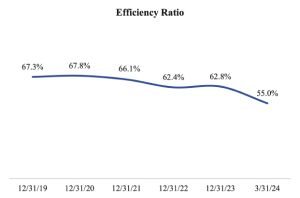
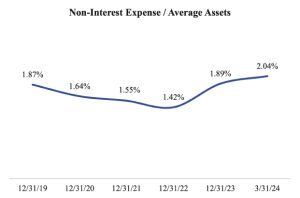
Our model has historically contributed to favorable efficiency metrics. For the three months ended March 31, 2024 (annualized), we reported an efficiency ratio of 55.0%, which is calculated as non-interest expense divided by the sum of net interest income and non-interest income, and a non-interest expense to average assets ratio of 2.04%. The following chart shows the Companys efficiency ratio and ratio of non-interest expense to average assets for the years ended December 31, 2019 through December 31, 2023 and the three months ended March 31, 2024:
|
|
Note: Ratios for the three-months ended March 31, 2024 are presented at an annualized basis.
While we emphasize digital services, we also prioritize attentive personal service and a relationship-based approach. Our relationship officers provide dedicated service to various client segments, including our political organization clients.
Experience in Serving Political Organizations
We focus on clients and business segments where our experience may offer advantages, such as services for political organizations, tailored business, and residential lending and trust and wealth management. Our approach generally favors developing capabilities in less saturated sectors and avoiding highly competitive markets, like commercial real estate or mass-market consumer banking. We have historically grown organically, without relying on marketing, branches, or commissioned sales. Many of our new business opportunities have come through word-of-mouth referrals, and we believe our client-focused approach has contributed to maintaining strong relationships.
As of March 31, 2024, we estimate a majority of our demand deposits were represented by political organizations. We have experience providing deposit services to various political organizations, including:
| | Campaign committees |
| | Party committees (national, state, and local) |
| | Corporate and trade association PACs |
| | Super PACs and Hybrid PACs |
| | Non-committee 527 organizations |
9
Table of Contents
| | Leadership PACs |
| | Joint fundraising committees |
| | Presidential inaugural committees |
Many of our relationship officers are proficient in servicing political organization clients. They offer personalized service and tailored solutions for account management, image cash letter, remote deposit capture, payment processing and treasury management.
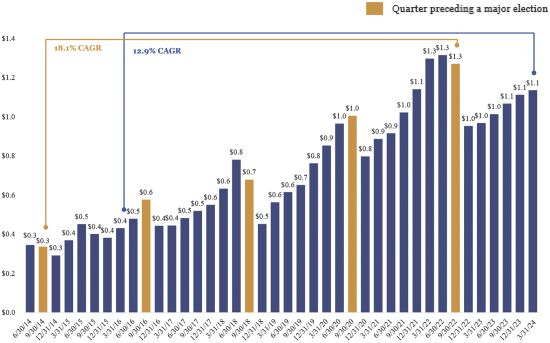
Certain aspects of our deposits fluctuate seasonally. Most of this seasonality comes from commercial depositors, primarily political organizations and their vendors that generate and spend funds around federal election cycles. Federal elections in the United States occur every two years in the fourth quarter, on the first Tuesday after the first Monday in November. Primary elections for federal offices, determined by the state and political parties, typically occur in the first, second, or third quarter of the year. Historically, our total deposits have gradually increased in quarters leading up to a federal election, followed by a sharp decline around the election. Deposit growth tends to be stronger leading up to presidential elections, which occur every four years, compared to biennial midterm elections.
Accordingly, Federal election cycles significantly influence our deposit levels. Certain types of accounts, such as political party committee accounts, maintain funds throughout the election cycle. Other types of accounts, such as campaign committee accounts, are often established for single campaigns and exhibit greater seasonality. In order to mitigate seasonality risk, we aim to maintain a relatively high level of cash reserve deposits at the Federal Reserve.
As of June 2024, the Bank is experiencing increased deposit levels ahead of the November 2024 presidential election, consistent with patterns observed in previous election cycles. As a result of the 2024 presidential election, we expect deposit outflows during the third and fourth quarters of 2024, with the possibility of some outflows extending into early 2025. The precise amount and timing of such outflows remain uncertain and may differ from historical cycles.
10
Table of Contents
The following graph illustrates the seasonality of the Companys deposits from June 30, 2014 through March 31, 2024:
Total Deposit Seasonality
(dollars in billions)
Federal election cycles also impact revenue-generating activities, such as wire transfers, payments, check processing, debit card usage, and treasury management services, which also increase during this period until the end of the election cycle. Additionally, deposits from trade associations may exhibit seasonality. These associations typically bill their members annually for dues and spend the funds down over the course of the year.
11
Table of Contents
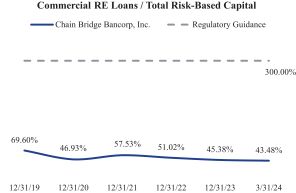
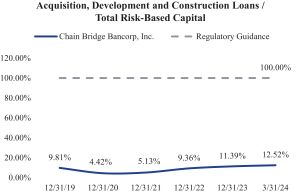
Loan Portfolio and Credit Quality
Our loan portfolio is less concentrated in commercial real estate (CRE) loans compared to that of many other banks. As of March 31, 2024, the Banks non-owner occupied CRE represented 43.5% of the Banks total risk-based capital compared to the regulatory guidance threshold of 300% for CRE concentration limits. Additionally, the Banks acquisition, development, and construction (ADC) loans were 12.5% of our total risk-based capital, compared to the regulatory guidance threshold of 100%. The following chart shows the Banks CRE and ADC loans each as a percentage of the Banks total risk-based capital from December 31, 2019 through March 31, 2024:
|
|
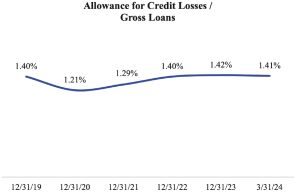
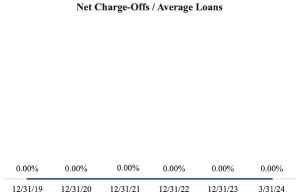
Our lending policies are designed to limit credit risk by evaluating borrower creditworthiness with a focus on equity, collateral, personal guarantees and capacity to service debt. This strategy has historically helped mitigate credit risk. The Companys allowance for credit losses on loans as a percentage of gross loans was 1.41% at March 31, 2024. As of March 31, 2024, we have reported no non-performing assets since June 2012. The Company has not incurred any charge-offs since the third quarter of 2017 and has incurred a cumulative of $265 thousand of net-charge-offs in its history. The charts below show the ratio of the Companys net charge-offs to average loans and the ratio of the Companys allowance for credit losses on loans to gross loans for the years ended December 31, 2019 to 2023 and the three months ended March 31, 2024:
|
|
Note: Ratios for the three-months ended March 31, 2024 are presented at an annualized basis.
12
Table of Contents
Profitability and Stockholder Returns
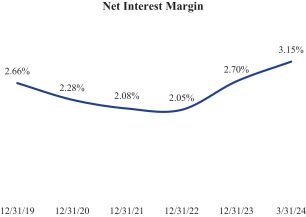
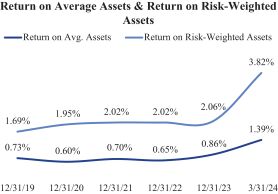
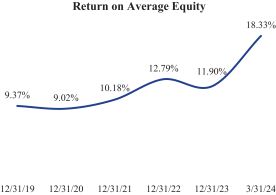
Our profits are largely a function of the size of our deposits, the gross rate of return earned from investing those deposits, and our costs. Our strategy focuses on increasing our transaction accounts, enhancing the return on our investments, and reducing costs, while mitigating risk and maintaining liquidity, asset quality, and capital strength. We believe we have developed an efficient operating platform by leveraging technology and providing personal service. Rising interest rates since March 2022 have positively impacted our net interest margin. Over the twelve months ended March 31, 2024, the Company earned net income of $11.7 million, or $583 per share.
Our branch-less strategy contributes to lower expense levels compared to many banks. For the three months ended March 31, 2024, our non-interest expense as a percentage of average assets was 2.0%, and our efficiency ratio was 55.0% on an annualized basis. The Companys net interest margin, return on average assets, return on average risk-weighted assets, and return on average equity have increased during recent periods, as illustrated in the charts below.
|
|
Note: Ratios for the three-months ended March 31, 2024 are presented at an annualized basis.
As of June 2024, the Bank is experiencing increased deposit levels ahead of the November 2024 presidential election, consistent with patterns observed in previous election cycles. As a result of the 2024 presidential election, we expect deposit outflows during the third and fourth quarters of 2024, with the possibility of some outflows extending into early 2025. These outflows are expected to adversely affect our net interest margin, return on average assets, return on average risk-weighted assets, and return on average equity. The precise amount and timing of such outflows, as well as the effect of such outflows on our net interest margin, return on average assets, return on average risk-weighted assets, and return on average equity, remain uncertain and may differ from historical cycles.
13
Table of Contents
Our Strategy
We aim to build on our established strengths while maintaining what we believe to be a relatively conservative banking approach. Our strategy focuses on markets where we believe we can offer unique value, rather than competing in large, crowded sectors. At the core of our strategy is expanding our market share in specialized political organization deposit services. Political organizations constitute a significant portion of our client base, and the number of political organizations has grown in recent election cycles, according to Federal Election Commission data. We also hold a notable position with corporate and trade association PACs, which we plan to reinforce. We may explore expansion in related areas that align with our core strengths.
We focus on clients and business segments where our experience may offer advantages. Such segments include political organizations, customized business and residential lending, and trust and wealth management. We usually avoid highly competitive areas like commercial real estate lending or mass-market consumer banking.
Our large base of transaction account deposits assists us in managing our earning assets. During periods of high seasonal deposits, we have used the ICS® network to manage our Tier 1 leverage ratio. If we gain more capital to support balance sheet growth, we plan to focus on increasing our share in our target markets.
Our strategy depends on many factors, including market conditions, regulations, and how well we execute our plans. See Risk Factors for a discussion of these and other risks. Further, our strategy may change as circumstances shift, and we cannot guarantee future success. We regularly review our approach to balance growth opportunities with risk management.
Competition
The banking industry is highly competitive. We compete for loans, deposits, capital and fiduciary services with other banks and other kinds of financial institutions and enterprises, such as securities firms, insurance companies, savings and loan associations, credit unions, mortgage brokers, and private lenders, many of which have substantially greater resources or are subject to less stringent regulations. We primarily compete for commercial deposit accounts with the countrys largest banks, which have national reach, and regional banks, some of which also have national reach and advanced technology and treasury management platforms for commercial customers. We also compete with other state, national and international financial institutions located in our market areas as well as savings associations, savings banks and credit unions for loans and retail deposits. Competition among providers of financial products and services continues to increase, with consumers having the opportunity to select from a growing variety of traditional and nontraditional alternatives, including fintech companies, which have grown significantly in recent years. The ability of non-banking financial institutions to provide services previously limited to commercial banks has intensified competition. See Risk FactorsOther Risks Related to Our BusinessThere is no assurance that the Bank will be able to compete successfully with others for its business.
Our Potential Competitive Strengths
Our business model may offer the following potential competitive strengths. While we believe these aspects of our business model demonstrate competitive strengths, our business model also involves certain risks, as discussed in the Risk Factors section.
Regulatory Framework and Banking Philosophy
The Bank operates under a national bank charter with full fiduciary powers, a distinction shared by only a small percentage of U.S. commercial banks. As a national bank, the Bank is primarily regulated by the OCC, which provides us with a unified regulatory framework that may enhance operational efficiency and allow for consistent service delivery across state lines.
14
Table of Contents
Our banking philosophy is reflected in our asset allocation, liquidity position, and risk management practices. Regular examinations by the OCC provide additional oversight of our operations and risk management processes. The combination of our national charter and our positioning may help create a strong foundation for our banking and fiduciary services.
Deposits and Proficiency in Serving Political Organizations
We provide deposit services to a wide range of political organizations, including campaign committees, party committees, PACs, Super PACs, and other tax-exempt 527 organizations. These entities operate within a unique regulatory environment and have specialized operational needs. We organize our associate teams based on their familiarity with specific types of political clients and their unique requirements. This approach is designed to offer attentive relationship management that addresses the complex banking needs of political organizations, such as multi-fund deposit capabilities and managing cyclical cash flow patterns. Our teams work to understand and anticipate the specific challenges faced by political organizations in their banking activities, aiming to provide efficient and effective solutions to our clients. We believe our experience in serving political organizations may contribute to our competitive position in the banking industry.
Technology-Oriented Approach
Since our founding, we have prioritized the use of digital technologies in our operations. This approach has allowed us to expand without relying on a costly branch network. As of March 31, 2024, approximately 29% of our total deposits and one-way sell ICS® deposits originated from outside the District of Columbia and Virginia.
Our technology-oriented strategy aims to provide commercial clients with convenient access to banking services and may contribute to operational efficiencies. For example, we emphasize digital onboarding processes and managing high volumes of deposits using ICL files formatted as X9.37 files, which allows third-party vendors to digitally scan and transmit large volumes of payment images and data for deposit processing. We believe that our transaction-intensive clients may benefit from this service, and that our experience in providing ICL services may differentiate us from our competitors.
We also strive to stay informed about developments in financial technology that could be relevant to our business. While we believe this approach offers certain benefits, the effectiveness and implementation of any banking strategy can vary based on numerous factors, including market conditions, regulatory changes, and competitive pressures.
Client Service Approach
We focus on providing attentive personal service and enhanced accessibility to our clients. Our approach centers on offering direct access to dedicated relationship teams who strive to understand each clients specific needs and industry context. We assign specialized teams to serve specific client segments, aiming to provide knowledgeable and contextual support. These teams endeavor to offer multiple channels for client communication and work towards prompt responses to inquiries. Our goal is to understand individual client needs and tailor our services accordingly, within the scope of our offerings. We believe this approach may enhance the banking experience for many of our clients.
Experienced Leadership
Our executive management team comprises banking professionals with extensive industry experience. Peter G. Fitzgerald, our Chairman, founded the Company in May 2006, drawing on his familys multi-generational background in banking. John J. Brough, our Chief Executive Officer, and David M. Evinger, our President, have been with the Company since July 2006 and have overseen the Banks operations since its inception on August 6, 2007.
15
Table of Contents
Our Board includes individuals with diverse professional backgrounds, bringing expertise in areas such as auditing, risk management, information technology, cybersecurity, governance, credit risk management, and trusts and estates.
Implications of Being an Emerging Growth Company and a Smaller Reporting Company
We are an emerging growth company as defined in Section 2(a)(19) of the Securities Act of 1933, as amended (the Securities Act), as modified by the Jumpstart Our Business Startups Act of 2012 (the JOBS Act). As an emerging growth company, we are eligible to take advantage of certain exemptions from various reporting requirements that are applicable to other public companies that are not emerging growth companies, including, but not limited to: (1) presenting only two years of audited financial statements in addition to any required unaudited interim financial statements with correspondingly reduced Managements Discussion and Analysis of Financial Condition and Results of Operations disclosure in this prospectus; (2) not being required to comply with the auditor attestation requirements of Section 404 of the Sarbanes-Oxley Act of 2002 (the Sarbanes-Oxley Act); (3) having reduced disclosure obligations regarding executive compensation; (4) being exempt from the requirements to hold a non-binding advisory vote on executive compensation or to seek stockholder approval of any golden parachute payments not previously approved; and (5) not being required to adopt certain accounting standards applicable to public companies until those standards would otherwise apply to private companies.
Although we are still evaluating our options under the JOBS Act, we may take advantage of some or all of the reduced regulatory and reporting obligations that will be available to us so long as we qualify as an emerging growth company, and thus the level of information we provide may be different than that of other public companies. If we do take advantage of any of these exemptions, some investors may find our securities less attractive, which could result in a less active trading market for our Class A common stock, and the price of our Class A common stock may be more volatile. As an emerging growth company under the JOBS Act, we are permitted to delay the adoption of new or revised accounting pronouncements applicable to public companies until such pronouncements are made applicable to private companies.
We do not intend to take advantage of this extended transition period, which means that the financial statements included in this prospectus, as well as any financial statements that we file in the future, will be subject to all new or revised accounting standards generally applicable to public companies. The decision not to take advantage of the extended transition period is irrevocable.
We could remain an emerging growth company until the earliest to occur of: (1) the end of the fiscal year following the fifth anniversary of this offering; (2) the first fiscal year after our annual gross revenues are $1.235 billion or more; (3) the date on which we have, during the previous three-year period, issued more than $1.0 billion in non-convertible debt securities; or (4) the date on which we are deemed to be a large accelerated filer under the Securities Exchange Act of 1934, as amended (the Exchange Act). We have taken advantage of reduced disclosure regarding executive compensation arrangements and the presentation of certain historical financial information in this prospectus, and we may choose to take advantage of some but not all of these reduced disclosure obligations in future filings. If we do, the information that we provide to our stockholders may be different from what you might get from other public companies in which you hold stock.
We are also a smaller reporting company, as defined in the Exchange Act. Even after we no longer qualify as an emerging growth company, we may still qualify as a smaller reporting company, which would allow us to continue taking advantage of many of the same exemptions from disclosure requirements, including reduced disclosure obligations regarding executive compensation in our periodic reports and proxy statements. In addition, for so long as we continue to qualify as a non-accelerated filer, we will not be required to comply with the auditor attestation requirements of Section 404(b) of the Sarbanes-Oxley Act.
16
Table of Contents
Summary Risk Factors
An investment in shares of our Class A common stock involves substantial risks and uncertainties. Some of the more significant challenges and risks relating to an investment in our Company include, among other things, the following:
| | Changes in interest rates may adversely affect our earnings and financial condition. |
| | Increases in interest rates could result in losses on our investment securities portfolio. |
| | If the average interest rate we pay on our deposits increases, our cost of funds would rise. |
| | Liquidity risks could adversely affect our business, financial condition and results of operations. |
| | Loss of deposits could increase our funding costs or require us to sell assets or borrow. |
| | Most of our deposits come from a relatively small number of commercial relationships. |
| | Our demand deposits are concentrated in political organizations, which can vary significantly in volume due to seasonality or changes in political activity or campaign finance laws. |
| | Our demand deposits are concentrated in uninsured deposits. |
| | Our liquidity is dependent on dividends from the Bank. |
| | We may need to raise additional capital in the future, and such capital may not be available when needed or at all. |
| | Our results of operations and financial condition would be adversely affected if the Banks allowance for credit losses is insufficient to absorb actual losses or needs to be increased. |
| | Losses related to a single large loan could have a significant impact on the Banks financial condition and results of operations. |
| | The Bank relies upon independent appraisals to determine the value of the real estate that secures a significant portion of its loans, and the values indicated by such appraisals may not be realizable if the Bank is compelled to foreclose upon such loans. |
| | Our business may be adversely affected by conditions in the financial markets and economic conditions generally. |
| | The geographic concentration of our business in the Washington, D.C. metropolitan area makes our business highly susceptible to local economic conditions and reductions or changes in government spending. |
| | Our investment securities portfolio exposes us to risks beyond our market area. |
| | Our significant investment in securities held to maturity exposes us to risks that may adversely affect our business, financial condition or results of operations. |
| | There can be no assurance that we will be able to maintain or increase our current levels of transaction accounts, non-interest-bearing demand deposits, and level of profitability or growth. |
| | We place a significant portion of our clients deposits with other banks through the ICS® network, which exposes us to risks that may adversely affect our business, financial condition or results of operations. |
| | Our Trust & Wealth Department exposes us to certain risks and there can be no assurance the department will contribute meaningfully to our revenues or become profitable on a standalone basis. |
| | We may be adversely affected by changes in the actual or perceived soundness or condition of other financial institutions. |
| | There is no assurance that the Bank will be able to compete successfully with others for its business. |
| | We could fail to attract, retain or motivate skilled and qualified personnel, including our senior management, other key employees or directors, which could adversely affect our business. |
| | Certain clients, including our political organization clients, may be subject to, and are particularly sensitive to, negative publicity, which may subject us to enhanced reputational risk. |
| | Fulfilling our public company financial reporting and other regulatory obligations and transitioning to a public company will be expensive and time consuming and may strain our resources. |
| | We are subject to operational risk, which could adversely affect our business and reputation and create material legal and financial exposure. |
| | The occurrence of fraudulent activity, breaches or failures of our information security controls or cybersecurity-related incidents could have a material adverse effect on our business, financial condition and results of operations. |
| | We also face risks related to cyberattacks and other security breaches involving external, third-party vendors and counterparties. |
| | Our operations rely on certain external vendors, and our use of these vendors is subject to increasing regulatory requirements and attention. |
17
Table of Contents
| | The development and use of artificial intelligence present risks and challenges that may adversely impact our business. |
| | We depend on the accuracy and completeness of information about clients and counterparties. |
| | Our reliance on accounting estimates and risk management framework may not always prevent or mitigate risks effectively, leading to potential differences between actual results and our forecasts. |
| | Government regulation significantly affects our business and may result in higher costs and lower stockholder returns. |
| | Litigation and regulatory actions, including possible enforcement actions, could subject us to significant fines, penalties, judgments, or restrictions on our business activities. |
| | The Banks primary regulator has broad powers to place limitations on the conduct of a banks business, or to close an institution. |
| | We face significant risks of noncompliance and potential enforcement actions under the Bank Secrecy Act and other anti-money laundering statutes and regulations. |
| | The Bank is subject to numerous fair and responsible banking laws designed to protect consumers, and failure to comply with these laws could lead to a wide variety of sanctions. |
| | We engage in lending secured by real estate and may be forced to foreclose on the collateral and own the underlying real estate, subjecting us to potential costs, risks and consumer protection laws. |
| | Any violation of laws regarding, or incidents involving, the privacy, information security and protection of personal, confidential or proprietary information could damage our reputation and otherwise adversely affect our business. |
| | Increases in FDIC insurance premiums could adversely affect our earnings and results of operations. |
| | The Federal Reserve may require us to commit capital resources to support the Bank at a time when our resources are limited, which may require us to borrow funds or raise capital on unfavorable terms. |
| | Changes in our accounting policies or in accounting standards could materially affect how we report our financial results and condition. |
| | The dual class structure of our common stock has the effect of concentrating voting power with the holders of our Class B common stock, including the members of the Fitzgerald Family, which will limit or preclude your ability to influence corporate matters. |
| | Members of the Fitzgerald Family and other holders of Class B common stock could aggregate their holdings and sell a controlling interest in us to a third party in a private transaction. |
| | Conflicts of interest and other disputes may arise between the members of the Fitzgerald Family and us that may be resolved in a manner unfavorable to us and our other stockholders. |
| | The multi-class structure of our common stock may adversely affect the trading market for our Class A common stock. |
| | No prior public market exists for our Class A common stock, and one may not develop. |
| | The market price of shares of our common stock may be volatile or may decline regardless of our operating performance, which could cause the value of your investment to decline. |
| | Investors in this offering will experience immediate and substantial dilution of $ per share. |
| | We have broad discretion in the use of the net proceeds to us from this offering, and our use of these proceeds may not yield a favorable return on your investment. |
| | We may issue shares of preferred stock in the future, which could adversely affect holders of our common stock and depress the price of our common stock. |
| | An investment in our Class A common stock is not an insured deposit. |
| | If the Bank fails or is put into receivership or conservatorship by the FDIC and its primary regulator, investors will likely lose their entire investment in the Company. |
| | Future sales of our Class A common stock in the public market, including any sales by members of the Fitzgerald Family, could lower our stock price, and any increase in shares may dilute your ownership in us. |
In addition, an investment in shares of our Class A common stock involves certain risks related to our Class A common stock, including related to the lack of a prior public market, the market price, dilution, our use of the net proceeds from this offering, our ability to issue preferred stock, our dividend policy, our status as an emerging growth company and smaller reporting company, analyst research and recommendations, factors that may discourage or delay acquisition attempts for us, and the exclusive forum provisions in our Charter and Bylaws. Please see Risk Factors for a discussion of these and other factors you should consider before making an investment in shares of our Class A common stock.
18
Table of Contents
Dual Class Structure and Reclassification
Prior to the completion of this offering, our Charter will become effective, which will authorize the establishment of two classes of common stock: Class A common stock and Class B common stock. The rights of Class A common stock and Class B common stock are identical in all respects, except with respect to voting and conversion rights. Each share of Class A common stock is entitled to one vote and each share of Class B common stock is entitled to 10 votes. Each share of Class B common stock is convertible at any time into one share of Class A common stock and is automatically convertible into one share of Class A common stock in connection with certain transfers and other events. See Description of Capital Stock. Upon the effectiveness of the Charter, each outstanding share of our old common stock will be reclassified into 170 shares of Class B common stock (the Reclassification). As of the date of this prospectus, members of the Fitzgerald Family, in the aggregate, beneficially own 50.69% of the outstanding shares of our old common stock.
Following the Reclassification and the completion of this offering, assuming no conversions of shares of Class B common stock into shares of Class A common stock, holders of our outstanding Class B common stock will hold % (or % assuming the underwriters exercise their option to purchase additional shares of our Class A common stock from us in full) of the combined voting power with respect to all of the outstanding shares of our common stock, with the members of the Fitzgerald Family in the aggregate beneficially owning % (or % assuming the underwriters exercise their option to purchase additional shares of our Class A common stock from us in full) of the combined voting power. The dual class structure of our common stock will have the effect of concentrating voting power with the holders of our Class B common stock, including the members of the Fitzgerald Family, which will limit or preclude your ability to influence corporate matters, including the election of our board of directors (the Board). While the combined voting power of the shares held by members of the Fitzgerald Family, when aggregated, will exceed 50%, the members of the Fitzgerald Family are not party to any voting agreement or other arrangement or understanding regarding the voting of our shares and have no present intention to act together for any purpose. Our Charter will provide certain protections for the holders of Class A common stock. See Description of Capital Stock and Risk Factors Risks Related to Our Dual Class Common Stock Structure.
Our Corporate Information
Our principal executive office is located at 1445-A Laughlin Avenue, McLean, Virginia 22101. Our telephone number is (703) 748-2005, and our website address is http://chainbridgebank.com. The information contained on our website is not a part of, or incorporated by reference into, this prospectus.
19
Table of Contents
The Offering
| Class A common stock outstanding before this offering |
No shares of Class A common stock |
| Class A common stock offered by us |
shares of Class A common stock |
| Option to purchase additional shares |
We have granted the underwriters the right to purchase up to an additional shares of our Class A common stock within 30 days from the date of this prospectus. |
| Class A common stock to be outstanding immediately following this offering |
shares of Class A common stock (or shares if the underwriters exercise their option to purchase additional shares in full). |
| Class B common stock to be outstanding immediately following this offering |
4,568,920 shares of Class B common stock |
| Use of proceeds |
We estimate that our net proceeds from this offering will be approximately $ million (or approximately $ million if the underwriters elect to exercise in full their option to purchase additional shares from us), after deducting underwriting discounts and commissions and estimated offering expenses, based on an assumed initial public offering price of $ per share (the midpoint of the estimated price range set forth on the cover page of this prospectus). We intend to use the net proceeds from this offering for general corporate purposes, which may include repaying debt, supporting continued organic deposit growth and funding potential strategic expansion while maintaining our targeted regulatory capital levels. See Use of Proceeds. |
| Voting rights |
Each share of our Class A common stock entitles its holder to one vote per share, representing an aggregate of % (or % if the underwriters elect to exercise in full their option to purchase additional shares from us) of the combined voting power of our outstanding shares of common stock upon the completion of this offering (and assuming no conversion of outstanding shares of our Class B common stock). |
| Each share of our Class B common stock entitles its holder to 10 votes per share, representing an aggregate of % (or % if the underwriters elect to exercise in full their option to purchase additional shares from us) of the combined voting power of our outstanding shares of common stock upon the completion of this |
20
Table of Contents
| offering (and assuming no conversion of outstanding shares of our Class B common stock). |
| See Description of Capital Stock. |
| Dividend policy |
We do not currently intend to pay cash dividends on our Class A common stock in the foreseeable future. Any determination to change our dividend policy will be at the discretion of our Board and will depend on many factors, including the financial condition, earnings and liquidity requirements of the Company and the Bank, regulatory constraints, corporate law and contractual restrictions, and any other factors that our Board deems relevant in making such a determination. Our ability to pay dividends is subject to restrictions under applicable banking laws, regulations and policies established by the Federal Reserve. In addition, dividends from the Bank are the principal source of funds for the payment of dividends on our stock. The Bank is subject to certain restrictions under banking laws, regulations and policies of the OCC that may limit its ability to pay dividends to us. See Dividend Policy and Dividends for more information. |
| Preemptive and other rights |
Purchasers of our Class A common stock sold in this offering will not have any preemptive rights. |
| Listing |
We intend to apply to list our Class A common stock on The New York Stock Exchange (the NYSE), under the symbol CBNA. |
| Risk factors |
Investing in our Class A common stock involves significant risks. See Risk Factors beginning on page 26 for a discussion of certain risks that you should consider before deciding to invest in our Class A common stock. |
Unless we state otherwise or the context otherwise requires, all information in this prospectus:
| | gives effect to the Reclassification transactions described above under Summary Dual Class Structure and Reclassification; |
| | assumes no conversions of shares of our Class B common stock into shares of our Class A common stock prior to or immediately following the completion of this offering; |
| | assumes no exercise by the underwriters of their option to purchase up to an additional shares of Class A common stock from us; and |
| | assumes that the Class A common stock to be sold in this offering is sold at an initial public offering price of $ per share, which is the midpoint of the estimated price range set forth on the cover page of this prospectus. |
21
Table of Contents
Selected Financial Data
The tables below summarize Chain Bridge Bancorp, Inc.s financial information for the periods indicated. The selected financial information included herein at or for the three months ended March 31, 2024 and 2023 have been derived from our unaudited consolidated financial statements included elsewhere in this prospectus. The selected historical balance sheet data as of December 31, 2023 and 2022 and the selected historical income statement data for the years ended December 31, 2023 and 2022 have been derived from our audited consolidated financial statements included elsewhere in this prospectus. The selected historical balance sheet data as of December 31, 2021, 2020 and 2019 and the selected historical income statement data for the years ended December 31, 2021, 2020 and 2019 have been derived from our audited consolidated financial statements not included in this prospectus. You should read the following selected historical consolidated financial and other data in conjunction with our consolidated financial statements and related notes and the sections entitled Managements Discussion and Analysis of Financial Condition and Results of Operations and Capitalization included elsewhere in this prospectus. Our historical results are not necessarily indicative of the results to be expected in any future period.
| At or for the Three Months Ended March 31, |
At or for the Year Ended December 31, |
|||||||||||||||||||||||||||
| 2024 | 2023 | 2023 | 2022 | 2021 | 2020 | 2019 | ||||||||||||||||||||||
| (Dollars in thousands except per share data) | ||||||||||||||||||||||||||||
| Statement of Operations Data: |
||||||||||||||||||||||||||||
| Interest and dividend income |
$ | 9,699 | $ | 7,343 | $ | 31,789 | $ | 27,384 | $ | 20,689 | $ | 23,125 | $ | 20,540 | ||||||||||||||
| Interest expense |
907 | 882 | 4,046 | 1,283 | 301 | 1,078 | 3,349 | |||||||||||||||||||||
|
|
|
|
|
|
|
|
|
|
|
|
|
|
|
|||||||||||||||
| Net interest income |
8,792 | 6,461 | 27,743 | 26,101 | 20,388 | 22,047 | 17,191 | |||||||||||||||||||||
|
|
|
|
|
|
|
|
|
|
|
|
|
|
|
|||||||||||||||
| (Recapture of) provision for credit losses |
(194 | ) | 775 | 641 | 822 | (530 | ) | 473 | 74 | |||||||||||||||||||
| Non-interest income |
1,648 | 283 | 3,281 | 3,110 | 3,277 | 2,036 | 1,270 | |||||||||||||||||||||
| Non-interest expense |
5,741 | 4,715 | 19,477 | 18,226 | 15,634 | 16,325 | 12,420 | |||||||||||||||||||||
|
|
|
|
|
|
|
|
|
|
|
|
|
|
|
|||||||||||||||
| Net income before taxes |
4,893 | 1,254 | 10,906 | 10,163 | 8,561 | 7,285 | 5,967 | |||||||||||||||||||||
| Income tax expense |
976 | 206 | 2,075 | 1,882 | 1,512 | 1,285 | 1,081 | |||||||||||||||||||||
|
|
|
|
|
|
|
|
|
|
|
|
|
|
|
|||||||||||||||
| Net income |
$ | 3,917 | 1,048 | $ | 8,831 | $ | 8,281 | $ | 7,049 | $ | 6,000 | $ | 4,886 | |||||||||||||||
|
|
|
|
|
|
|
|
|
|
|
|
|
|
|
|||||||||||||||
| Per Share Data and Shares Outstanding: |
||||||||||||||||||||||||||||
| Earnings per common share, basic and diluted(1) |
$ | 145.74 | $ | 39.01 | $ | 328.64 | $ | 324.26 | $ | 301.59 | $ | 256.74 | $ | 209.07 | ||||||||||||||
| Book value per common share at period end |
$ | 3,259.44 | $ | 2,700.54 | $ | 3,104.98 | $ | 2,559.65 | $ | 2,973.63 | $ | 3,025.30 | $ | 2,433.27 | ||||||||||||||
| Weighted average common shares (basic and diluted)(1) |
26,874 | 26,872 | 26,872 | 25,539 | 23,372 | 23,372 | 23,372 | |||||||||||||||||||||
| Common shares outstanding at period end |
26,876 | 26,872 | 26,872 | 26,872 | 23,372 | 23,372 | 23,372 | |||||||||||||||||||||
| Balance Sheet Data: |
||||||||||||||||||||||||||||
| Assets |
$ | 1,233,771 | $ | 1,049,066 | $ | 1,205,202 | $ | 1,030,684 | $ | 1,218,154 | $ | 881,507 | $ | 829,186 | ||||||||||||||
| Cash and cash equivalents |
346,305 | 121,182 | 316,767 | 98,663 | 123,877 | 76,221 | 99,059 | |||||||||||||||||||||
| Loans, net of allowance for credit losses |
300,943 | 314,089 | 299,825 | 315,711 | 280,260 | 338,486 | 261,823 | |||||||||||||||||||||
| Securities available for sale, at fair value |
254,880 | 279,230 | 258,114 | 279,596 | 791,246 | 444,274 | 450,878 | |||||||||||||||||||||
22
Table of Contents
| At or for the Three Months Ended March 31, |
At or for the Year Ended December 31, |
|||||||||||||||||||||||||||
| 2024 | 2023 | 2023 | 2022 | 2021 | 2020 | 2019 | ||||||||||||||||||||||
| (Dollars in thousands except per share data) | ||||||||||||||||||||||||||||
| Securities held to maturity, at carrying value, net of allowance for credit losses |
307,953 | 311,115 | 308,058 | 312,567 | | | | |||||||||||||||||||||
| Goodwill |
| | | | | | | |||||||||||||||||||||
| Identifiable intangible assets |
| | | | | | | |||||||||||||||||||||
| Liabilities |
$ | 1,146,170 | $ | 976,497 | $ | 1,121,765 | $ | 961,901 | $ | 1,148,654 | $ | 810,800 | $ | 772,316 | ||||||||||||||
| Deposits |
1,135,755 | 967,953 | 1,112,025 | 952,954 | 1,140,872 | 797,750 | 762,376 | |||||||||||||||||||||
| Short-term borrowings |
5,000 | 5,000 | 5,000 | 5,000 | 5,000 | 9,000 | 7,300 | |||||||||||||||||||||
| Stockholders equity |
87,601 | 72,569 | 83,437 | 68,783 | 69,500 | 70,707 | 56,870 | |||||||||||||||||||||
| Common Stock, $1.00 par value |
27 | 27 | 27 | 27 | 23 | 23 | 23 | |||||||||||||||||||||
| Additional paid-in-capital |
38,295 | 38,283 | 38,283 | 38,283 | 27,787 | 27,787 | 27,787 | |||||||||||||||||||||
| Retained earnings |
60,609 | 48,840 | 56,692 | 48,121 | 39,839 | 32,790 | 26,790 | |||||||||||||||||||||
| Accumulated other comprehensive loss (income) |
(11,330 | ) | (14,581 | ) | (11,565 | ) | (17,648 | ) | 1,851 | 10,107 | 2,270 | |||||||||||||||||
| Performance Ratios: |
||||||||||||||||||||||||||||
| Return on average equity(2) |
18.33 | % | 6.00 | % | 11.90 | % | 12.79 | % | 10.18 | % | 9.02 | % | 9.37 | % | ||||||||||||||
| Return on average assets(2) |
1.39 | % | 0.42 | % | 0.86 | % | 0.65 | % | 0.70 | % | 0.60 | % | 0.73 | % | ||||||||||||||
| Return on average risk-weighted assets(2)(3) |
3.82 | % | 0.96 | % | 2.06 | % | 2.02 | % | 2.02 | % | 1.95 | % | 1.69 | % | ||||||||||||||
| Yield on average interest-earning assets(2)(4) |
3.47 | % | 2.96 | % | 3.10 | % | 2.15 | % | 2.11 | % | 2.39 | % | 3.17 | % | ||||||||||||||
| Cost of funds(2)(5) |
0.35 | % | 0.38 | % | 0.42 | % | 0.11 | % | 0.03 | % | 0.12 | % | 0.55 | % | ||||||||||||||
| Net interest margin(6) |
3.15 | % | 2.61 | % | 2.70 | % | 2.05 | % | 2.08 | % | 2.28 | % | 2.65 | % | ||||||||||||||
| Non-interest income as a percentage of average assets(2) |
0.58 | % | 0.11 | % | 0.32 | % | 0.24 | % | 0.33 | % | 0.20 | % | 0.19 | % | ||||||||||||||
| Non-interest expense as a percentage of average assets(2) |
2.04 | % | 1.89 | % | 1.89 | % | 1.42 | % | 1.55 | % | 1.64 | % | 1.87 | % | ||||||||||||||
| Efficiency ratio(2)(7) |
54.99 | % | 69.91 | % | 62.78 | % | 62.39 | % | 66.06 | % | 67.79 | % | 67.28 | % | ||||||||||||||
| Liquidity & Asset Quality Ratios: |
||||||||||||||||||||||||||||
| Liquidity ratio(8) |
79.36% | 72.18% | 78.75% | 70.74% | 78.75% | 62.89% | 70.26% | |||||||||||||||||||||
| Loan-to-deposit ratio |
26.94% | 32.91% | 27.35% | 33.60% | 24.89% | 43.43% | 34.83% | |||||||||||||||||||||
| Nonaccrual loans |
$ | | $ | | $ | | $ | | $ | | $ | | $ | | ||||||||||||||
| Nonaccrual troubled debt restructured loans |
$ | | $ | | $ | | $ | | $ | | $ | | $ | | ||||||||||||||
| Loans 90 days past due and still accruing |
$ | | $ | | $ | | $ | | $ | | $ | | $ | | ||||||||||||||
| Other real estate owned |
$ | | $ | | $ | | $ | | $ | | $ | | $ | | ||||||||||||||
| Non-performing assets |
$ | | $ | | $ | | $ | | $ | | $ | | $ | | ||||||||||||||
| Non-performing assets to total assets |
0.00% | 0.00% | 0.00% | 0.00% | 0.00% | 0.00% | 0.00% | |||||||||||||||||||||
| Allowance for credit losses to total loans outstanding(9) |
1.41% | 1.40% | 1.42% | 1.40% | 1.29% | 1.21% | 1.40% | |||||||||||||||||||||
23
Table of Contents
| At or for the Three Months Ended March 31, |
At or for the Year Ended December 31, |
|||||||||||||||||||||||||||
| 2024 | 2023 | 2023 | 2022 | 2021 | 2020 | 2019 | ||||||||||||||||||||||
| (Dollars in thousands except per share data) | ||||||||||||||||||||||||||||
| Allowance for credit losses on held to maturity securities/ gross held to maturity securities(9) |
0.12% | 0.11% | 0.11% | N/A | N/A | N/A | N/A | |||||||||||||||||||||
| Net loan charge-offs |
$ | | | $ | | $ | | $ | | $ | | $ | | |||||||||||||||
| Net loan charge-offs (recoveries) to average loans outstanding |
0.00% | 0.00% | 0.00% | 0.00% | 0.00% | 0.00% | 0.00% | |||||||||||||||||||||
| Capital Information (Chain Bridge Bancorp, Inc.):(10) |
||||||||||||||||||||||||||||
| Tangible common equity to tangible total assets ratio(11) |
7.10% | 6.92% | 6.92% | 6.67% | 5.71% | 8.02% | 6.86% | |||||||||||||||||||||
| Tier 1 capital |
$ | 98,931 | $ | 87,219 | $ | 95,002 | $ | 86,430 | $ | 67,649 | $ | 60,601 | $ | 54,600 | ||||||||||||||
| Total regulatory capital |
$ | 103,614 | $ | 92,020 | $ | 99,669 | $ | 90,912 | $ | 71,309 | $ | 64,597 | $ | 58,179 | ||||||||||||||
| Tier 1 leverage ratio |
8.66% | 8.50% | 8.77% | 7.64% | 5.98% | 6.36% | 7.09% | |||||||||||||||||||||
| Common equity tier 1 capital ratio |
24.08% | 19.93% | 23.12% | 19.35% | 18.03% | 18.97% | 19.08% | |||||||||||||||||||||
| Tier 1 risk-based capital ratio |
24.08% | 19.93% | 23.12% | 19.35% | 18.03% | 18.97% | 19.08% | |||||||||||||||||||||
| Total risk-based capital ratio |
25.22% | 21.03% | 24.26% | 20.36% | 19.00% | 20.22% | 20.33% | |||||||||||||||||||||
| Capital Information (Chain Bridge Bank, N.A.):(10) |
||||||||||||||||||||||||||||
| Tier 1 capital |
$ | 103,976 | $ | 92,253 | $ | 99,856 | $ | 91,374 | $ | 72,647 | $ | 69,513 | $ | 65,396 | ||||||||||||||
| Total regulatory capital |
$ | 108,659 | $ | 97,054 | $ | 104,523 | $ | 95,856 | $ | 76,307 | $ | 73,509 | $ | 61,817 | ||||||||||||||
| Tier 1 leverage ratio |
9.10% | 8.99% | 9.21% | 8.08% | 6.42% | 7.30% | 8.02% | |||||||||||||||||||||
| Common equity tier 1 capital ratio |
25.30% | 21.08% | 24.30% | 20.46% | 19.36% | 21.76% | 21.60% | |||||||||||||||||||||
| Tier 1 risk-based capital ratio |
25.30% | 21.08% | 24.30% | 20.46% | 19.36% | 21.76% | 21.60% | |||||||||||||||||||||
| Total risk-based capital ratio |
26.44% | 22.18% | 25.44% | 21.46% | 20.33% | 23.01% | 22.85% | |||||||||||||||||||||
| Commercial real estate loans to total risk-based capital |
43.48% | 50.33% | 45.38% | 51.02% | 57.53% | 46.93% | 69.60% | |||||||||||||||||||||
| Land acquisition, development and construction loans to total risk-based capital |
12.52% | 9.64% | 11.39% | 9.36% | 5.13% | 4.42% | 9.81% | |||||||||||||||||||||
| (1) | The number of basic and diluted shares are the same because there are no potentially dilutive instruments. |
| (2) | Ratios for the three-month periods are presented at an annualized basis. |
| (3) | Return on average risk-weighted assets is calculated as net income divided by average risk-weighted assets. Average risk-weighted assets is calculated using the last two quarter ends with respect to the quarterly period presented and using the last five quarter ends with respect to the annual periods presented. |
| (4) | Yield on average interest-earning assets is calculated as total interest and dividend income divided by average total interest-earning assets. |
| (5) | Cost of funds is calculated as total interest expense divided by the sum of average total interest-bearing liabilities and average demand deposits. |
| (6) | Net interest margin is net interest income expressed as a percentage of average interest-earning assets. |
24
Table of Contents
| (7) | Efficiency ratio is calculated as non-interest expense divided by the sum of net interest income and non-interest income. |
| (8) | Liquidity ratio is calculated as the sum of cash and cash equivalents and unpledged investment grade securities, expressed as a percentage of total liabilities. |
| (9) | On January 1, 2023, the Company adopted ASU 2016-13, Financial Instruments Credit Losses (Topic 326), which shifts credit loss accounting to an expected loss model, requiring the up-front estimation of expected credit loss, for all in-scope instruments including the held to maturity securities portfolio. |
| (10) | Capital information is calculated in accordance with regulatory accounting principles specified by regulatory agencies for supervisory reporting purposes. |
| (11) | The ratio of tangible common equity to tangible total assets is calculated in accordance with GAAP and represents the ratio of common equity to total assets. The Company did not have any intangible assets or goodwill for the periods presented. |
25
Table of Contents
Investing in our common stock involves a significant degree of risk. The material risks and uncertainties that management believes affect us are described below. Before investing in our common stock, you should carefully consider the risks and uncertainties described below, in addition to the other information contained in this prospectus. Any of the following risks, as well as risks that we do not know or that we currently deem immaterial, could have a material adverse effect on our business, financial condition and results of operations. As a result, the trading price of our Class A common stock could decline, and you could lose some or all of your investment. Further, to the extent that any of the information in this prospectus constitutes forward-looking statements, the risk factors below are cautionary statements identifying important factors that could cause actual results to differ materially from those expressed in any forward-looking statements made by us or on our behalf. See Cautionary Note Regarding Forward-Looking Statements.
Interest Rate Risk
Changes in interest rates may adversely affect our earnings and financial condition.
Changes in interest rates may adversely affect our earnings and financial condition. Interest rates are highly sensitive to many factors beyond our control, including inflation, unemployment, changes in the money supply, international events, events in world financial markets, competition, general economic conditions and monetary and fiscal policies of various governmental and regulatory authorities, including the Federal Reserve.
Our operating income and net income depend to a great extent on net interest margin (i.e., the difference between the interest yields earned on cash, loans, securities and other interest-bearing assets and the interest rates paid on interest-bearing deposits, borrowings and other liabilities). Net interest margin is affected by changes in market interest rates because different types of assets and liabilities may react differently, and at different times, to market interest rate changes. When interest-bearing liabilities mature or reprice more quickly than interest-earning assets in a period, an increase in market rates of interest could reduce net interest income. Similarly, when interest-earning assets mature or reprice more quickly than interest-bearing liabilities, falling interest rates could reduce net interest income. In addition, because a significant majority of our funding consists of non-interest-bearing deposits and a substantial amount of our assets are invested in cash and cash equivalents, a decrease in short-term interest rates would be expected to immediately reduce our interest income without a corresponding reduction in our interest expense, which would reduce our net interest income. Similarly, we have benefitted from an inverted yield curve because short-term rates have become higher than long-term rates, and if the yield curve flattens or normalizes, our net interest income could be adversely affected. Any of these conditions would be expected to adversely affect our business, results of operations and financial condition.
A substantial portion of our assets are invested in interest-bearing reserves at the Federal Reserve. If the Federal Reserve decreases the interest it pays on these reserves, or ceases to pay interest on these reserves entirely, our net interest income could be adversely affected. Further, a reduction in the interest rate paid on these reserves or in the accessibility of these reserves could compel us to seek alternative, potentially higher-risk investments to generate interest income, which could adversely affect our business, results of operations and financial condition.
Increases in interest rates will likely also adversely affect the market value of our investment and loan portfolios, and if we are required to sell securities at a discount prior to their maturity, our unrealized losses would then turn into realized losses. See Increases in interest rates could result in losses on our investment securities portfolio.
We attempt to manage risk from changes in market interest rates by adjusting the rates, maturity, repricing, and balances of the different types of interest-earning assets and interest-bearing liabilities, but interest rate risk management techniques are not exact. As a result, a rapid increase or decrease in interest rates could have an adverse effect on our net interest margin and results of operations. Market interest rates for types of products and
26
Table of Contents
services in our market also may vary significantly over time based upon competition and local or regional economic factors. Our interest rate risk management process depends upon a number of assumptions which may prove to be inaccurate. There can be no assurance that we will be able to successfully manage our interest rate risk.
Increases in interest rates could result in losses on our investment securities portfolio.
We invest a significant portion of assets in investment securities. As of March 31, 2024, we held 45.6% of our assets in an investment securities portfolio containing U.S. government, municipal, and corporate bonds that are sensitive to broad economic conditions, especially interest rates. Interest rate increases have recently resulted in, and could in the future result in, unrealized losses in our investment securities portfolio, as increases in interest rates ordinarily decrease the estimated fair value of fixed income securities and result in decreased unrealized gains or increased unrealized losses on fixed income securities. We recognize the accumulated change in estimated fair value of these fixed income securities in net income when we realize a gain or loss upon the sale of the security. As of March 31, 2024, our net unrealized losses on securities available for sale, net of tax, totaled $7.9 million and our net unrealized losses on securities held to maturity, net of tax, totaled $20.6 million, which collectively equaled 28.8% of our Tier 1 capital. If we were required to sell all or a material portion of our investment securities portfolio, we may recognize significant losses that would adversely affect our business, results of operations or financial condition and reduce our regulatory capital ratios.
If the average interest rate we pay on our deposits increases, our cost of funds would rise.
A significant majority of our funding consists of non-interest-bearing deposits. As of March 31, 2024, 72.7% of our liabilities consisted of non-interest-bearing deposits. During periods of high or increasing interest rates, our clients have in the past shifted, and may in the future shift, their funds to accounts or financial institutions that offer higher interest rates. Such movements increase our cost of funds and adversely affect our business, financial condition or results of operations. Further, to the extent clients withdraw their deposits and move their funds to competitors or alternative investments, we would lose a lower-cost source of funding, which would be expected to adversely affect our business, financial condition or results of operations. See Liquidity Risk Loss of deposits could increase our funding costs or require us to sell assets or borrow.
Liquidity Risk
Liquidity risks could adversely affect our business, financial condition and results of operations.
Liquidity risk is the risk that we will not be able to meet our obligations, including financial commitments, as they come due and is inherent in our operations. An inability to raise funds through deposits, borrowings, the sale of investment securities and from other sources could have a substantial negative effect on our liquidity.
Our most important source of funds consists of our clients deposits. Deposit balances can decrease for a variety of reasons, and if clients move money out of deposits for any reason, we could lose a relatively low cost source of funds, or we may need to sell assets or borrow for liquidity. See Loss of deposits could increase our funding costs or require us to sell assets. Further, we estimate a majority of our deposit balances were sourced from political organizations as of March 31, 2024, which cause our deposit balances to fluctuate due to the seasonality of fundraising and spending around elections. See Our demand deposits are concentrated in political organizations, which can vary significantly in volume due to seasonality or changes in political activity or campaign finance laws.
Another primary source of liquidity is our account at the Federal Reserve, which held $338.0 million at March 31, 2024, which supports our daily and ongoing activities. We also maintain secured lines of credit with the Federal Home Loan Bank (the FHLB) and the Federal Reserves discount window and receive principal and interest payments on our loans and investment securities. Cash on hand, cash at third-party banks and available for sale debt securities are our most liquid assets. Our investment portfolio is composed of investment
27
Table of Contents
grade securities. Our access to funding sources in amounts adequate to finance or capitalize our activities or on terms that are acceptable to us could be impaired by factors that affect us directly or the financial services industry or economy in general, such as disruptions in the financial markets or negative views and expectations about the prospects for the financial services industry. Economic conditions and a loss of confidence in financial institutions may increase our cost of funding and limit access to certain customary sources of capital, including inter-bank borrowings and borrowings from the discount window of the Federal Reserve.
Any decline in available funding could adversely impact our ability to continue to implement our business plan, including originating loans, investing in securities, meeting our expenses or fulfilling obligations such as repaying our borrowings and meeting deposit withdrawal demands, any of which could have a material adverse effect on our business, financial condition and results of operations.
Loss of deposits could increase our funding costs or require us to sell assets or borrow.
Like many banking companies, we rely on client deposits to meet a considerable portion of our funding, and we continue to seek client deposits to maintain this funding base. We accept deposits directly from consumer and commercial clients and, as of March 31, 2024, we had $1.1 billion in total deposits. If we are unable to sufficiently maintain or grow our deposits to meet liquidity objectives, we may be subject to paying higher funding costs or unable to satisfy our funding needs.
Our deposits may be subject to dramatic fluctuations in availability or price due to certain factors outside our control, such as a loss of confidence by clients in us or the banking sector generally, client perceptions of our financial health and general reputation, increasing competitive pressures from other financial services firms for consumer or commercial client deposits, changes in interest rates and returns on other investment classes, which could result in significant outflows of deposits within short periods of time or significant changes in pricing necessary to maintain current client deposits or attract additional deposits. Notably, we estimate our deposits received from political organizations constituted a majority of our total deposits as of March 31, 2024, and these deposits are generally more seasonal than typical commercial or consumer deposits, aligning with the cycle of federal election campaigns. See Our demand deposits are concentrated in political organizations, which can vary significantly in volume due to seasonality or changes in political activity or campaign finance laws. Further, as of March 31, 2024, we estimate that approximately 65.6% of our total deposits were not insured by the FDIC, and these uninsured deposits may be more likely to be withdrawn if we experience, or are perceived to experience, financial distress or during periods of real or perceived stress or instability in financial markets more generally. See Our demand deposits are concentrated in uninsured deposits. In addition, if our competitors raise the rates they pay on deposits, our funding costs may increase, either because we raise our rates to avoid losing deposits or because we lose deposits and must rely on more expensive sources of funding. Also, clients typically move money from bank deposits to alternative investments during high or rising interest rate environments. Checking and savings account balances and other forms of client deposits may decrease when clients perceive alternative investments as providing a better risk/return trade-off. Our clients could take their money out of the Bank and put it in alternative investments, causing us to lose a lower cost source of funding. Clients may also move non-interest-bearing deposits to interest-bearing accounts, increasing the cost of those deposits. Obtaining adequate funding to meet our deposit obligations may be more challenging during periods of elevated prevailing interest rates, such as the present, and our ability to attract depositors during a time of actual or perceived distress or instability in the marketplace may be limited. Higher funding costs could reduce our net interest margin and net interest income and could have a material adverse effect on our business, financial condition and results of operations.
Most of our deposits come from a relatively small number of commercial relationships.
We serve a smaller number of commercial deposit clients compared to the larger number of consumer deposit clients served by most other banks. As of March 31, 2024, there were 13 clients with individual deposit balances exceeding 1% of our total deposits, accounting for 29.1% of our total deposits, and approximately 91.8% of our total deposit balances were from commercial entities, including businesses, political organizations,
28
Table of Contents
trade associations, and nonprofit organizations. These deposit clients are typically intermediated by personal relationships between Bank officers and the commercial client account signers, and therefore can require significant investments of time and resources to maintain. Any deterioration in such relationships, particularly those associated with significant deposit size, could lead to an outflow of deposits and compel us to liquidate interest-earning assets, which could lead to a decline in our earnings. Changes in personnel in these relationships, whether at the Bank or on the part of the client, could cause the relationship to deteriorate and the depositor to leave the Bank. Further, a concentrated number of firms provide treasury and regulatory compliance services for political organizations and open deposit accounts with the Bank on behalf of their clients. These firms are a significant source of our deposits. If our relationships with these firms deteriorate, this could lead to an outflow of deposits from multiple existing clients or we could fail to acquire new clients from these firms in the future. Additionally, we are not very well known outside of the commercial sectors we primarily serve, especially political organizations, and have little consumer brand recognition in the Washington, D.C. metropolitan area market and no consumer brand recognition in other markets, and as a result our deposit base and earnings may continue to be heavily dependent on our commercial deposit clients for the foreseeable future.
Our demand deposits are concentrated in political organizations, which can vary significantly in volume due to seasonality or changes in political activity or campaign finance laws.
As of March 31, 2024, we estimate a majority of our demand deposits were represented by political organizations. These deposits exhibit more seasonality than typical commercial or consumer deposits. Federal election cycles influence our deposit levels and revenues. In the quarters leading up to federal elections, especially presidential elections, our deposits, net interest income, and non-interest income generally increase. Conversely, in the quarters immediately before, during, and after a federal election, we usually experience an outflow of political organization deposits, causing revenue to decline until clients resume fundraising for the next election cycle. The precise amount and timing of these outflows remain uncertain and may differ from historical patterns. Post-election fundraising activities are generally influenced by the outcome of the federal elections, and will likely be influenced by the 2024 presidential election. Even within our classification of political organizations, some types may exhibit more seasonality. For instance, certain party committee accounts may maintain funds throughout election cycles, while some campaign committees may have accounts that are only established for a single campaign. During periods of high interest rates this seasonality may be exacerbated. We may underestimate the proportion of our deposits subject to seasonality, potentially leading to greater than expected deposit outflows. If our deposit levels decline due to seasonality and we replace them with higher-cost deposits or borrowings, sell investment securities at a discount before maturity, or reduce our interest-bearing assets, our net interest margin, earnings, and earnings per share could be adversely affected.
Due to our concentration in seasonal deposits, the Bank typically maintains a higher proportion of its assets in highly liquid investments, such as reserve balances at the Federal Reserve or U.S. Treasury securities, to fund withdrawals associated with seasonal demand deposits and to minimize the risk of principal loss. These highly liquid, zero-risk-weighted investments generally have lower yields than fully risk-weighted assets such as commercial or consumer loans.
During periods of growth in seasonal deposits, assets could reach a level that would require the Bank to control the level of these deposits, which could constrain the Banks earnings or growth, or require the Company to obtain additional capital, which could dilute existing stockholders, to maintain a satisfactory Tier 1 leverage ratio. In the past, we have managed our Tier 1 leverage ratio by moving certain deposit accounts off our balance sheet through the ICS® network, but there is no assurance we could do so in the future. See Other Risks Related to Our Business We place a significant portion of our clients deposits with other banks through the ICS® network, which exposes us to risks that may adversely affect our business, financial condition or results of operations.
The level of deposits by political organizations may also be adversely affected by changes in political activity or campaign finance laws. For example, following the U.S. Supreme Courts decision in Citizens United v. Federal Election Commission in 2010, we have experienced significant deposit inflows from Super
29
Table of Contents
PACs that are permitted to accept unlimited contributions for the purpose of making independent expenditures. Any changes in political contributions or spending, including as a result of a change in campaign finance laws that restrict our clients ability to accept contributions or spend funds, could reduce our deposit inflows and adversely affect our business, financial condition, or results of operations.
Our demand deposits are concentrated in uninsured deposits.
As of March 31, 2024, we estimate that approximately 65.6% of our total deposits were not insured by the FDIC. These uninsured deposits may be more likely to be withdrawn if we experience, or are perceived to experience, financial distress or during periods of real or perceived stress or instability in financial markets more generally. For example, bank failures have caused ongoing concerns about the liquidity of the financial services industry, which could exacerbate deposit outflows due to concerns that deposits held at the Bank exceed the FDICs $250,000 per client insurance limit. These concerns may be exacerbated by negative media attention and the rapid spread of rumors, concerns and misinformation on social media could cause panic among investors, depositors, clients and the general public. If many clients withdraw their deposits, it could have a material adverse effect on our business, financial condition and results of operations. See Loss of deposits could increase our funding costs or require us to sell assets.
We participate in the ICS® network to provide our clients with additional FDIC insurance coverage for their uninsured balances. For our clients that opt into the ICS® network, this service allows us to place their deposits in increments up to the FDIC insurance limits at other banks within the ICS® network. However, there can be no assurance that the availability of the ICS® network will limit outflows of our uninsured deposits. See We place a significant portion of our clients deposits with other banks through the ICS® network, which exposes us to risks that may adversely affect our business, financial condition or results of operations.
Our liquidity is dependent on dividends from the Bank.
We are a legal entity separate and distinct from our bank subsidiary, Chain Bridge Bank, N.A. Dividends from the Bank provide virtually all of our cash flow. Various federal and state laws and regulations limit the amount of dividends that our Bank may pay to us. For example, under applicable regulations, the Bank may not, without prior regulatory approval, declare dividends in excess of the sum of the current years net profits plus the retained net profits from the prior two years or in excess of the sum of the Banks retained earnings and current period net income. See Risks Related to Our Class A Common Stock We do not intend to pay dividends on our Class A common stock for the foreseeable future, and our future ability to pay dividends is subject to restrictions. Also, our right to participate in a distribution of assets upon a subsidiarys liquidation or reorganization is subject to the prior claims of the subsidiarys creditors. In the event the Bank is unable to pay dividends to us, we may not be able to service any debt we may incur, pay obligations or pay dividends on our common stock. The inability to receive dividends from the Bank could affect our liquidity and have a material adverse effect on our business, financial condition and results of operations.
We may need to raise additional capital in the future, and such capital may not be available when needed or at all.
We may need to raise additional capital, in the form of additional debt or equity, in the future to have sufficient capital resources and liquidity to meet our commitments and fund our business needs and future growth, particularly if the quality of our assets or earnings were to deteriorate significantly. Our ability to raise additional capital, if needed, will depend on, among other things, conditions in the capital markets at that time, which are outside of our control, and our financial condition. Economic conditions and a loss of confidence in financial institutions may increase our cost of funding and limit access to certain customary sources of capital, including inter-bank borrowings, repurchase agreements and borrowings from the discount window of the Federal Reserve System. We may not be able to obtain capital on acceptable terms, or at all. Any occurrence that may limit our access to the capital markets, such as a decline in the confidence of debt purchasers, depositors of the Bank or counterparties participating in the capital markets or other disruption in capital markets, may adversely affect our capital costs and our ability to raise capital and, in turn, our liquidity. Further, if we need to
30
Table of Contents
raise additional capital in the future, we may have to do so when many other financial institutions are also seeking to raise capital and would then have to compete with those institutions for investors. An inability to raise additional capital on acceptable terms when needed could have a material adverse effect on our business, financial condition and results of operations.
In addition, an inability to raise capital when needed may subject us to increased regulatory supervision and the imposition of restrictions on our growth and business. These restrictions could negatively affect our ability to operate or further expand our operations through loan growth, acquisitions or otherwise. These restrictions may also result in increases in operating expenses and reductions in revenues that could have a material adverse effect on our business, financial condition and results of operations.
If we raise additional capital by incurring debt at the holding company level, including to fund capital contributions to the Bank, it could reduce the returns on our Class A common stock or put our ownership of the Bank at risk. For example, we currently have a $10.0 million unsecured line of credit with a third-party commercial bank that matures in December 2024, with an outstanding balance of $5.0 million as of March 31, 2024. We may not be able to extend or replace this line of credit after it matures, or if we are able to extend or replace this line of credit, we may only be able to do so on less favorable terms. We could also elect to incur additional debt at the holding company in order to provide additional capital to the Bank, or other secured lending, which could be secured by a pledge of all, or a majority, of the stock of the Bank through the issuance of notes or debentures, or similar securities or instruments. While the line of credit is currently unsecured, we could take these actions, including pledging the stock of the Bank, without any shareholder approval. While the use of leverage at the holding company level may limit the dilution of our earnings and book value, the interest we accrue and pay on our current or future debt could adversely affect our earnings, equity, stockholder returns and the value of the Class A common stock. In addition, if the debt is secured by the Banks stock then the failure to make regular payments on the debt on interest payment dates or at maturity, or the failure to comply with financial covenants or other conditions of the borrowing, could result in the sale of the Bank in order to pay the debt, and such sale may not be in a manner which would maximize stockholder value.
Credit Risk
Our results of operations and financial condition would be adversely affected if the Banks allowance for credit losses is insufficient to absorb actual losses or needs to be increased.
Our financial results and condition could be negatively impacted if our allowance for credit losses isnt enough to cover actual losses or if we need to increase this allowance. While we have historically maintained low levels of non-performing assets and net charge-offs, there is no guarantee this trend will continue. Banking regulations, specifically those set forth by the OCC and the FDIC, require that the securities we hold must be investment grade. However, no similar regulation applies to our loan portfolio. The main risks associated with our loan portfolio include: (1) the geographic concentration of our loans in the Washington, D.C. area; (2) our exposure to certain categories of loans with relatively higher credit risk, including commercial real estate and commercial and industrial loans; (3) the relatively large size of some residential mortgage loans; and (4) the newness of certain loans made later in the economic cycle. Even though we believe that our allowance for credit losses is reasonably sufficient to cover expected losses, estimating loan losses involves judgment and inherent uncertainties. Despite our efforts to monitor credit quality and identify problem loans early, we may not always succeed in detecting deteriorating loans before they become non-performing, nor can we guarantee that we will be able to limit losses. As a result, we may need to significantly and unexpectedly increase our allowance for credit losses in the future, which could materially affect our financial performance and condition.
Losses related to a single large loan could have a significant impact on the Banks financial condition and results of operations.
As a result of the Banks concentrations of single-family residential jumbo mortgage loans and large commercial loans, two of which have balances in excess of 5.0% of our total stockholders equity as of March 31, 2024, a loss on any single large loan or multiple loans could negatively impact our results of
31
Table of Contents
operations. Additionally, commercial and industrial loans not primarily secured by real estate are typically made based on the ability of the borrower to make payment on the loan from the cash flow of the business, and are collateralized primarily by business assets such as equipment and accounts receivable. These assets are often subject to depreciation over time and may be more difficult than real estate collateral to evaluate, and the value of such assets may be more difficult to realize upon liquidation. As a result, the availability of funds for repayment of such loans is often contingent on the success of the business itself. Although the Bank officers strive to rigorously underwrite and structure loans and diligently monitor the financial condition of borrowers in an effort to avoid or minimize losses, unexpected reversals in the business of an individual borrower can occur, and the resulting decline in the quality of loans to such borrowers, and related provisions for credit losses, could have a material adverse effect on our results of operations and financial condition. Despite our best efforts, it is not always possible to predict or prevent every potential financial issue that borrowers may face.
The Bank relies upon independent appraisals to determine the value of the real estate that secures a significant portion of its loans, and the values indicated by such appraisals may not be realizable if the Bank is compelled to foreclose upon such loans.
A significant portion of the Banks loan portfolio consists of loans secured by residential and commercial real estate. The Bank relies upon independent appraisers to estimate the value of such real estate. Appraisals are only estimates of value and the independent appraisers may make mistakes of fact or judgment, which may adversely affect the reliability of their appraisals. In addition, events occurring after the initial appraisal may cause the value of the real estate to increase or decrease. As a result of any of these factors, the real estate securing some loans may be more or less valuable than anticipated at the time the loans were made. If a default occurs on a loan secured by real estate that is less valuable than originally estimated, the Bank may not be able to recover the outstanding balance of the loan and will suffer a loss.
Other Risks Related to Our Business
Our business may be adversely affected by conditions in the financial markets and economic conditions generally.
Our financial performance generally is dependent upon the business environment in the markets in which we operate and in the United States as a whole, and may be adversely affected by conditions in the financial markets and economic conditions. Unfavorable or uncertain economic and market conditions can be caused by, among other factors, declines in economic growth, business activity or investor or business confidence; limitations on the availability or increases in the cost of credit and capital; changes in inflation, interest rates or monetary policy; increases in real estate and other state and local taxes; high unemployment; natural disasters; geopolitical issues, conflicts and uncertainty; public health emergencies or pandemics; and other external factors or a combination of these or other factors.
Unfavorable economic or market conditions can result in a deterioration in the credit quality of our borrowers, the value of collateral securing our loans and leases and the demand for our products and services, an increase in the number of loan delinquencies, defaults and charge-offs, additional provisions for credit losses and an overall material adverse effect on the quality of our loan portfolio, each of which could adversely affect our business, results of operations or financial condition. Our deposit balances and earning assets may also be impacted by economic and market factors such as output, inflation, interest rates, wages, asset values, and government spending. In addition to any impact on our balance sheet, inflation can increase our operating costs primarily through labor and technology overhead. Political fundraising comprises a large share of our deposit base and is dependent on contributions from high-net-worth and small-dollar donors across the United States, which may decline during periods of unfavorable economic or market conditions. High-earning professionals in fields such as public affairs, law, government contracting, and consulting are a substantial source of our deposits and loans, and to the extent such professionals are adversely affected by unfavorable economic or market conditions, they may withdraw some or all of their deposits or become unable to repay their loans. We also have a significant portion of our assets in an investment securities portfolio containing U.S. government, municipal, and corporate bonds that are sensitive to broad economic conditions, especially interest rates.
32
Table of Contents
The geographic concentration of our business in the Washington, D.C. metropolitan area makes our business highly susceptible to local economic conditions and reductions or changes in government spending.
Our operations are concentrated in the Washington D.C. metropolitan area market, where our banking office is located. For example, our mortgage financing portfolio contains mostly single-family home loans within the Washington, D.C. metropolitan area, and a significant portion of our lending portfolio is secured by single-family home mortgages in this geographic region. Further, a majority of our consumer deposit clients are located in the Washington, D.C. metropolitan area.
The Washington, D.C. metropolitan areas economy is heavily dependent on federal government spending, as a significant number of businesses in the area are federal government contractors or subcontractors, or depend on such businesses for a significant portion of their revenues. If the U.S. federal government were to cut or slow its spending on employment, government contracts, and real estate leases, that would adversely impact the Washington, D.C. metropolitan areas economy. If economic conditions in the region deteriorate, or there is significant volatility or weakness in the Washington, D.C. metropolitan areas economy, or any significant sector of the areas economy, our ability to maintain or develop our business relationships may be diminished, the quality and collectability of our loans may be adversely affected, the value of collateral securing our loans may decline, loan demand may be reduced, and we may experience consumer deposit withdrawals. These developments could negatively impact our business, results of operations and financial condition.
While we do not have a significant level of loans to federal government contractors or their subcontractors, the impact of a decline in federal government spending, a reallocation of government spending to different industries or different areas of the country, or a delay in payments to such contractors could adversely affect our clients. Temporary layoffs, staffing freezes, salary reductions, or shutdown and furloughs of government employees or government contractors could have adverse impacts on other businesses in our market and the general economy of the greater Washington, D.C. metropolitan area, and may indirectly lead to a loss of revenues by our clients, including vendors and lessors to the federal government and government contractors or to their employees, as well as a wide variety of commercial and retail businesses. Accordingly, such actions by the federal government could lead to increases in loan delinquencies, defaults, and charge-offs, or a decline in liquidity.
Our investment securities portfolio exposes us to risks beyond our market area.
As of March 31, 2024, 45.6% of our assets were invested in securities. The size of the investment securities portfolio depends on the seasonality of demand deposits from campaigns and elections industry depositors, the concomitant need to maintain a higher degree of liquidity to meet the withdrawal needs of these depositors, and the demand for loans that meet our underwriting criteria.
We invest in a wide variety of securities, including U.S. government and agency obligations, taxable and non-taxable municipal bonds, including general obligation and revenue bonds, and investment grade corporate bonds. Under national banking laws, all bank-owned securities must be investment grade at the time of purchase. Investments in municipal and corporate bonds, in particular, expose us to the economic risks of communities and businesses across the country. If the economy were to enter a recession, the financial condition of many states and municipalities and of many corporations would likely weaken. Lower tax revenues could impair the ability of states and localities to repay their bond indebtedness. Similarly, lower corporate sales could impair the ability even of investment grade corporations to repay their indebtedness. Furthermore, although the Bank only purchases investment grade securities, it is possible that some of the corporate bonds it has purchased could be downgraded to below investment grade after the bank purchases them. The Bank seeks to broadly diversify its investment securities and to limit its exposure to any one bond issue, issuer or project, but there can be no assurance that we will not incur losses related to its investment activities.
33
Table of Contents
Our significant investment in securities held to maturity exposes us to risks that may adversely affect our business, financial condition or results of operations.
As of March 31, 2024, 25.0% of our assets were invested in securities held to maturity (measured at amortized cost, net of allowance for credit losses), which subject us to certain risks that may adversely affect our business, financial condition or results of operations, including the following:
| | Securities held to maturity are carried at amortized cost, and their fair value is not adjusted for changes in interest rates. Consequently, if interest rates rise, the fair value of our securities held to maturity would be expected to decline, but this decrease would not be immediately reflected in our net income or stockholders equity. However, this could result in significant unrealized losses, which could impact our ability to borrow from correspondent banks. Further, if we were required to sell all or a material portion of our securities held to maturity, we may recognize significant losses that would adversely affect our business, results of operations or financial condition. See Interest Rate Risk Increases in interest rates could result in losses on our investment securities portfolio. As of March 31, 2024, the carrying value (net of allowance for credit losses) of our securities held to maturity was $308.0 million, compared to a fair value of $282.3 million. |
| | In general, we cannot sell any of our securities held to maturity without potentially tainting our entire securities held to maturity portfolio, except under specific circumstances permitted by accounting standards. This constraint would limit our ability to quickly reallocate our investment portfolio in response to changes in market conditions or liquidity needs. If we are required to sell securities held to maturity, including to meet liquidity needs, we may realize significant losses that would adversely affect our business, results of operations or financial condition. |
| | Changes in accounting standards or regulatory guidance could require us to reclassify our securities held to maturity, which would adversely affect our stockholders equity and could lead to increased volatility in our reported earnings and capital ratios. Additionally, future regulatory requirements may impose higher capital charges on securities held to maturity. |
Any of these risks related to our securities held to maturity may be exacerbated by negative market perceptions or investor confidence. In particular, adverse changes, or perceptions of adverse changes, in market conditions or the financial health of the issuers of our securities held to maturity could lead to concerns about our financial condition or risk management practices.
There can be no assurance that we will be able to maintain or increase our current levels of transaction accounts, non-interest-bearing demand deposits, and levels of profitability or growth.
As of March 31, 2024, a substantial portion of our deposits were held in transaction accounts, most of which are non-interest-bearing accounts that offer an earnings credit in lieu of interest to offset service charges. Transaction accounts have comprised over 50% of the Banks total deposits at each year-end since 2014. As of March 31, 2024, 91.8% and 73.4% of the Companys deposits were in transaction accounts and non-interest-bearing accounts, respectively. There can be no assurance that the high levels of transaction accounts or non-interest-bearing demand deposits will continue to be held by the Bank, or that they will not decline, and there can be no assurance that the Bank will be able to replace any such deposits at a similar cost, or increase its lending business on a profitable basis. There can be no assurance that we will be able to maintain profitability, continue to grow in a profitable manner, or increase our book value per share, which is one of the metrics we use to measure our performance.
We place a significant portion of our clients deposits with other banks through the ICS® network, which exposes us to risks that may adversely affect our business, financial condition or results of operations.
We participate in the ICS® network to provide our clients with additional FDIC insurance coverage for their uninsured balances. For our clients that opt into the ICS® network, this service allows us to place their deposits in increments up to the FDIC insurance limits at other banks within the ICS® network. In exchange, we may elect to either receive reciprocal deposits from other banks within the ICS® network or place the deposits at other banks as one-way sales and receive a deposit placement fee. If we elect to receive reciprocal deposits from other banks,
34
Table of Contents
the amount of deposits on our balance sheet does not decrease and we earn interest income on these reciprocal balances. If we elect to receive a deposit placement fee instead of receiving reciprocal deposits, the amount of deposits on our balance sheet decreases, which allows us to better control the size of our balance sheet and this fee increases our non-interest income. As of March 31, 2024, $388.5 million of our deposits were placed at other banks using the ICS® network, for which we elected to receive $99.3 million in reciprocal deposits. The $289.2 million in excess deposits as of March 31, 2024 were placed at other participating banks as one-way sales and our deposit placement services income was $1.1 million for the three months ended March 31, 2024. If we convert these deposits into reciprocal deposits and bring them back onto our balance sheet, we may receive interest income on these deposits, but our deposit placement services income would decline, which could adversely affect our business, financial condition or results of operations.
If we or our clients are no longer able to participate in the ICS® network, including because the ICS® network ceases or because of regulatory changes, we may experience deposit withdrawals, lose revenue from deposit placement fees, or experience a sudden increase in our balance sheet that could adversely affect our regulatory capital ratios. In order to sell a clients deposits through the ICS® network, the client must first opt into the ICS® network, and not all of our clients have opted into the ICS® network, nor can all of our clients be expected to opt into the ICS® network in the future. Further, our ability to provide our clients with deposit placement services through the ICS® network depends on the participation of other banks within the ICS® network, and any issues affecting these banks, including concerns related to participating banks financial stability, could disrupt our ability to provide these services to our clients. Any of these conditions could adversely affect our business, financial condition or results of operations.
Our Trust & Wealth Department exposes us to certain risks and there can be no assurance the department will contribute meaningfully to our revenues or become profitable on a standalone basis.
Our Trust & Wealth Department exposes us to certain risks. The department, which began operations in the third quarter of 2020 after receiving approval from the OCC for fiduciary powers, manages a variety of trusts, including special needs trusts. The products and services provided by the department include trustee services, investment management, financial planning, estate administration, and custody. Risks specifically related to our Trust & Wealth Department include:
| | Fiduciary Duty Compliance: We have a legal obligation to act in the best interests of our clients, which includes the duty to manage trust assets prudently. Failure to comply with these fiduciary duties can result in legal claims and significant financial liability. |
| | Litigation Risks: Trust and estate matters often involve disputes among beneficiaries or between beneficiaries and trustees. These disputes can lead to litigation, which can be costly and time consuming, potentially resulting in substantial legal expenses and damages. |
| | Regulatory Compliance: The trust department is subject to stringent regulatory oversight by federal and state authorities. Non-compliance with fiduciary regulations can lead to enforcement actions, fines, and other regulatory sanctions that could adversely affect our operations and reputation. |
| | Market Risks: Investment management services provided by the trust department are exposed to market risks. Poor investment performance can result in claims of mismanagement or breach of fiduciary duty, leading to potential legal liabilities. |
| | Personnel Risks: The success of our Trust & Wealth Department heavily relies on retaining specialized trust and wealth management personnel. The market for such skilled professionals is highly competitive. Losing key personnel could adversely impact our ability to manage trust accounts effectively and meet client expectations. |
| | Risks Specific to Special Needs Trusts: Managing special needs trusts exposes us to additional risks. These trusts are designed to provide financial support to individuals with disabilities without affecting their eligibility for government benefits like Medicaid and Supplemental Security Income (SSI). However, the rules governing these trusts are complex and state-specific. Failure to adhere to these rules can disqualify the trust, leading to the loss of benefits for the beneficiary and potential legal liabilities for the trustee. |
35
Table of Contents
In addition, the department generated revenues of approximately $565 thousand for the year ended December 31, 2023, but has not achieved standalone profitability. There can be no assurance that the Trust & Wealth Department will contribute meaningfully to our revenues or become profitable on a standalone basis. The unpredictability of assets under management and associated revenue further complicates our financial planning. Additionally, the highly competitive and commoditized nature of the wealth management industry poses ongoing challenges to our trust and asset management business.
We may be adversely affected by changes in the actual or perceived soundness or condition of other financial institutions.
Financial services institutions may be interconnected as a result of trading, investment, liquidity management, clearing, counterparty and other relationships. Within the financial services industry, loss of public confidence, including through default by any one institution, could lead to liquidity challenges or to defaults by other institutions. Concerns about, or a default by or failure of, one institution could lead to significant liquidity problems and losses or defaults by other institutions, as the commercial and financial soundness of many financial institutions is closely related as a result of these credit, trading, clearing and other relationships. Even the perceived lack of creditworthiness of, or questions about, a counterparty may lead to market-wide liquidity problems and losses or defaults by various institutions. This systemic risk may adversely affect financial intermediaries, such as clearing agencies, banks and exchanges with which we interact on a daily basis or key funding providers such as the FHLB, any of which could have a material adverse effect on our access to liquidity or otherwise have a material adverse effect on our business, financial condition and results of operations.
In addition, our securities portfolio includes investments in other financial institutions. As of March 31, 2024, we held $4.8 million principal amount of subordinated debt issued by other bank holding companies. Any changes to the actual or perceived soundness of other financial institutions could adversely affect the value of these securities, which could cause us to incur losses.
There is no assurance that the Bank will be able to compete successfully with others for its business.
The Bank competes for loans, deposits, fiduciary services and capital with other banks and other kinds of financial institutions and enterprises, such as securities firms, insurance companies, savings and loan associations, credit unions, mortgage brokers, and private lenders, many of which have substantially greater resources or are subject to less stringent regulations. The differences in resources and regulations may make it more difficult for the Bank to compete profitably, including because the Bank may be required to reduce the rates that it charges on loans and investments or increase the rates it offers on deposits in order to compete, which would adversely affect the Banks business, financial condition and results of operations. Further, the Banks profitability, in large part, results from its ability to maintain high levels of non-interest-bearing demand deposits, which are provided by campaigns and elections industry clients. There can be no assurance that the Bank will be able to effectively compete to maintain or grow its current share of deposits from these businesses and organizations.
We could fail to attract, retain or motivate skilled and qualified personnel, including our senior management, other key employees or directors, which could adversely affect our business.
Our ability to implement our strategic plan depends on our ability to attract, retain and motivate skilled and qualified personnel, including our senior management and other key employees and directors. The marketplace for skilled personnel is becoming more competitive, and the cost of hiring, incentivizing and retaining skilled personnel may continue to increase. The failure to attract or retain, including as a result of an untimely death or illness of key personnel, or replace a sufficient number of appropriately skilled and key personnel could place us at a competitive disadvantage and prevent us from successfully implementing our strategy, which could have a material adverse effect on our business, financial condition and results of operations.
36
Table of Contents
In addition, our business is service-oriented and depends to a large extent upon the client relationships that our senior officers develop and maintain, particularly with clients that maintain high levels of non-interest-bearing demand deposits. Any deterioration in such relationships, particularly those associated with significant deposit size, could lead to an outflow of deposits. See Liquidity Risk We do not have a large consumer deposit base and most of our deposits come from a relatively small number of commercial relationships. Accordingly, if we are unable to retain any of our executive officers or other senior employees, including our Chairman, Peter G. Fitzgerald, our Chief Executive Officer John J. Brough, our President, David M. Evinger, and our Chief Financial Officer, Joanna R. Williamson, our business, results of operations, and financial condition could be adversely affected.
Certain clients, including our political organization clients, may be subject to, and are particularly sensitive to, negative publicity, which may subject us to enhanced reputational risk.
Certain clients, including political organizations may be sensitive to public opinion and if we are not able to effectively manage negative publicity regarding the Bank or our client relationships, our relationships with these clients could suffer, which could lead to deposit withdrawals. As a public company, we and our relationships with our clients may be subject to increased public scrutiny, and certain of our clients may move their deposit accounts to other non-public institutions that they perceive as providing greater privacy. Further, if our clients are subject to negative publicity, our association with such clients may, in turn, cause us to be subject to negative publicity, which could harm our reputation and the public perception of our business. Any of these conditions could adversely affect our business, financial condition and results of operations.
Fulfilling our public company financial reporting and other regulatory obligations and transitioning to a public company will be expensive and time consuming and may strain our resources.
As a public company, we will be subject to the reporting requirements of the Exchange Act and will be required to implement specific corporate governance practices and adhere to a variety of reporting requirements under the Sarbanes-Oxley Act and the related rules and regulations of the SEC, as well as the rules of NYSE. The Exchange Act will require us to file annual, quarterly and current reports with respect to our business and financial condition. The Sarbanes-Oxley Act will require, among other things, that we maintain effective disclosure controls and procedures and internal control over financial reporting. Compliance with these requirements will place additional demands on our legal, accounting, finance, operations and investor relations staff and on our accounting, financial and information systems, and will increase our legal and accounting compliance costs as well as our compensation expense as we expect to hire additional legal, accounting, tax, finance and investor relations staff. As a public company we may need to enhance our investor relations and corporate communications functions and attract additional qualified board members. These additional efforts may strain our resources and divert managements attention from other business concerns, which could have a material adverse effect on our business, financial condition and results of operations. We expect to incur additional incremental ongoing and one-time expenses in connection with our transition to a public company. The actual amount of the incremental expenses we will incur may be higher, perhaps significantly, from our current estimates for a number of reasons, including, among others, additional costs we may incur that we have not currently anticipated.
In accordance with Section 404 of the Sarbanes-Oxley Act, our management will be required to conduct an annual assessment of the effectiveness of our internal control over financial reporting and include a report on these internal controls in the annual reports we will file with the SEC on Form 10-K. Our independent registered public accounting firm will not be required to formally attest to the effectiveness of our internal controls until we are no longer an emerging growth company and no longer a non-accelerated filer. When required, this process will require significant documentation of policies, procedures and systems, review of that documentation by our internal auditing and accounting staff and our outside independent registered public accounting firm and testing of our internal control over financial reporting by our internal auditing and accounting staff and our outside independent registered public accounting firm. This process will involve considerable time and attention, may
37
Table of Contents
strain our internal resources and will increase our operating costs. We may experience higher than anticipated operating expenses and outside auditor fees during the implementation of these changes and thereafter. If our independent registered public accounting firm is unable to express an opinion as to the effectiveness of our internal control over financial reporting, investors may lose confidence in the accuracy and completeness of our financial reports and the market price of our Class A common stock could be negatively affected, and we could become subject to investigations by NYSE, the SEC or other regulatory authorities, which could require additional financial and management resources.
We have not performed an evaluation of our internal control over financial reporting nor have we engaged our independent registered public accounting firm to perform an audit of our internal control over financial reporting, in each case as contemplated by Section 404 of the Sarbanes-Oxley Act, as of any balance sheet date reported in our financial statements. Had we performed such an evaluation of our internal control over financial reporting or had our independent registered public accounting firm performed an audit of our internal control over financial reporting, control deficiencies, including material weaknesses and significant deficiencies, may have been identified.
If we are unable to meet the demands that will be placed upon us as a public company, including the requirements of the Sarbanes-Oxley Act, we may be unable to accurately report our financial results, or report them within the time frames required by law or stock exchange regulations. Failure to comply with the Sarbanes-Oxley Act, when and as applicable, could also potentially subject us to sanctions or investigations by the SEC or other regulatory authorities. If material weaknesses or other deficiencies occur, our ability to accurately and timely report our financial position could be impaired, which could result in late filings of our annual and quarterly reports under the Exchange Act, restatements of our consolidated financial statements, a decline in our stock price, or suspension or delisting of our Class A common stock from NYSE and could have a material adverse effect on our business, results of operations and financial condition. Even if we are able to report our financial statements accurately and in a timely manner, any failure in our efforts to implement the improvements or disclosure of material weaknesses in our future filings with the SEC could cause our reputation to be harmed and our stock price to decline significantly.
Operational Risks
We are subject to operational risk, which could adversely affect our business and reputation and create material legal and financial exposure.
Like all businesses, we are subject to operational risk, which represents the risk of loss resulting from human error or misconduct, inadequate or failed internal processes and systems, and external events, including the risk of loss resulting from fraud by employees or persons outside the Bank, and breaches in data security. Because the Bank engages in a high volume of funds transfer activity, we may be subject to a greater degree of payment risk than other similarly-sized banks. Our political organization clients use our payment services heavily leading up to elections, and the payment size for such payments is typically much larger than for retail banking payment services. The Bank frequently receives or sends payment orders that are a high percentage of its total capital, and on a few occasions in the past it has sent and received, and in the future it may send and receive, payment orders that exceed the Banks total capital. Processing errors by employees of the Bank or violations of related regulations could lead to a significant financial loss and legal liability.
We are also exposed to the above-referenced operational risks through outsourcing arrangements, as such outsourcing vendors, which are exposed to operational risks themselves, as well as the effects that changes in circumstances or capabilities of our outsourcing vendors can have on our ability to continue to perform operational functions necessary to our business.
Although we seek to mitigate operational risk through a system of internal controls that are reviewed and updated, no system of controls, however well designed and maintained, is infallible. Control weaknesses or failures or other operational risks could result in charges, increased operational costs, harm to our reputation or foregone business opportunities.
38
Table of Contents
The occurrence of fraudulent activity, breaches or failures of our information security controls or cybersecurity-related incidents could have a material adverse effect on our business, financial condition and results of operations.
As a financial institution, we are susceptible to fraudulent activity, information security breaches and cybersecurity-related incidents that may be committed against us, our service providers or our clients, which may result in financial losses or increased costs to us or our clients, disclosure or misuse of our information or our client information, misappropriation of assets, litigation or damage to our reputation. Such fraudulent activity may take many forms, including check fraud, electronic fraud, wire fraud, phishing, social engineering and other dishonest acts. Information security breaches and cybersecurity-related incidents may include fraudulent or unauthorized access to systems used by us, our service providers or our clients, denial or degradation of service attacks, ransomware, malware or other cyberattacks or human error. In recent periods, several large corporations, including financial institutions and retail companies, have suffered major data breaches, in some cases exposing not only confidential and proprietary corporate information but also sensitive financial and other personal information of their clients and employees and potentially subjecting them to fraudulent activity. Our clients are subject to risks related to identity theft, credit and debit card fraud and other fraudulent activity that could involve their accounts with us. We have in the past been, and may in the future be, the target of attempted electronic fraudulent activity, security breaches and cybersecurity-related attacks. The increased use of mobile and cloud technologies, as well as remote work arrangements, can heighten these and other operational risks, and because we do not maintain a branch network and instead rely more heavily on our mobile and desktop applications to provide services to our clients, the consequences of fraudulent activity, information security breaches and cybersecurity-related incidents may be more severe for us compared to other banks. All of this could have a material adverse effect on our business, financial condition and results of operations.
In addition, increases in criminal activity levels and sophistication, advances in computer capabilities, new discoveries, vulnerabilities in third-party technologies (including browsers and operating systems) or other developments could result in a compromise or breach of the technology, processes and controls that we use to prevent fraudulent transactions and to protect data about us, our clients and underlying transactions, as well as the technology used by our employees, third-party service providers and clients to access our systems. For example, we are exposed to risks arising from the use of artificial intelligence (AI) technologies by bad actors to commit fraud and misappropriate funds and to facilitate cyberattacks.
Although we have developed, and continue to invest in, systems and processes that are designed to detect and prevent security breaches and cyberattacks, our inability to anticipate, or failure to timely discover and adequately mitigate, breaches of security could result in: losses to us or our clients; our loss of business and/or clients; damage to our reputation; the incurrence of additional expenses; disruption to our business; our inability to grow our online services or other businesses; additional regulatory scrutiny or penalties; or our exposure to civil litigation and possible financial liability. Any such costs, losses or claims may not be covered by our insurance or could exceed the amount of insurance coverage available to us, which could have a material adverse effect on our business, financial condition and results of operations.
More generally, publicized information concerning information security and cybersecurity-related problems could inhibit the use or growth of electronic or web-based applications or solutions as a means of conducting commercial transactions. Such publicity may also cause damage to our reputation as a financial institution. All of this could have a material adverse effect on our business, financial condition and results of operations.
We also face risks related to cyberattacks and other security breaches involving external, third-party vendors and counterparties.
Information pertaining to us and our clients is maintained, and transactions are executed, on networks and systems maintained by us, our clients and certain of our third-party vendors, such as our online banking or reporting systems. The secure maintenance and transmission of confidential information, as well as execution of transactions over these systems, are essential to protect us and our clients against fraud and security breaches and
39
Table of Contents
to maintain our clients confidence. Some of these parties have in the past been, and may in the future be, the target of security breaches and cyberattacks, and because the transactions involve third parties and environments such as the point of sale that we do not control or secure, future security breaches or cyberattacks affecting any of these third parties could impact us through no fault of our own, and in some cases we may have exposure and suffer losses for material breaches or attacks relating to them. Although we are not aware of any material losses relating to cybersecurity incidents, there can be no assurance that unauthorized access or cybersecurity incidents will not become known or occur or that we will not suffer such losses in the future.
Additionally, we may not be able to ensure that our third-party vendors have appropriate controls in place to protect the confidentiality of the information they receive from us and our business, financial condition and results of operations could be adversely affected by a material breach of, or disruption to, the security of any of our or our vendors systems.
Our operations rely on certain external vendors, and our use of these vendors is subject to increasing regulatory requirements and attention.
Our business model of a single banking office serving a nationwide client base is dependent on relationships with third-party service providers that provide services, primarily information technology services, that are critical to our operations. We use external vendors to provide products and services necessary to maintain our day-to-day operations, including core banking services such as online banking, loan servicing, debit and credit card services, trust accounting and wealth management and other key components of our business infrastructure, including data processing and storage, internet connection and network access and various information technology services and services complementary to our banking products. In particular, we rely on a core technology provider for the banking software used by our clients and operations personnel. Accordingly, our operations are exposed to the risk that these vendors, including our core technology provider, will not perform in accordance with the contracted arrangements or under service-level agreements.
We are also exposed to the risk that a cyberattack, security breach, other information technology incident or other operational disruption at a common vendor to our third-party service providers, including our core technology provider, could impede their ability to provide services to us. See We also face risks related to cyberattacks and other security breaches involving external, third-party vendors and counterparties.
We may not be able to effectively monitor or mitigate operational risks relating to the use of common vendors by third-party service providers, including our core technology provider. If any of our third-party service providers experience difficulties in providing services or terminate their services and we are unable to replace our service providers with other service providers, our operations could be interrupted. It may be difficult for us to replace some of our third-party vendors, particularly vendors providing our core banking, mortgage-servicing and debit card services and information services, in a timely manner if they are unwilling or unable to provide us with these services in the future for any reason. If an interruption were to continue for a significant period, it could have a material adverse effect on our business, financial condition and results of operations. Even if we are able to replace them, it may be at higher cost to us, which could have a material adverse effect on our business, financial condition and results of operations. In addition, if a third-party provider fails to provide the services we require, fails to meet contractual requirements, such as compliance with applicable laws and regulations, or suffers a cyberattack or other security breach, our business could suffer economic and reputational harm that could have a material adverse effect on our business, financial condition and results of operations.
Furthermore, recent regulation requires us to enhance our due diligence, ongoing monitoring and control over our third-party vendors and other ongoing third-party business relationships. In certain cases, we may be required to renegotiate our agreements with these vendors to meet these enhanced requirements, which could increase our costs. We expect that our regulators would hold us responsible for deficiencies in our oversight and control of our third-party relationships and in the performance of the parties with which we have these relationships, including in connection with the improper use or disclosure of confidential information, which could also harm our reputation, financial position and current and future business relationships. As a result, if our
40
Table of Contents
regulators conclude that we have not exercised adequate oversight and control over our third-party vendors or other ongoing third-party business relationships or that such third parties have not performed appropriately, we could be subject to enforcement actions, including civil money penalties or other administrative or judicial penalties or fines, as well as requirements for client remediation, any of which could have a material adverse effect our business, financial condition and results of operations. In June 2023, the U.S. federal banking agencies issued an interagency guidance, which requires banks, such as us, to analyze the risk associated with each third-party relationship and to calibrate its risk management processes. Any future changes in requirements or standards applicable to our third-party relationships could negatively affect us in substantial and unpredictable ways, and increase our costs. All of which could have a material adverse effect on our business, financial condition and results of operations.
The development and use of artificial intelligence present risks and challenges that may adversely impact our business.
We have incorporated, and our third-party vendors, clients or counterparties may develop or incorporate, AI technology in certain business processes, services or products. The development and use of AI present a number of risks and challenges to our business. The legal and regulatory environment relating to AI is uncertain and rapidly evolving and includes regulation targeted specifically at AI as well as provisions in intellectual property, privacy, consumer protection, employment and other laws applicable to the use of AI. These evolving laws and regulations could require changes in our implementation of AI technology and increase our compliance costs and the risk of non-compliance. AI models, particularly generative AI models, may produce output or take action that is incorrect, that results in the release of private, confidential or proprietary information, that reflects biases included in the data on which they are trained, infringes on the intellectual property rights of others, or that is otherwise harmful. In addition, the complexity of many AI models makes it challenging to understand why they are generating particular outputs. This limited transparency increases the challenges associated with assessing the proper operation of AI models, understanding and monitoring the capabilities of the AI models, reducing erroneous output, eliminating bias and complying with regulations that require documentation or explanation of the basis on which decisions are made. Further, we may rely on AI models developed by third parties, and, to that extent, would be dependent in part on the manner in which those third parties develop and train their models, including risks arising from the inclusion of any unauthorized material in the training data for their models, and the effectiveness of the steps these third parties have taken to limit the risks associated with the output of their models, matters over which we may have limited visibility. Any of these risks could expose us to liability or adverse legal or regulatory consequences and harm our reputation and the public perception of our business or the effectiveness of our security measures.
We depend on the accuracy and completeness of information about clients and counterparties.
In deciding whether to extend credit or enter into other transactions, and in evaluating and monitoring our loan and lease portfolio on an ongoing basis, we typically rely on information furnished by or on behalf of clients and counterparties, including financial statements, credit reports and other financial information. We may also rely on representations of those clients or counterparties, or of other third parties, such as independent auditors, as to the accuracy and completeness of that information. Reliance on inaccurate, incomplete, unaudited, fraudulent or misleading financial statements, credit reports or other financial or business information, or the failure to receive such information on a timely basis, could result in loan and lease losses, reputational damage or other effects that could have a material adverse effect on our business, financial condition and results of operations.
Our reliance on accounting estimates and risk management framework may not always prevent or mitigate risks effectively, leading to potential differences between actual results and our forecasts.
Our accounting policies and methods are fundamental to how we record and report our financial condition and results of operations. Our management must exercise judgment in selecting and applying many of these accounting policies and methods so they comply with GAAP and reflect managements judgment of the most
41
Table of Contents
appropriate manner to report our financial condition and results. In some cases, management must select the accounting policy or method to apply from two or more alternatives, any of which may be reasonable under the circumstances, yet which may result in our reporting materially different results than would have been reported under a different alternative.
Certain accounting policies are critical to presenting our financial condition and results of operations. They require management to make difficult, subjective or complex judgments about matters that are uncertain. Materially different amounts could be reported under different conditions or using different assumptions or estimates. These critical accounting policies include the allowance for loan and lease losses, revenue and expense recognition, goodwill, fair value measurements and income taxes. Because of the uncertainty of estimates involved in these matters, we may be required to significantly increase the allowance for credit losses or sustain losses that are significantly higher than the reserve provided or reduce the carrying value of an asset measured at fair value. Any of these could have a material adverse effect on our business, financial condition and results of operations. See Managements Discussion and Analysis of Financial Condition and Results of Operations Critical Accounting Policies and Estimates.
Our internal controls, disclosure controls, processes and procedures and corporate governance policies and procedures are based in part on certain assumptions and can provide only reasonable (not absolute) assurances that the objectives of the system are met. Any failure or circumvention of our controls, processes and procedures or failure to comply with regulations related to controls, processes and procedures could necessitate changes in those controls, processes and procedures, which may increase our compliance costs, divert management attention from our business or subject us to regulatory actions and increased regulatory scrutiny.
We have established policies and procedures intended to identify and manage the types of risk to which we are subject, including credit risk, interest rate risk, liquidity risk, price risk, operational risk, cyber risk, compliance risk, strategic risk and reputation risk. There are inherent limitations to our risk management strategies as there may exist, or develop in the future, risks that were not appropriately anticipated or identified. In addition, we rely on both qualitative and quantitative factors, including models, to monitor, measure and analyze certain risks and to estimate certain financial values, which are subject to error. If our risk management framework proves ineffective, we could become subject to litigation or negative regulatory action, and we could suffer unexpected losses that could affect our business, financial condition, or results of operations.
Legal, Regulatory and Compliance Risks
Government regulation significantly affects our business and may result in higher costs and lower stockholder returns.
The banking industry is heavily regulated. Banking regulations are primarily intended to protect the federal deposit insurance fund (DIF), depositors, and consumers, not stockholders. The Bank is regulated and supervised by the OCC and the FDIC. The Company is regulated by the Federal Reserve. The burden imposed by federal regulations puts banks at a competitive disadvantage compared to less regulated competitors such as nonbank finance companies, mortgage-banking companies, digital fin-tech lenders, and leasing companies. Changes in the laws, regulations, and regulatory practices affecting the banking industry may increase the costs of doing business or otherwise adversely affect the Bank and create competitive advantages for others. Regulations affecting banks and financial services companies undergo continuous change, and we cannot predict the ultimate effect of these changes, which could have a material adverse effect on profitability or financial condition. In addition, changes to other laws or regulations, such as tax laws, could also have a disproportionate impact on us, based on the way those laws or regulations are applied to financial services and financial firms or due to our corporate structure or where or how we provide these services.
Changes in federal and state legislation and regulation may affect our operations. New and modified regulations, such as the regulations promulgated pursuant to the Dodd-Frank Wall Street Reform and Consumer Protection Act, or the Dodd-Frank Act, and the rules adopted by the federal banking agencies under the
42
Table of Contents
December 2010 framework of the Basel Committee on Banking Supervision, or the Basel III Rules, may have unforeseen or unintended consequences on the banking industry. The Dodd-Frank Act implemented significant changes to the U.S. financial system, including new regulatory agencies (such as the Financial Stability Oversight Committee to oversee systemic risk and the Consumer Financial Protection Board (CFPB), to develop and enforce rules for consumer financial products), changes in retail banking regulations, and changes to deposit insurance assessments. Additionally, the Basel III Rules have revised risk-based and leverage capital requirements and also limits capital distributions and certain discretionary bonuses if a banking organization does not hold a capital conservation buffer. This additional regulation increases Bank compliance costs and may otherwise adversely affect operations. The potential also exists for additional federal or state laws or regulations, or changes in policy or interpretations, to affect operations, including capital levels, lending and funding practices, insurance assessments, and liquidity standards. The effect of any such changes and their interpretation and application by regulatory authorities cannot be predicted, may increase the Companys cost of doing business and otherwise affect operations, may significantly affect the markets in which the Company does business, and could have a material adverse effect on the Company.
In addition, in response to the recent bank failures and loss of public confidence in the banking sector, the government has increased its scrutiny of financial institutions. State and federal lawmakers and regulators have proposed new measures and regulations regarding capital levels, deposit concentrations, liquidity, risk management and deposit insurance. Such legal and regulatory changes could materially and adversely affect our business, results of operations or financial condition. The governments response to the condition of the global financial markets and the banking industry has also increased costs and may further increase costs for items such as federal deposit insurance. The FDIC insures deposits at FDIC-insured institutions, such as the Bank, up to applicable limits. The FDIC charges the insured financial institutions premiums to maintain the DIF at a minimum of 2% of total estimated insured deposits. Increases in deposit insurance premiums to increase the coverage ratio to required levels, to meet revised rules to measure risk or to pay depositors of additional failed institutions could adversely affect the Companys financial condition and results of operations.
We are also exposed to risks resulting from changes in public policy, laws and regulations, or market and public perceptions and preferences in connection with the transition to a less carbon-dependent economy. These changes could adversely affect our business, financial condition, results of operations and reputation. For example, our reputation and client relationships may be damaged as a result of our or our clients involvement in certain industries or projects perceived to be associated with causing or exacerbating climate change.
The failure to fully comply with applicable laws and regulations, particularly those related to consumer compliance and lending, could result in additional regulatory scrutiny being placed on the Bank, the Company or the Bank being subjected to informal or formal enforcement actions, or the imposition of civil money penalties against the Company, the Bank, and/or their respective officers or directors. Even if the Company or the Bank avoided such enforcement actions following a compliance lapse, expenses required to come into compliance and maintain such compliance, and to avoid any threatened enforcement action, could have an adverse effect on earnings, divert management attention from other opportunities and otherwise adversely affect stockholder returns.
Litigation and regulatory actions, including possible enforcement actions, could subject us to significant fines, penalties, judgments, or restrictions on our business activities.
We have in the past been, and may in the future be, named as a defendant in legal actions in connection with our activities. Legal actions could include claims for substantial compensatory or punitive damages or claims for indeterminate amounts of damages. For example, in 2020, a lawsuit alleged that the Bank improperly returned a wire transfer in the amount of $456.9 million and remained obligated to pay that sum. While the lawsuit was dismissed in our favor, we incurred significant legal expenses in connection with the lawsuit, and there can be no assurance that the outcome of any future lawsuit will be favorable.
43
Table of Contents
The Banks Trust & Wealth Department is particularly subject to the risk that clients or others may sue us, claiming that we or third parties for whom they say we are responsible have failed to perform under a contract or otherwise failed to carry out a duty perceived to be owed to them. This risk is heightened when we act as a fiduciary for our clients and may be further heightened during periods when credit, equity or other financial markets are deteriorating in value or are particularly volatile, or when clients or investors are experiencing losses. Further, our Trust & Wealth Department offers certain specialized trust services, such as special needs trusts, that may subject us to an increased risk of legal liability. See Risks Related to Our Business Our Trust & Wealth Department exposes us to certain risks and there can be no assurances the department will contribute meaningfully to our revenues or become profitable on a standalone basis.
Further, in the future our regulators may impose consent orders, civil money penalties, matters requiring attention, or similar types of supervisory criticism. We may also, from time to time, be the subject of subpoenas, requests for information, reviews, investigations and proceedings (both formal and informal) by governmental agencies regarding our activities.
Any such legal or regulatory actions may subject us to substantial compensatory or punitive damages, significant fines, penalties, obligations to change our business practices or other requirements, resulting in increased expenses, diminished income and damage to our reputation. Our involvement in any such matters, whether tangential or otherwise and even if the matters are ultimately determined in our favor, could also cause significant harm to our reputation and divert management attention from the operation of our business. Further, any settlement, consent order or adverse judgment in connection with any formal or informal proceeding or investigation by government agencies may result in litigation, investigations or proceedings as other litigants and government agencies begin independent reviews of the same activities. As a result, the outcome of legal and regulatory actions could have an adverse effect on our business, results of operations and results of operations.
The Banks primary regulator has broad powers to place limitations on the conduct of a banks business, or to close an institution.
The OCC has broad supervisory powers to limit a banks conduct of its business in the event that its capital position or financial condition decline, or if it engages in unsafe or unsound practices. Such powers include the ability to limit distributions of dividends. As a result of capital insufficiency, including but not limited to if a banks level of Tier 1 capital falls below 2%, becoming undercapitalized with no reasonable prospect of becoming adequately capitalized, liquidity issues or other regulatory concerns, including engaging in unsafe or unsound banking practices or being in an unsafe or unsound condition, a bank could be subject to the imposition of additional restrictions or conditions on its operation, or to being closed by its regulators without compensation to the banks stockholders, including its bank holding company. If the Bank were to be closed by its regulators, there can be no assurance that the Company would be able to find a buyer for the Company or the Bank in the event that it is unable to continue as an independent entity.
Generally, a conservator or receiver may be appointed for an insured depository institution where: (1) its obligations exceed its assets; (2) there is substantial dissipation of the institutions assets or earnings as a result of any violation of law or any unsafe or unsound practice; (3) the institution is in an unsafe or unsound condition; (4) there is a willful violation of a cease-and-desist order; (5) the institution is unable to pay its obligations in the ordinary course of business; (6) losses or threatened losses deplete all or substantially all of an institutions capital, and there is no reasonable prospect of becoming adequately capitalized without assistance; (7) there is any violation of law or unsafe or unsound practice or condition that is likely to cause insolvency or substantial dissipation of assets or earnings, weaken the institutions condition, or otherwise seriously prejudice the interests of depositors or the insurance fund; (8) an institution ceases to be insured; (9) the institution is undercapitalized and has no reasonable prospect that it will become adequately capitalized, fails to become adequately capitalized when required to do so, or fails to submit or materially implement a capital restoration plan; or (10) the institution is critically undercapitalized or otherwise has substantially insufficient capital.
44
Table of Contents
We face significant risks of non-compliance and potential enforcement actions under the Bank Secrecy Act and other anti-money laundering statutes and regulations.
The Bank Secrecy Act of 1970, the Uniting and Strengthening America by Providing Appropriate Tools to Intercept and Obstruct Terrorism Act of 2001 (USA PATRIOT Act), and other related laws and regulations impose extensive anti-money laundering (AML) requirements on financial institutions. These regulations mandate the establishment and maintenance of effective AML programs, including customer due diligence, ongoing monitoring, and the filing of required reports, such as suspicious activity reports and currency transaction reports.
Federal and state banking regulators, the Financial Crimes Enforcement Network, and other government agencies are authorized to impose significant civil money penalties and other sanctions for violations of AML requirements. Additionally, our operations are also subject to regulations enforced by the Office of Foreign Assets Control (OFAC), which can impose fines, civil money penalties and other regulatory actions for deficiencies in our OFAC compliance program. Such actions may include restrictions on business operations, the ability to pay dividends, mergers and acquisitions activity, expansion, and entering new business lines.
Regulatory expectations for AML and OFAC compliance are increasingly stringent. Failure to meet these regulatory expectations can result in heightened scrutiny, increased regulatory actions, and significant penalties. If a financial institutions risk assessments, customer due diligence, monitoring systems, or other aspects of its AML and OFAC compliance programs fail to comply with AML or OFAC requirements or fail to meet these regulatory expectations, it can result in heighted scrutiny, regulatory actions, including substantial fines, penalties or restrictions on our operations, or reputational damage. These consequences could materially adversely affect our business, financial condition, or results of operations.
The Bank is subject to numerous fair and responsible banking laws designed to protect consumers, and failure to comply with these laws could lead to a wide variety of sanctions.
The Community Reinvestment Act (CRA), the Equal Credit Opportunity Act (ECOA), the Fair Housing Act (FHA) and other fair lending laws and regulations, including state laws and regulations, prohibit discriminatory lending practices by financial institutions. The Federal Trade Commission Act and the Dodd-Frank Act prohibit unfair, deceptive, or abusive acts or practices by financial institutions. The U.S. Department of Justice, federal banking agencies, and other federal and state agencies are responsible for enforcing these fair and responsible banking laws and regulations. A challenge to an institutions compliance with fair and responsible banking laws and regulations could result in a wide variety of sanctions, including damages and civil money penalties, injunctive relief, restrictions on mergers and acquisitions activity, restrictions on expansion, and restrictions on entering new business lines. Private parties may also have the ability to challenge an institutions performance under fair lending laws in private class action litigation. Such actions could have a material adverse effect on the Banks reputation, business, financial condition and results of operations.
We engage in lending secured by real estate and may be forced to foreclose on the collateral and own the underlying real estate, subjecting us to potential costs, risks and consumer protection laws.
Since we originate loans secured by real estate, we may have to foreclose on the collateral property to protect our investment and may thereafter own and operate such property. The amount that we, as a mortgagee, may realize after a foreclosure depends on factors outside of our control, including, but not limited to, general or local economic conditions, assessments, interest rates, real estate tax rates, condition of the collateral property, operating expenses of the mortgaged properties, our ability to obtain and maintain adequate occupancy of the properties, zoning laws, environmental cleanup liabilities, governmental and regulatory rules and natural disasters. Our inability to manage the amount of costs or size of the risks associated with the ownership of real estate, or write-downs in the value of our other real estate owned, could have a material adverse effect on our business, financial condition and results of operations.
45
Table of Contents
Consumer protection initiatives or changes in state or federal law may substantially increase the time and expenses associated with the foreclosure process or prevent us from foreclosing at all. A number of states in recent years have either considered or adopted foreclosure reform laws that make it substantially more difficult and expensive for lenders to foreclose on properties in default. Additionally, federal and state regulators have prosecuted or pursued enforcement action against a number of mortgage-servicing companies for alleged consumer law violations. If new federal or state laws or regulations are ultimately enacted that significantly raise the cost of foreclosure or raise outright barriers to foreclosure, they could have a material adverse effect on our business, financial condition and results of operations.
Additionally, if the Bank forecloses on, and takes title to, real estate, it may become subject to environmental liabilities associated with such properties, which could adversely affect our business, financial condition and results of operations. We may be liable for remediation costs, as well as for personal injury and property damage, civil fines and criminal penalties regardless of when the hazardous conditions or toxic substances first affected the property. Environmental laws may require us to incur substantial expenses to address unknown liabilities and may materially reduce the affected propertys value or limit our ability to use or sell the affected property. In addition, future laws or more stringent interpretations or enforcement policies with respect to existing laws may increase our exposure to environmental liability, and we may not have adequate remedies against the prior owner or other responsible parties and could find it difficult or impossible to sell the affected properties.
Any violation of laws regarding, or incidents involving, the privacy, information security and protection of personal, confidential or proprietary information could damage our reputation and otherwise adversely affect our business.
The Banks business requires the collection and retention of large volumes of client data, including personally identifiable information (PII) in various information systems that it maintains and in those maintained by third-party service providers. It also maintains important internal company data such as PII about employees and information relating to operations. The Bank is subject to complex and evolving laws and regulations governing the privacy and protection of PII of individuals (including clients, employees, and other third parties). These include the Gramm-Leach-Bliley Act, which, among other things: (1) imposes certain limitations on the Banks ability to share nonpublic PII about clients with nonaffiliated third parties; (2) requires that it provide certain disclosures to clients about its information collection, sharing and security practices and afford clients the right to opt out of any information sharing by us with nonaffiliated third parties (with certain exceptions); and (3) requires that it develop, implement, and maintain a written comprehensive information security program containing appropriate safeguards based on size and complexity, the nature and scope of activities, and the sensitivity of client information the Bank processes, as well as plans for responding to data security breaches. Various federal and state banking regulators and states have also enacted data breach notification requirements with varying levels of individual, consumer, regulatory or law enforcement notification in the event of a security breach. Ensuring that the collection, use, transfer, and storage of PII complies with all applicable laws and regulations can increase costs. Furthermore, the Bank may not be able to ensure that clients and other third parties have appropriate controls in place to protect the confidentiality of the information that they exchange, particularly where such information is transmitted by electronic means. If personal, confidential or proprietary information of clients or others were to be mishandled or misused (in situations where, for example, such information was erroneously provided to parties who are not permitted to have the information, or where such information was intercepted or otherwise compromised by third parties), the Bank could be exposed to litigation or regulatory sanctions under privacy and data protection laws and regulations. Concerns regarding the effectiveness of measures to safeguard PII, or even the perception that such measures are inadequate, could cause the Bank to lose clients or potential clients and thereby reduce revenues. Accordingly, any failure, or perceived failure to comply with applicable privacy or data protection laws and regulations may subject the Bank to inquiries, examinations and investigations that could result in requirements to modify or cease certain operations or practices or in significant liabilities, fines or penalties, and could damage its reputation and otherwise adversely affect its operations, financial condition and results of operations.
46
Table of Contents
Increases in FDIC insurance premiums could adversely affect our earnings and results of operations.
The Bank is a member of the FDIC and the deposits of each of its depositors are insured to the maximum amount provided by the Federal Deposit Insurance Act (FDIA), subject to the Banks payment of deposit insurance premiums to the FDIC. The FDIC calculates assessment rates applicable to the Bank based on a variety of factors, including capital adequacy, asset quality, management practices, earnings performance, liquidity, and sensitivity to market risk. Any deterioration of these factors could result in an increase in the Banks FDIC assessment rate. In addition, to maintain a strong funding position and restore the reserve ratios of the DIF following the financial crisis, the FDIC increased deposit insurance assessment rates generally and, in response to recent bank failures, charged special assessments applicable to certain FDIC-insured financial institutions. Further increases in assessment rates or special assessments may occur in the future, especially if there are significant additional financial institution failures. Any future special assessments, increases in assessment rates or required prepayments in FDIC insurance premiums could reduce our profitability or limit our ability to pursue certain business opportunities, which could have a material adverse effect on our business, financial condition and results of operations.
The Federal Reserve may require us to commit capital resources to support the Bank at a time when our resources are limited, which may require us to borrow funds or raise capital on unfavorable terms.
The Company is required by the Federal Reserve to act as a source of financial and managerial strength to the Bank and may be required to commit capital and financial resources to support the Bank. Such support may be required at times when, absent this requirement, the Company otherwise might determine not to provide it, including because our resources may be limited, and we may be required to borrow the funds or raise capital to make the required capital injection. Any loan by the Company to the Bank would be subordinate in right of repayment to payments to depositors and certain other creditors of the Bank. In the event of the Companys bankruptcy, the bankruptcy trustee will assume any commitment by the Company to a federal bank regulatory agency to maintain the capital of the Bank. Moreover, bankruptcy law provides that claims based on any such commitment will be entitled to a priority of payment over the claims of the Companys general unsecured creditors, including the holders of any note obligations. Thus, any borrowing by the Company for making a capital injection to the Bank may be more difficult and expensive relative to other corporate borrowings. Borrowing funds or raising capital on unfavorable terms for such a capital injection may have a material adverse effect on our business, financial condition and results of operations.
Changes in our accounting policies or in accounting standards could materially affect how we report our financial results and condition.
From time to time, the accounting standard setters, including the Financial Accounting Standards Board (FASB) and the SEC, change the financial accounting and reporting standards that govern the preparation of our financial statements. These changes can be difficult to predict and can materially impact how we record and report our financial condition and results of operations. As a result of changes to financial accounting or reporting standards, we could be required to change certain of the assumptions or estimates we have previously used in preparing our financial statements, which could negatively impact how we record and report our results of operations and financial condition generally. In some instances, we could be required to apply a new or revised standard retroactively, resulting in the restatement of prior period financial statements.
Risks Related to Our Dual Class Common Stock Structure
The dual class structure of our common stock has the effect of concentrating voting power with the holders of our Class B common stock, including the members of the Fitzgerald Family, which will limit or preclude your ability to influence corporate matters.
Upon the completion of the offering, we will have two classes of common stock:
| | Class A common stock, par value $0.01 per share, which is entitled to one vote per share; and |
| | Class B common stock, par value $0.01 per share, which is entitled to 10 votes per share. |
47
Table of Contents
As of the date of this prospectus, members of the Fitzgerald Family, in the aggregate, beneficially own 50.69% of the outstanding shares of our old common stock. Following the Reclassification and the completion of this offering, assuming no conversions of shares of Class B common stock into shares of Class A common stock, the holders of our outstanding Class B common stock will hold % (or % assuming the underwriters exercise their option to purchase additional shares of our Class A common stock from us in full) of the combined voting power of our outstanding common stock, with the members of the Fitzgerald Family in the aggregate beneficially owning % (or % assuming the underwriters exercise their option to purchase additional shares of our Class A common stock from us in full) of the combined voting power of our outstanding common stock. While the combined voting power of the shares held by members of the Fitzgerald Family, when aggregated, will exceed 50%, the members of the Fitzgerald Family are not party to any voting agreement or other arrangement or understanding regarding the voting of our shares and have no present intention to act together for any purpose.
This concentrated control by holders of our Class B common stock, including members of the Fitzgerald Family, will limit or preclude your ability to influence corporate matters for the foreseeable future, including the election of directors, amendments of our organizational documents, and any merger, consolidation, sale of all or substantially all of our assets, or other major corporate transaction requiring stockholder approval, subject to the protections that will be provided in the Charter for holders of our Class A common stock. In addition, the dual class structure may prevent or discourage unsolicited acquisition proposals or offers for our capital stock that you may feel are in your best interests as one of our stockholders.
In addition, pursuant to the terms of our Charter, some stockholders may over time voluntarily convert shares of Class B common stock to Class A common stock and some shares of Class B common stock may automatically convert into shares of Class A common stock under certain circumstances, including upon certain transfers (such as a transfer in connection with a sale). As such conversions occur, the converted shares of Class B common stock with 10 votes per share will be converted into shares of Class A common stock carrying only one vote per share. Accordingly, stockholders who continue to hold Class B common stock will, by virtue of the reduction of the number of outstanding shares of Class B common stock and the consequent reduction in the total number of votes, realize an increase in their relative voting power. As a result, there is a possibility that the degree of voting control of our Chairman, Peter G. Fitzgerald, and the other members of the Fitzgerald Family, may substantially increase over time.
Members of the Fitzgerald Family and other holders of Class B common stock could aggregate their holdings and sell a controlling interest in us to a third party in a private transaction.
Following the completion of this offering, members of the Fitzgerald Family in the aggregate will beneficially own shares of our common stock representing a substantial proportion, which may constitute a majority, of the voting power with respect to all of the outstanding shares of our common stock. Currently, the members of the Fitzgerald Family are not party to any voting agreement or other arrangement or understanding regarding the voting of our shares and have no present intention to act together for any purpose. However, in the future, should they choose to do so, the members of the Fitzgerald Family and other holders of Class B common stock could aggregate their holdings, subject to the limitations set forth in the Change in Bank Control Act of 1978 (the CIBC Act) and the Charter, to sell some or all of its shares of our common stock, including our Class A common stock, in a privately negotiated transaction, which, if sufficient in size, could result in a change of control of our company. However, subject to certain exceptions, any transfer of Class B common stock to a third party would cause, or require the optional conversion, of such shares into Class A common stock. Shares of Class A common stock are entitled to one vote per share, compared to 10 votes per share of Class B common stock. Accordingly, any acquirer of our common stock from members of the Fitzgerald Family and other holders of Class B common stock may not be able to exercise the same aggregate amount of voting power with respect to such shares.
The ability of the members of the Fitzgerald Family and other holders of Class B common stock to aggregate their shares and privately sell them, with no requirement for a concurrent offer to be made to acquire all of the shares of our outstanding common stock that will be publicly traded hereafter, could prevent you from
48
Table of Contents
realizing any change-of-control premium on your shares of our common stock that may accrue to members of the Fitzgerald Family and other holders of Class B common stock in such private sale of our common stock. In addition, if the members of the Fitzgerald Family and other holders of Class B common stock were to privately sell a significant equity interest in our company, we may become subject to the control of a presently unknown third party. Such third party may have interests that conflict with those of other stockholders. If there were to be such a change of control, it may adversely affect our ability to run our business as described in this prospectus and could have a material adverse effect on our business, financial condition and results of operations.
Conflicts of interest and other disputes may arise between the members of the Fitzgerald Family and us that may be resolved in a manner unfavorable to us and our other stockholders.
Conflicts of interest and other disputes may arise between the members of the Fitzgerald Family and us in connection with our past and ongoing relationships, and any future relationships we may establish in a number of areas, including, but not limited to, the following:
| | Competing Business Activities. Members of the Fitzgerald Family may also engage in activities where their interests conflict or are competitive with our or our other stockholders interests. These activities may include a Fitzgerald Family members interests in any transaction it may conduct with us, any sale by a Fitzgerald Family member of a substantial interest in us to a third party or any investments by the Fitzgerald Family member in, or business activities conducted by the Fitzgerald Family member for, one or more of our competitors. Any of these disputes or conflicts of interests that arise may be resolved in a manner adverse to us or to our stockholders other than the Fitzgerald Family member and their affiliates. As a result, our future competitive position and growth potential could be adversely affected. |
| | Business Opportunities. Members of the Fitzgerald Family or their affiliates may engage in a corporate opportunity in the same or similar lines of business in which we or our affiliates now engage or propose to engage or otherwise compete with us or our affiliates. As a result of competition, our future competitive position and growth potential could be adversely affected. |
While our Charter will provide certain protections for the holders of Class A common stock, these and other conflicts of interest and potential disputes could have a material adverse effect on our business, financial condition, results of operations or on the market price of our Class A common stock. See Description of Capital Stock and Certain Relationships and Other Related Party Transactions.
The multi-class structure of our common stock may adversely affect the trading market for our Class A common stock.
Certain stock index providers have excluded companies with multiple classes of shares of common stock from being added to certain stock indices. Accordingly, the multi-class structure of our common stock would make us ineligible for inclusion in indices with such restrictions and, as a result, mutual funds, exchange-traded funds, and other investment vehicles that attempt to passively track those indices may not invest in our Class A common stock. In addition, several stockholder advisory firms and large institutional investors have been critical of the use of multi-class structures. Such stockholder advisory firms may publish negative commentary about our corporate governance practices or our capital structure, which may dissuade large institutional investors or other investors from purchasing shares of our Class A common stock. These actions could make our Class A common stock less attractive to other investors and may result in a less active trading market for our Class A common stock.
Risks Related to Our Class A Common Stock
No prior public market exists for our Class A common stock, and one may not develop.
Before this offering, there has not been a public trading market for our Class A common stock, and an active trading market may not develop or be sustained after this offering. If an active trading market does not develop, you may have difficulty selling your shares of Class A common stock at an attractive price or at all. The initial
49
Table of Contents
public offering price for our Class A common stock sold in this offering will be determined by negotiations among us and the underwriters. This price may not be indicative of the price at which our Class A common stock will trade after this offering. The market price of our Class A common stock may decline below the initial offering price, and you may not be able to sell your Class A common stock at or above the price you paid in this offering or at all.
The market price of shares of our common stock may be volatile or may decline regardless of our operating performance, which could cause the value of your investment to decline.
Even if a trading market develops, the market price of our Class A common stock may be highly volatile and could be subject to wide fluctuations. In addition, the trading volume on our Class A common stock may fluctuate and cause significant price variations to occur. If the market price of our Class A common stock declines significantly, you may be unable to resell your shares of Class A common stock at or above your purchase price, if at all. We cannot assure you that the market price of our Class A common stock will not fluctuate or decline significantly in the future. Stock markets and the price of our shares of Class A common stock may experience extreme price and volume fluctuations. Some, but certainly not all, of the factors that could negatively affect the price of our Class A common stock, or result in fluctuations in the price or trading volume of our Class A common stock, include:
| | general market conditions; |
| | domestic and international economic factors unrelated to our performance; |
| | variations in our quarterly operating results or failure to meet the markets earnings expectations; |
| | publication of research reports about us or the financial services industry in general; |
| | the failure of securities analysts to cover our Class A common stock after this offering; |
| | additions or departures of our key personnel; |
| | adverse market reactions to any indebtedness we may incur or securities we may issue in the future; |
| | actions by our stockholders; |
| | the expiration of contractual lock-up agreements; |
| | the operating and securities price performance of companies that investors consider to be comparable to us; |
| | changes or proposed changes in laws or regulations affecting our business; and |
| | actual or potential litigation and governmental investigations. |
In addition, if the market for stocks in our industry, or the stock market in general, experiences a loss of investor confidence, the trading price of the Class A common stock could decline for reasons unrelated to our business, financial conditions or results of operations. In the past, following periods of volatility in the overall market and the market price of a companys securities, securities class action litigation has often been instituted against these companies. This litigation, if instituted against us, could result in substantial costs and a diversion of our managements attention and resources.
Investors in this offering will experience immediate and substantial dilution of $ per share.
Purchasers of our Class A common stock in this offering will experience immediate and substantial dilution in the net tangible book value per share of Class A common stock for accounting purposes. After giving effect to the Reclassification and sale of shares of Class A common stock that we are offering (assuming the underwriters do not exercise their option to purchase additional shares) at an assumed initial public offering price of $ per share (the midpoint of the range set forth on the cover of this prospectus), the deduction of underwriting discounts and commissions and estimated offering expenses payable by us and the use of the net proceeds as described under Use of Proceeds, our pro forma as adjusted net tangible book value at March 31, 2024 would have been $ million, or $ per share of Class A common stock.
This represents an immediate increase in the pro forma as adjusted net tangible book value of $ per share to our existing owners and immediate dilution (i.e., the difference between the offering price and the adjusted pro forma net tangible book value after this offering) to new investors purchasing shares of Class A common stock in this offering of $ per share. See Dilution.
50
Table of Contents
We have broad discretion in the use of the net proceeds to us from this offering, and our use of these proceeds may not yield a favorable return on your investment.
We intend to use the net proceeds from this offering for general corporate purposes, which may include repaying debt, supporting continued organic deposit growth and funding potential strategic expansion while maintaining our targeted regulatory capital levels. We have not specifically allocated the amount of net proceeds to us that will be used for these purposes and our management will have broad discretion over how these proceeds are used and could spend these proceeds in ways with which you may not agree. In addition, we may not use the net proceeds to us from this offering effectively or in a manner that increases our market value or enhances our profitability. We have not established a timetable for the effective deployment of the net proceeds to us, and we cannot predict how long it will take to deploy these proceeds. Investing the net proceeds to us in securities until we can deploy these proceeds will provide lower yields than we generally earn on loans, which may have a material adverse effect on our profitability. Although we may, from time to time in the ordinary course of business, evaluate potential acquisition opportunities that we believe provide attractive risk-adjusted returns, we do not have any immediate plans, arrangements or understandings relating to any acquisitions, nor are we engaged in negotiations with any potential acquisition targets.
We may issue shares of preferred stock in the future, which adversely affect holders of our common stock and depress the price of our common stock.
Our Charter will authorize us to issue up to 10,000,000 shares of one or more series of preferred stock. Our Board will have the authority to determine the preferences, limitations and relative rights of shares of preferred stock and to fix the number of shares constituting any series and the designation of such series, without any further vote or action by our stockholders. Our preferred stock could be issued with voting, liquidation, dividend and other rights superior to the rights of our common stock. The potential issuance of preferred stock may delay or prevent a change in control of us, discouraging bids for our common stock at a premium over the market price, and materially adversely affect the market price and the voting and other rights of the holders of our common stock.
We do not intend to pay dividends on our Class A common stock for the foreseeable future, and our future ability to pay dividends is subject to restrictions.
Holders of our Class A common stock are only entitled to receive dividends when, as and if declared by our Board out of funds legally available for dividends. We currently do not intend to pay cash dividends on our common stock, including our Class A common stock, in the foreseeable future. Any declaration and payment of dividends on our Class A common stock in the future will depend on regulatory restrictions, our earnings and financial condition, our liquidity and capital requirements, the general economic climate, contractual restrictions, our ability to service any equity or debt obligations senior to our Class A common stock and other factors deemed relevant by our Board. Furthermore, consistent with our strategic plans, business objectives, capital availability, projected liquidity needs and other factors, we have made, and will continue to make, capital management decisions and policies that could adversely affect the amount of dividends, if any, paid to our common stockholders. See Dividend Policy and Dividends.
The Federal Reserve has indicated that bank holding companies should carefully review their dividend policy in relation to the organizations overall asset quality, current and prospective earnings and level, composition and quality of capital. The guidance provides that we inform and consult with the Federal Reserve prior to declaring and paying a dividend that exceeds earnings for the period for which the dividend is being paid or that could result in an adverse change to our capital structure, including interest on the senior promissory note, the subordinated debt obligations, the subordinated debentures underlying our trust preferred securities and our other debt obligations. If required payments on our debt obligations are not made, or dividends on any preferred stock we may issue are not paid, we will be prohibited from paying dividends on our common stock. Among other considerations, our ability to pay dividends further depends on the following factors:
51
Table of Contents
| | because the Company is a legal entity separate and distinct from the Bank and does not have any stand-alone operations, our ability to pay dividends depends on the ability of the Bank to pay dividends to us, and the OCC and Delaware state law may, under certain circumstances, restrict the payment of dividends to us from the Bank; |
| | Federal Reserve policy requires bank holding companies to pay cash dividends on common shares only out of net income available over the past year and only if prospective earnings retention is consistent with the organizations expected future needs and financial condition; and |
| | our Board may determine that, even though funds are available for dividend payments, retaining the funds for internal uses, such as expansion of our operations, is necessary or appropriate in light of our business plan and objectives. |
An investment in our Class A common stock is not an insured deposit.
An investment in our Class A common stock is not a bank deposit and, therefore, is not insured against loss by the FDIC, any other DIF or by any other public or private entity. Investment in our Class A common stock is inherently risky, including for the reasons described herein, and is subject to the same market forces that affect the price of common stock in any company. As a result, if you acquire our Class A common stock, you could lose some or all of your investment.
If the Bank fails or is put into receivership or conservatorship by the FDIC and its primary regulator, investors will likely lose their entire investment in the Company.
The Class A common stock of the Company is effectively subordinate to the claims of all creditors, including depositors, of the Bank. Based on the history of the FDIC in resolving failed institutions, if the Bank fails, or is placed into receivership, it is expected that the FDIC would incur a loss on the payout of the Banks insured deposits, uninsured deposits and sale of assets. As such, it is extremely unlikely that there would be any remaining funds available for payment to the Company as the sole stockholder of the Bank, or to its creditors or stockholders. The Class A common stock is an investment in the Company only, and is not a deposit, savings account, or other liability of the Bank, and is not insured by the FDIC or any other governmental agency. As the Bank is the principal asset of the Company, its receivership will likely result in the Companys bankruptcy, and the loss of stockholders investments in their entirety.
We qualify as an emerging growth company and smaller reporting company, and the reduced public company reporting requirements applicable to emerging growth companies and smaller reporting companies may make our Class A common stock less attractive to investors.
We are an emerging growth company as defined in Section 2(a)(19) of the Securities Act, as modified by the JOBS Act. As an emerging growth company, we are eligible to take advantage of certain exemptions from various reporting requirements that are applicable to other public companies that are not emerging growth companies. See Summary Implications of Being an Emerging Growth Company and a Smaller Reporting Company.
Although we are still evaluating our options under the JOBS Act, we may take advantage of some or all of the reduced regulatory and reporting obligations that will be available to us so long as we qualify as an emerging growth company, and thus the level of information we provide may be different from that of other public companies. If we do take advantage of any of these exemptions, some investors may find our securities less attractive, which could result in a less active trading market for our Class A common stock, and the price of our Class A common stock may be more volatile.
As an emerging growth company under the JOBS Act, we are permitted to delay the adoption of new or revised accounting pronouncements applicable to public companies until such pronouncements are made applicable to private companies. We do not intend to take advantage of this extended transition period, which
52
Table of Contents
means that the financial statements included in this prospectus, as well as any financial statements that we file in the future, will be subject to all new or revised accounting standards generally applicable to public companies. The decision not to take advantage of the extended transition period is irrevocable.
We could remain an emerging growth company until the earliest to occur of: (1) the end of the fiscal year following the fifth anniversary of this offering; (2) the first fiscal year after our annual gross revenues are $1.235 billion or more; (3) the date on which we have, during the previous three-year period, issued more than $1.0 billion in non-convertible debt securities; or (4) the date on which we are deemed to be a large accelerated filer under the Exchange Act. We have taken advantage of reduced disclosure regarding executive compensation arrangements and the presentation of certain historical financial information in this prospectus, and we may choose to take advantage of some but not all of these reduced disclosure obligations in future filings. If we do, the information that we provide to our stockholders may be different from what you might get from other public companies in which you hold stock.
We are also a smaller reporting company, as defined in the Exchange Act. Even after we no longer qualify as an emerging growth company, we may still qualify as a smaller reporting company, which would allow us to continue taking advantage of many of the same exemptions from disclosure requirements, including reduced disclosure obligations regarding executive compensation in our periodic reports and proxy statements. In addition, for so long as we continue to qualify as a non-accelerated filer, we will not be required to comply with the auditor attestation requirements of Section 404(b) of the Sarbanes-Oxley Act.
We cannot predict if investors will find our securities less attractive due to our reliance on these exemptions. If investors were to find our securities less attractive as a result of our election, we may have difficulty raising in this offering and future offerings and the market price of our securities may be more volatile.
Future sales of our Class A common stock in the public market, including any sales by members of the Fitzgerald Family, could lower our stock price, and any increase in shares may dilute your ownership in us.
The sale of substantial amounts of shares of our Class A common stock in the public market, or the perception that such sales could occur, could harm the prevailing market price of Class A common stock. These sales, or the possibility that these sales may occur, also might make it more difficult for us to sell equity securities in the future at a time and at a price that we deem appropriate. Upon completion of this offering, we will have shares of Class A common stock outstanding (or shares if the underwriters elect to exercise in full their option to purchase additional shares from us), all of which will be sold in this offering. These will be freely tradable without restriction or further registration under the Securities Act, except that any shares purchased or held by our affiliates, as that term is defined under Rule 144 of the Securities Act, may be sold only in compliance with the limitations described in Shares Eligible for Future Sale.
Our remaining shares outstanding will be restricted securities as defined under Rule 144 subject to certain restrictions on resale. However, federal securities law permit stockholders who are not our affiliates and have held our securities, including our Class A common stock, for least one year to sell such securities without regard to the restrictions Rule 144.
Upon completion of this offering, we will have shares of Class B common stock outstanding. All of these shares will be restricted securities as defined in Rule 144 and may be sold in the public market only if registered under the Securities Act or if they qualify for an exemption from registration under Rule 144. Our Charter will provide that each share of our Class B common stock is convertible at any time, at the option of the holder, into one share of Class A common stock. Shares of our Class A common stock issuable to our stockholders upon conversion of shares of Class B common stock would be considered restricted securities, as that term is defined under Rule 144.
We have agreed with the underwriters not to offer, pledge, sell or otherwise dispose of or hedge any shares of our Class A common stock, subject to certain exceptions, for the 180-day period following the date of this prospectus, without the prior consent of Piper Sandler & Co. on behalf of the underwriters. In addition, members
53
Table of Contents
of the Fitzgerald Family, our directors and executive officers and holders of more than 4.5% of our common stock have entered into similar lock-up agreements with the underwriters. The underwriters may, at any time, release us, the members of the Fitzgerald Family or any of our executive officers, directors or holders of more than 4.5% of our common stock from this lock-up agreement. The remaining shares of Class B common stock that are not subject to the contractual lockup, upon conversion to shares of Class A common stock, may be sold in the public market if they qualify for an exemption from registration under Rule 144.
Upon the expiration of the lock-up agreements described above, all of such shares will be eligible for resale in a public market, subject, in the case of shares held by our affiliates, to volume, manner of sale and other limitations under Rule 144 or registration under the Securities Act. As restrictions on resale end, the market price of our shares of Class A common stock could drop significantly. We have no control over the timing and manner of the sale by our principal stockholders, including any member of the Fitzgerald Family. Generally speaking, public resales by members of the Fitzgerald Family will be subject to the volume limitations under Rule 144 absent registration under the Securities Act. Members of the Fitzgerald Family could also sell all or a significant tranche of their shares to a single third-party purchaser. Any such sales could impact the price of our shares of Class A common stock and may be at prices below the current trading price of our Class A common stock.
We cannot predict the size of future issuances or sales of our Class A common stock or the effect, if any, that future issuances or sales of shares of our Class A common stock may have on the market price of our Class A common stock. Sales or distributions of substantial amounts of our Class A common stock (including shares issued in connection with an acquisition), or the perception that such sales could occur, may cause the market price of our Class A common stock to decline.
If securities or industry analysts do not publish research or reports about our business, or if they downgrade their recommendations regarding our Class A common stock, our stock price and trading volume could decline.
The trading market for our Class A common stock will be influenced by the research and reports that industry or securities analysts publish about us or our business. We do not have any control over these securities analysts, and they may not cover our Class A common stock. If securities analysts do not cover our Class A common stock, the lack of research coverage may adversely affect our market price. If we are covered by securities analysts and if any of the analysts who cover us downgrade our common stock or publish inaccurate or unfavorable research about our business, our Class A common stock price may decline. If analysts cease coverage of us or fail to regularly publish reports on us, we could lose visibility in the financial markets, which in turn could cause our Class A common stock price or trading volume to decline and our Class A common stock to be less liquid.
Certain banking laws, certain provisions of our organizational documents and Delaware law may discourage or delay acquisition attempts for us that you might consider favorable.
Provisions of federal banking laws, including regulatory approval requirements, could make it difficult for a third party to acquire us, even if doing so would be perceived to be beneficial to our stockholders. Acquisition of ten percent (10%) or more of any class of voting stock of a bank holding company or depository institution, individually or as part of a group acting in concert, including shares of our Class A common stock following completion of this offering, generally creates a rebuttable presumption that the acquirer controls the bank holding company or depository institution, and therefore requires prior approval of a federal banking agency, under the CIBC Act. Also, a bank holding company must obtain the prior approval of the Federal Reserve before, among other things, acquiring direct or indirect ownership or control of more than five percent (5%) of the voting shares of any bank, including the Bank, under the BHC Act.
In addition, our Charter and Bylaws will contain provisions that may make the merger or acquisition of our company more difficult. These provisions will include, among others:
| | a dual-class common stock structure, which provides for concentrated voting power in the holders of our Class B common stock, including members of the Fitzgerald Family, which provides significant |
54
Table of Contents
| influence over matters requiring stockholder approval, including the election of directors and significant corporate transactions, such as a merger or other sale of our company or its assets. |
| | no cumulative voting in the election of directors, which limits the ability of minority stockholders to elect director candidates; |
| | a class vote of the holders of a majority of the outstanding shares of any affected class of common stock, voting together as a separate class, to approve any amendment to our Charter that would adversely affect the rights or preferences of the Class A common stock or the Class B common stock; |
| | the affirmative vote of the holders of a majority of voting power of the outstanding shares held by stockholders other than the Founders (as defined in our Charter), voting together as a separate class, to approve any amendment to our Charter that would disproportionately benefit the Founders relative to stockholders other than the Founders; |
| | authorization to issue shares of one or more series of preferred stock, the terms of which series may be established and the shares of which may be issued without stockholder approval, and which may include super voting, special approval, dividend or other rights or preferences superior to the rights of the holders of Class A common stock; |
| | no stockholders action by written consent; |
| | special stockholder meetings may be called at any time by the Board, the chairman of our Board or the chief executive officer or our secretary upon the written request of the record holders of at least fifteen percent (15%) or more of the total voting power of the then-outstanding shares of common stock; |
| | advance notice requirements for nominations for elections to our Board or for proposing matters that can be acted upon by stockholders at stockholder meetings; and |
| | a class vote of the holders of Class A common stock, voting as a separate class, to approve any merger, consolidation or business combination of us into another corporation, in which any Founder, or an affiliate thereof, is part of the purchaser group. |
These anti-takeover provisions and other provisions under the DGCL could discourage, delay or prevent a transaction involving a change in control of our company, including actions that our stockholders may deem advantageous, or negatively affect the trading price of our Class A common stock. These provisions could also discourage proxy contests and make it more difficult for you and other stockholders to elect directors of your choosing and to cause us to take other corporate actions you desire. For further discussion of these and other such anti-takeover provisions, see Description of Capital Stock Anti-Takeover Provisions.
Our Charter and Bylaws will designate the Court of Chancery of the State of Delaware as the sole and exclusive forum for certain types of actions and proceedings that may be initiated by our stockholders.
Our Charter and Bylaws will provide that, unless we consent to the selection of an alternative forum, the Court of Chancery of the State of Delaware will, to the fullest extent permitted by law, be the sole and exclusive forum for: (i) any derivative action or proceeding brought on our behalf; (ii) any action asserting a breach of breach of fiduciary duty owed by any of our directors, officers or stockholders to us or to our stockholders; (iii) any action asserting a claim against us arising under the DGCL, our Charter or our Bylaws; or (iv) any action asserting a claim against us that is governed by the internal affairs doctrine.
Although we believe this exclusive forum provision benefits us by providing increased consistency in the application of Delaware law, the forum selection clauses that will be in our Charter and Bylaws may impose additional litigation costs on stockholders in pursuing any such claims, particularly if the stockholders do not reside in or near the State of Delaware. Additionally, this choice-of-forum provision may limit a stockholders ability to bring a claim in a different judicial forum, including one that it may find favorable or convenient for a specified class of disputes with us or our directors, officers, other stockholders or employees, which may discourage such lawsuits even though an action, if successful, might benefit our stockholders. The Court of Chancery of the State of Delaware may also reach different judgments or results than would other courts, including courts where a stockholder considering an action may be located or would otherwise choose to bring the action, and such judgments may be more or less favorable to us than our stockholders.
55
Table of Contents
CAUTIONARY NOTE REGARDING FORWARD-LOOKING STATEMENTS
This prospectus contains forward-looking statements, which involve risks and uncertainties. You should not place undue reliance on forward-looking statements because they are subject to numerous uncertainties and factors relating to our operations and business, all of which are difficult to predict and many of which are beyond our control. Forward-looking statements include information concerning our possible or assumed future results of operations, including descriptions of our business strategy. These forward-looking statements are generally identified by the use of forward-looking terminology, including the terms anticipate, believe, could, estimate, expect, intend, may, plan, potential, predict, project, should, target, will, would and, in each case, their negative or other variations or comparable terminology and expressions. All statements other than statements of historical facts contained in this prospectus, including statements regarding our strategies, future operations, future financial position, future revenue, projected costs, prospects, plans, objectives of management and expected market growth are forward-looking statements. The forward-looking statements are contained principally in the sections entitled Summary, Risk Factors, Use of Proceeds, Managements Discussion and Analysis of Financial Condition and Results of Operations and Business and include, among other things, statements relating to:
| | Changes in trade, monetary and fiscal policies of, and other activities undertaken by, governments, agencies, central banks and similar organizations, including the effects of United States federal government spending; |
| | The level of, or changes in the level of, interest rates and inflation, including the effects on our net interest income and the market value of our investment and loan portfolios; |
| | The level and composition of our deposits, including our ability to attract and retain, and the seasonality of, client deposits; |
| | The level and composition of our loan portfolio, including our ability to maintain the credit quality of our loan portfolio; |
| | Current and future business, economic and market conditions in the United States generally or in the Washington, D.C. metropolitan area in particular; |
| | The effects of disruptions or instability in the financial system, including as a result of the failure of a financial institution or other participants in it, or geopolitical instability, including war, terrorist attacks, pandemics and man-made and natural disasters; |
| | The impact of, and changes, in applicable laws, regulations, regulatory expectations and accounting standards and policies; |
| | Our likelihood of success in, and the impact of, legal, regulatory or other actions, investigations or proceedings related to our business; |
| | Adverse publicity or reputational harm to us, our senior officers, directors, employees or clients; |
| | Our ability to effectively execute our growth plans or other initiatives; |
| | Changes in demand for our products and services; |
| | Our levels of, and access to, sources of liquidity and capital; |
| | The ability to attract and retain essential personnel or changes in our essential personnel; |
| | Our ability to effectively compete with banks, non-bank financial institutions, and financial technology firms and the effects of competition in the financial services industry on our business; |
| | The effectiveness of our risk management and internal disclosure controls and procedures; |
| | Any failure or interruption of our information and technology systems, including any components provided by a third party; |
| | Our ability to identify and address cybersecurity threats and breaches; |
| | Our ability to keep pace with technological changes; |
| | Our ability to receive dividends from the Bank and satisfy our obligations as they become due; |
| | The one-time and incremental costs of operating as a public company; |
| | Our ability to meet our obligations as a public company, including our obligation under Section 404 of Sarbanes-Oxley; |
| | The effect of our dual class structure and the concentrated ownership of our Class B common stock, including beneficial ownership of our shares by the Fitzgerald Family; and |
56
Table of Contents
| | The number of shares of our Class B common stock converted into shares of Class A common stock. |
You should not rely upon forward-looking statements as predictions of future events. We have based the forward-looking statements contained in this prospectus primarily on our current expectations and projections about future events and trends that we believe may affect our business, financial condition, results of operations and prospects. The outcome of the events described in these forward-looking statements is subject to risks, uncertainties and other factors described in the section titled Risk Factors and elsewhere in this prospectus. Moreover, we operate in a very competitive and rapidly changing environment. New risks and uncertainties emerge from time to time, and it is not possible for us to predict all risks and uncertainties that could have an impact on the forward-looking statements contained in this prospectus. The results, events and circumstances reflected in the forward-looking statements may not be achieved or occur, and actual results, events, or circumstances could differ materially from those described in the forward-looking statements.
The forward-looking statements made in this prospectus relate only to events as of the date on which the statements are made. We undertake no obligation to update any forward-looking statements made in this prospectus to reflect events or circumstances after the date of this prospectus or to reflect new information or the occurrence of unanticipated events, except as required by law. We may not actually achieve the plans, intentions or expectations disclosed in our forward-looking statements and you should not place undue reliance on our forward-looking statements. Our forward-looking statements do not reflect the potential impact of any future acquisitions, mergers, dispositions, joint ventures, or investments we may make.
In addition, statements that we believe and similar statements reflect our beliefs and opinions on the relevant subject. These statements are based upon information available to us as of the date of this prospectus. And while we believe such information provides a reasonable basis for such statements, such information may be limited or incomplete. Our statements should not be read to indicate that we have conducted an exhaustive inquiry into, or review of, all potentially available relevant information. These statements are inherently uncertain and you are cautioned not to unduly rely upon these statements. Past performance is not a guarantee of future results or returns and no representation or warranty is made regarding future performance.
57
Table of Contents
We estimate that the net proceeds to us from this offering will be approximately $ million (or approximately $ million if the underwriters elect to exercise in full their option to purchase additional shares of Class A common stock from us) after deducting underwriting discounts and commissions and estimated offering expenses, based on an assumed initial public offering price of $ per share (the midpoint of the estimated price range set forth on the cover page of this prospectus).
A $1.00 increase (decrease) in the assumed initial public offering price of $ per share would increase (decrease) the amount of net proceeds to us from this offering by $ million (or approximately $ million if the underwriters elect to exercise in full their option to purchase additional shares from us), assuming the number of shares offered by us, as set forth on the cover page of this prospectus, remains the same, and after deducting the estimated underwriting discounts and commissions and estimated offering expenses.
We intend to use the net proceeds from this offering for general corporate purposes, which may include repaying debt, supporting continued organic deposit growth and funding potential strategic expansion while maintaining our targeted regulatory capital levels.
Our management will retain broad discretion to allocate the net proceeds of this offering, and the precise amounts and timing of our use of the net proceeds of this offering will depend upon market conditions, as well as other factors. Until we deploy the proceeds of this offering for the uses described above, we expect to hold such proceeds in short-term investments.
58
Table of Contents
We do not currently intend to pay dividends on our common stock, including our Class A common stock, in the foreseeable future. Instead, we currently anticipate that we will retain all of our earnings to support our continued organic growth, including growth in our transaction deposit accounts. We have not declared or paid any dividends to our stockholders since 2019, opting to retain all earnings to support our growth. Any future declarations of dividends will be at the discretion of our Board. In determining the amount of any future dividends, our Board will take into account: (1) our financial results; (2) our available cash, as well as anticipated cash requirements (including debt servicing); (3) our capital requirements and the capital requirements of Chain Bridge Bank, N.A.; (4) contractual, legal, tax and regulatory restrictions on, and implications of, the payment of dividends by us to our stockholders or by Chain Bridge Bank, N.A. to us; (5) general economic and business conditions; and (6) any other factors that our Board may deem relevant. Therefore, there can be no assurance that we will pay any dividends to holders of our stock, or as to the amount of any such dividends. See Risk Factors Risks Related to Our Class A Common Stock We do not intend to pay dividends on our Class A common stock for the foreseeable future, and our future ability to pay dividends is subject to restrictions and Material United States Tax Consequences To Non-U.S. Holders Of Common Stock Dividends.
Our ability to declare and pay dividends on our stock is also subject to numerous limitations applicable to bank holding companies and banks under federal banking laws, regulations and policies. Federal bank regulators are authorized to determine under certain circumstances relating to the financial condition of a bank holding company or a bank that the payment of dividends would be an unsafe or unsound practice and to prohibit payment thereof.
In addition, under the Delaware General Corporation Law (the DGCL), we may only pay dividends from legally available surplus or, if there is no such surplus, out of our net profits for the fiscal year in which the dividend is declared and the preceding fiscal year. Surplus is generally defined as the excess of the fair value of our total assets over the sum of the fair value of our total liabilities plus the aggregate par value of our issued and outstanding capital stock.
Because we are a holding company and do not engage directly in other business activities of a material nature, our ability to pay dividends on our stock depends primarily upon our receipt of dividends from Chain Bridge Bank, N.A., the payment of which is subject to numerous limitations under applicable banking laws, regulations and policies. Under the National Bank Act and OCC regulations, a national bank, such as the Bank, may not, without the prior approval of the OCC, declare dividends in excess of the sum of the current years net profits plus the retained net profits from the prior two years or in excess of the sum of the banks retained earnings and current period net income. The federal banking agencies regulatory capital rules further limit the amount of dividends that may be paid by the Bank if it does not satisfy its minimum capital requirements and buffer requirement in full. In addition, under the Federal Deposit Insurance Corporation Improvement Act of 1991 (FDICIA), the Bank may not pay any dividend if it is undercapitalized or if payment would cause it to become undercapitalized. In addition, the federal bank regulatory agencies have issued policy statements providing that FDIC-insured depository institutions and their holding companies should generally pay dividends only out of their current operating earnings. See Supervision and Regulation Dividends for more information on applicable banking laws, regulations and policies limiting our and the Bankss ability to declare and pay dividends.
The Banks current and future dividend policy is also subject to the discretion of its board of directors. The Bank is not obligated to pay dividends to us. See Risk Factors Risks Related to Our Class A Common Stock We do not intend to pay dividends on our Class A common stock for the foreseeable future, and our future ability to pay dividends is subject to restrictions.
59
Table of Contents
The following table sets forth our capitalization and capital ratios on a consolidated basis as of March 31, 2024:
| | on an actual basis; and |
| | on an adjusted basis, after giving effect to (1) the Reclassification transactions described under Summary Reclassification and (2) the net proceeds from the sale by us of shares of Class A common stock in this offering (assuming the underwriters do not exercise their option to purchase additional shares of Class A common stock from us) at an initial public offering price of $ per share (the midpoint of the estimated price range set forth on the cover page of this prospectus), after deducting underwriting discounts and commissions and estimated offering expenses. |
A $1.00 increase (decrease) in the assumed initial public offering price of $ per share would increase (decrease) the as adjusted amount of cash and cash equivalents, additional paid-in capital, total stockholders equity and total capitalization by approximately $ million, assuming the number of shares offered by us, as set forth on the cover page of this prospectus, remains the same, and after deducting the estimated underwriting discounts and commissions and estimated offering expenses. If the underwriters option to purchase additional shares is exercised in full, the as adjusted amount of each of cash and cash equivalents additional paid-in capital, total stockholders equity and total capitalization by approximately $ million, after deducting the estimated underwriting discounts and commissions and estimated offering expenses as described under Use of Proceeds above.
You should read the following table in conjunction with the sections titled Summary Selected Financial Data and Managements Discussion and Analysis of Financial Condition and Results of Operations and our consolidated financial statements and notes thereto appearing elsewhere in this prospectus.
| As of March 31, 2024 | ||||||||
| Actual | As Adjusted | |||||||
| (dollars in thousands) | ||||||||
| Cash and cash equivalents |
$ | 346,305 | $ | |||||
|
|
|
|
|
|||||
| Debt: |
||||||||
| Short-term borrowings |
$ | 5,000 | $ | |||||
| Long-term borrowings |
| |||||||
|
|
|
|
|
|||||
| Total borrowings |
5,000 | |||||||
| Stockholders Equity: |
||||||||
| Preferred stock, no par value; 100,000 shares authorized, none issued and outstanding, actual; preferred stock; no par value, 10,000,000 shares authorized, none issued and outstanding, pro forma |
| |||||||
| Old common stock, $1.00 par value; 200,000 shares authorized, 26,876 shares issued and outstanding, actual; old common stock, $1.00 par value; no shares authorized, no shares issued and outstanding, pro forma |
27 | |||||||
| Class A common stock, $0.01 par value; no shares authorized, no shares issued and outstanding, actual; Class A common stock, $0.01 par value; 20,000,000 shares authorized, shares issued and outstanding, pro forma |
| |||||||
| Class B common stock, $0.01 par value; no shares authorized, no shares issued and outstanding, actual; Class B common stock, $0.01 par value; 10,000,000 shares authorized, shares issued and outstanding, pro forma |
| |||||||
| Additional paid-in capital |
38,295 | |||||||
| Retained earnings |
60,609 | |||||||
60
Table of Contents
| As of March 31, 2024 | ||||||||
| Actual | As Adjusted | |||||||
| (dollars in thousands) | ||||||||
| Accumulated other comprehensive loss |
(11,330 | ) | ||||||
|
|
|
|
|
|||||
| Total stockholders equity |
87,601 | |||||||
|
|
|
|
|
|||||
| Total capitalization |
$ | 92,601 | $ | |||||
|
|
|
|
|
|||||
| Capital Ratios: |
||||||||
| Tangible common equity to tangible total assets ratio(1) |
7.10 | % | % | |||||
| Common equity Tier 1 capital ratio |
24.08 | % | % | |||||
| Tier 1 capital ratio |
24.08 | % | % | |||||
| Total risk-based capital ratio |
25.22 | % | % | |||||
| Tier 1 leverage ratio |
8.66 | % | % | |||||
| (1) | The ratio of tangible common equity to tangible total assets is calculated in accordance with GAAP and represents the ratio of common equity to total asset. The Company did not have any intangible assets or goodwill as of March 31, 2024. |
61
Table of Contents
If you invest in our Class A common stock in this offering, your ownership interest will be diluted to the extent of the difference between the initial public offering price per share of our Class A common stock in this offering and the pro forma as adjusted net tangible book value per share of our common stock immediately after this offering.
Our pro forma net tangible book value as of March 31, 2024 was $ million, or $ per share. Pro forma net tangible book value per share represents the amount of our total tangible assets less our total liabilities divided by the number of our shares of Class A common stock and Class B common stock outstanding as of March 31, 2024, after giving effect to the Reclassification and the filing and effectiveness of our Charter, which will be in effect prior to the completion of this offering.
After giving effect to (1) the pro forma adjustments set forth above and (2) the sale by us of shares of our Class A common stock in this offering (assuming the underwriters do not exercise their option to purchase additional shares) at an assumed initial public offering price of $ per share (the midpoint of the estimated price range set forth on the cover page of this prospectus), and after deducting estimated underwriting discounts and commissions and estimated offering expenses payable by us, our pro forma as adjusted net tangible book value as of March 31, 2024 would have been $ million, or $ per share. This amount represents an immediate increase in pro forma as adjusted net tangible book value of $ per share to our existing stockholders and an immediate dilution in pro forma as adjusted net tangible book value of $ per share to new investors purchasing our Class A common stock in this offering.
The following table illustrates the calculation of the amount of dilution per share that a purchaser of our Class A common stock in this offering will incur given the assumptions above:
| Initial public offering price per share |
$ | |||
| Pro forma net tangible book value per share at March 31, 2024 |
||||
| Increase in pro forma as adjusted net tangible book value per share attributable to new investors |
||||
|
|
|
|||
| Pro forma as adjusted net tangible book value per share upon completion of the offering |
||||
|
|
|
|||
| Dilution in pro forma as adjusted net tangible book value per share to new investors from offering |
$ | |||
|
|
|
The dilution information discussed above is illustrative only and may change based on the actual initial public offering price and other terms of this offering. A $1.00 increase (decrease) in the assumed initial public offering price of $ per share of Class A common stock (the midpoint of the estimated price range set forth on the cover page of this prospectus) would increase (decrease) our pro forma as adjusted net tangible book value per share after this offering by $ per share and increase (decrease) the dilution to new investors by $ per share, in each case assuming the number of shares of Class A common stock offered by us, as set forth on the cover page of this prospectus, remains the same, and after deducting estimated underwriting discounts and commissions and estimated offering expenses payable by us. Similarly, each increase or decrease of 100,000 shares in the number of shares of Class A common stock offered by us would increase (decrease) our pro forma as adjusted net tangible book value by approximately $ per share and decrease (increase) the dilution to new investors by approximately $ per share, in each case assuming the assumed initial public offering price of $ per share (the midpoint of the estimated price range set forth on the cover page of this prospectus) remains the same, and after deducting estimated underwriting discounts and commissions and estimated offering expenses payable by us.
62
Table of Contents
If the underwriters exercise their option to purchase additional shares of Class A common stock from us in full, the pro forma net tangible book value per share, as adjusted to give effect to this offering, would be $ per share, and the dilution in pro forma net tangible book value per share to investors in this offering would be $ per share.
The following table summarizes, as of March 31, 2024, on a pro forma as adjusted basis as described above, the number of shares of Class A common stock purchased from us, the total consideration and the average price per share (1) paid to us by existing stockholders, and (2) to be paid by new investors acquiring our Class A common stock in this offering at an assumed initial public offering price of $ per share, which is the midpoint of the estimated price range set forth on the cover page of this prospectus, before deducting estimated underwriting discounts and commissions and estimated offering expenses payable by us.
| Shares Purchased | Total Consideration | Average Price | ||||||||||||||||||
| Number | Percent | Amount | Percent | Per Share | ||||||||||||||||
| Existing stockholders |
% | $ | % | $ | ||||||||||||||||
| New investors in this offering |
% | $ | % | $ | ||||||||||||||||
|
|
|
|
|
|
|
|
|
|
|
|||||||||||
| Total |
100 | % | $ | 100 | % | $ | ||||||||||||||
|
|
|
|
|
|
|
|
|
|
|
|||||||||||
63
Table of Contents
MANAGEMENTS DISCUSSION AND ANALYSIS OF FINANCIAL CONDITION AND RESULTS OF OPERATIONS
The following discussion and analysis of our financial condition and results of operations should be read together with Summary Historical Consolidated Financial and Operating Information and our consolidated financial statements and related notes thereto and other financial information included elsewhere in this prospectus. In addition to historical information, this discussion and analysis contains forward-looking statements that involve risks, uncertainties and assumptions that could cause actual results to differ materially from our expectations. Factors that could cause such differences are discussed in the sections entitled Risk Factors, Cautionary Note Regarding Forward-Looking Statements and elsewhere in this prospectus. We assume no obligation to update any of these forward-looking statements except to the extent required by law.
The following discussion relates to our historical results, on a consolidated basis. Because we conduct all our material business operations through our wholly owned subsidiary, Chain Bridge Bank, N.A., the discussion and analysis primarily focus on activities conducted at the subsidiary level.
Introduction
Chain Bridge Bancorp, Inc. is a Delaware-chartered bank holding company and the parent of its wholly-owned subsidiary, Chain Bridge Bank, N.A., a nationally chartered commercial bank with fiduciary powers granted by the OCC. The Company was incorporated on May 26, 2006, and the Bank opened on August 6, 2007. The Company conducts substantially all of its operations through the Bank and has no other subsidiaries.
We offer a range of commercial and personal banking services, including deposits, treasury management, payments, loans, commercial lending, residential mortgage financing, consumer loans, trusts and estate administration, wealth management, and asset custody.
Our mission is to deliver exceptional banking and trust services nationwide, blending financial strength, personalized service, and advanced technology to offer tailored solutions to businesses, non-profit organizations, political organizations, individuals, and families. We aspire to grow responsibly by adapting our personalized service and advanced technology solutions to our clients evolving needs while emphasizing strong liquidity, asset quality, and financial strength. We aim to be recognized for our Strength, Service, Solutions: Your Bridge to Better Banking Nationwide.
Three Months ended March 31, 2024 Highlights
Highlights of our results of operations and financial condition as of and for the three months ended March 31, 2024 (Q1 2024) are provided below.
Financial Performance
| | Consolidated net income of $3.9 million in Q1 2024, compared to $1.0 million in the three months ended March 31, 2023 (Q1 2023). Earnings per share in Q1 2024 of $145.74, compared to $39.01 in Q1 2023. |
| | Net interest income, before recapture of, or provision for, credit losses, of $8.8 million in Q1 2024, compared to $6.5 million in Q1 2023. Net interest income, after recapture of, or provision for, credit losses of $9.0 million in Q1 2024, compared to $5.7 million in Q1 2023. |
| | Return on average equity of 18.33% in Q1 2024, compared to 6.00% in Q1 2023. Return on average assets in Q1 2024 of 1.39%, compared to 0.42% in Q1 2023. |
| | Yield on average earning assets of 3.47% in Q1 2024, compared to 2.96% in Q1 2023. Cost of funds decreased to 0.35% in Q1 2024 from 0.38% in Q1 2023. |
64
Table of Contents
Balance Sheet
| | Total assets were $1.234 billion as of March 31, 2024, compared to $1.205 billion as of December 31, 2023 and $1.049 billion as of March 31, 2023. Total deposits were $1.136 billion as of March 31, 2024, compared to $1.112 billion as of December 31, 2023 and $968.0 million as of March 31, 2023. Total one-way sell ICS® deposits held through the InfraFi Cash Service® (ICS®) network of $289.2 million as of March 31, 2024 and $240.8 million as of December 31, 2023 were excluded from these totals. There were no one-way sell ICS® deposits as of March 31, 2023. |
| | No non-performing assets or other real estate owned (OREO) were reported as of March 31, 2024, December 31, 2023 and March 31, 2023. |
| | Cash balances held at the Federal Reserve were $338.0 million as of March 31, 2024, compared to $309.8 million as of December 31, 2023 and $113.6 million as of March 31, 2023. |
| | As of March 31, 2024, the Banks total investment securities portfolio balance was $563.3 million, compared to $566.7 million as of December 31, 2023 and $590.8 million as of March 31, 2023. |
| | Book value per share was $3,259.44 as of March 31, 2024, compared to $3,104.98 as of December 31, 2023 and $2,700.54 as of March 31, 2023. |
| | As of March 31, 2024, the Bank exceeded the minimum requirements to be well-capitalized for bank regulatory purposes, with a total risk-based capital ratio of 26.44% and a tier 1 risk-based capital ratio of 25.30%. |
| | As of March 31, 2024, our liquidity ratio was 79.36%, compared to 78.75% as of December 31, 2023 and 72.18% as of March 31, 2023. |
Significant Factors Impacting our Business, Financial Condition and Results of Operations
Several key factors impact our financial performance:
Short-term interest rates: The cyclical nature of our balance sheet and our focus on liquidity cause our primary revenue source, net interest income, to be highly correlated to short-term interest rates. We maintain higher liquidity and lower loan-to-deposit ratios than most banks. Higher rates generally increase our net interest income because of our high levels of liquid interest-earning assets and low levels of interest-bearing deposits and loans. Conversely, if short-term interest rates fall, our net interest income would likely decrease due to our high levels of cash. This relationship between our revenue and the yield curve is different from that at most other banks, which generally have lower levels of cash and liquidity and higher loan-to-deposit ratios.
Political organizations and federal election cycles: We provide deposit services to political organizations, which we estimate represented a majority of our demand deposits as of March 31, 2024. These accounts typically come to our Bank through treasurers and other finance managers who are familiar with our experience in this sector.
Federal election cycles significantly influence our deposit levels. These cycles also impact revenue-generating activities, such as wire transfers, payments, check processing, debit card usage, and treasury management services. In the United States, federal elections occur every two years in the fourth quarter, on the first Tuesday after the first Monday in November. Primary elections for federal offices, determined by the state and political parties, typically occur in the first, second, or third quarter of the year. Historically, in the quarters leading up to federal elections, especially presidential elections, our deposits, net interest income, and non-interest income generally increase. Deposit growth tends to be stronger leading up to presidential elections, which occur every four years, compared to biennial midterm elections. In the quarters immediately before, during, and after a federal election, we usually experience an outflow of our political deposits, causing our balance sheet and revenue to decline until clients resume fundraising for the next election cycle. Campaign-related deposits, which increase during federal election years before they are spent, depend almost exclusively on political fundraising. Our deposit levels fluctuate significantly during the political cycle, peaking in the lead-up to elections and decreasing afterward. As of June 2024, the Bank is experiencing increased deposit levels ahead of the November 2024 presidential election, consistent with patterns observed in previous election cycles. As a result of the 2024 presidential election, we expect deposit outflows during the third and fourth quarters of 2024,
65
Table of Contents
with the possibility of some outflows extending into early 2025. The precise amount and timing of such outflows remain uncertain and may differ from historical cycles. In addition, fundraising activities post-election likely will be influenced by the outcome of the federal elections. This cyclical pattern and the potential for prolonged lower fundraising activity could affect our financial condition and results of operations, as discussed in Risk Factors. In order to mitigate seasonality risk, we maintain a relatively high level of cash reserve deposits at the Federal Reserve.
Lending approach: Our lending policies are designed to manage credit risk. We seek borrowers with a strong capacity to repay, substantial equity who have good financial habits, avoid debt, and prefer to repay loans quickly. We aim to mitigate credit risk on commercial loans with appropriate structuring, reasonably margined collateral, personal guarantees, a primary deposit relationship, and sometimes compensating balances. Our lending policies typically attract borrowers who may qualify for lower borrowing rates than those of most other banks, which may result in lower yields for us.
Economic conditions: General economic conditions, including conditions in the Washington, D.C. metropolitan area, and government spending influence our deposit levels and earnings. The majority of our deposits are campaign-related deposits, making us less dependent on the broader economy than most other banks. However, if the economy worsens, some political donors may contribute less, negatively impacting our deposit levels and income. In addition, a national or regional recession could increase the risk of loan defaults and negatively affect our municipal and corporate bonds, potentially leading to defaults. In particular, significant changes in government spending, particularly federal budget cuts, could adversely affect the Washington, D.C. metropolitan area economy and, consequently, our loan performance and deposit levels. Such changes may also impact the value of our investment securities portfolio, which includes U.S. government, municipal, and corporate bonds. Finally, rising inflation can increase our operational costs, including labor and technology expenses, while also potentially diminishing the purchasing power of our clients, further impacting our deposit and loan levels.
Monetary Policy: We rely on the Federal Reserves payment of interest on reserve balances as a source of interest income. The rate of interest on reserve balances is determined by the Federal Open Market Committee, which meets regularly every six-and-a-half weeks. Because this rate affects other money market yields, it can have a significant impact on our interest income. We are most exposed to monetary policy during federal election years such as in 2024 when campaign-related deposits rise and we match those liabilities with short-term assets such as Federal Reserve balances, which reprice immediately, and Treasury bills. Although higher interest rates decrease the value of our investment securities portfolio, they increase our interest income. The Federal Reserve has additional monetary tools that can impact our interest income through changes in rates, such as the overnight reverse repo rate and open market operations.
Regulatory and Supervisory Environment: We incur significant costs due to our regulation and supervision by the federal government. As a bank holding company, we are subject to comprehensive supervision and regulatory oversight by the Federal Reserve. The Banks primary regulator and supervisor is the OCC, which through regular examinations oversees our operations, risk management, compliance, and corporate governance. The Bank is also subject to FDIC secondary regulatory oversight that focuses on insurance standards, risk management practices, and overall regulatory compliance. We pay assessments to the FDIC and the OCC for their insurance and supervision. In addition, we manage our balance sheet to meet regulatory standards, such as capital ratio requirements. Failure to meet these standards may result in corrective actions, restrictions, and increased scrutiny from federal regulators. By adhering to these requirements, we aim to maintain our financial health and strengthen our market position. See Supervision and Regulation.
Uninsured Deposits: Most of our deposits come from commercial clients rather than retail clients, resulting in a relatively high level of account balances exceeding the FDIC coverage limits. As of March 31, 2024, we estimate that approximately 65.6% of our total deposits were not insured by the FDIC. To manage the associated risks, we aim to maintain high levels of liquidity, asset quality, and financial strength.
66
Table of Contents
For clients with uninsured balances, we offer access to additional FDIC insurance coverage by placing their deposits in increments within the insurance limits at other banks through the ICS® network. We typically earn fee income from ICS® for deposits that leave our balance sheet, or interest income when we elect to receive reciprocal deposits from ICS®. Using the ICS® program helps us to manage the size of our balance sheet. See Financial Condition Deposits below.
Public Company Costs: In preparation for, and following the completion of, this offering, we expect to incur additional costs associated with operating as a public company. We expect that these costs will include additional personnel, legal, consulting, regulatory, insurance, accounting, investor relations and other expenses that we did not incur as a private company. The Sarbanes-Oxley Act, as well as rules adopted by the SEC and national securities exchanges, requires public companies to implement specified corporate governance practices that are currently inapplicable to us as a private company. These additional rules and regulations will increase our legal, regulatory and financial compliance costs and will make some activities more time consuming and costly.
Primary Factors Used to Evaluate Our Business
The most significant factors we use to evaluate our business and results of operations are net income, return on average equity, return on average assets and return on average risk-weighted assets. We also use net interest income, non-interest income and non-interest expense.
Net Income. Our net income depends substantially on net interest income, which is the difference between interest earned on interest earning assets (usually interest-bearing cash, investment securities and loans) and the interest expense incurred in connection with interest-bearing liabilities (usually interest-bearing deposits and borrowings). Our net income also depends on non-interest income, which is income generated other than by our interest earning assets. Other factors that influence our net income include our provisions for credit losses, income taxes, and non-interest expenses, which include our fixed and variable overhead costs and other miscellaneous operating expenses.
Return on Average Equity. We use return on average equity to assess our effectiveness in utilizing stockholders equity to generate net income. In determining return on average equity for a given period, net income is divided by the average stockholders equity for that period.
Return on Average Assets. We monitor return on average assets to measure our operating performance and to determine how efficiently our assets are being used to generate net income. In determining return on average assets for a given period, net income is divided by the average total assets for that period.
Return on Average Risk-Weighted Assets. We use return on average risk-weighted assets, which are computed and reported on the quarterly call report, to measure how efficiently our assets are being used to generate net income on a risk-adjusted basis. Return on average risk-weighted assets is calculated as net income divided by average risk-weighted assets.
Net Interest Income. Net interest income, representing interest income less interest expense, is the largest component of our net income. The level of net interest income is primarily a function of the average balance of interest earning assets, the average balance of interest-bearing liabilities and the spread between the realized yield on such assets and the cost of such liabilities. Net interest income is impacted by the relative mix of interest earning assets and interest-bearing liabilities and movements in market interest rates. Net interest income and net interest margin in any one period can be significantly affected by a variety of factors, including the mix and overall size of our earning assets portfolio and the cost of funding those assets.
Non-Interest Income. Non-interest income consists primarily of service charge income earned from deposit placement services, service charges on accounts, revenue from trust and wealth management services, gains on sale of mortgage loans, net gains or losses on sales of securities and other income. The Company records as non-interest
67
Table of Contents
income deposit placement services income for one-way sell ICS® deposits which are sold into the ICS® network. See Financial Condition Deposits for more information on these deposits. Service charges on deposit accounts include fees earned from monthly service charges, account analysis charges and interchange fee income. It also includes fees charged for transaction activities such as wire transfers, cash letters and overdrafts. Trust and wealth management income represents monthly service charges due from clients for managing and administering clients assets. Services include investment management and advisory services, custody of assets, trust services, and financial planning. Other income primarily relates to rental income and other minor items.
Non-Interest Expense. Non-interest expense relates to fixed and variable overhead costs, the largest component of which is personnel expenses, including salaries and employee benefits. Certain expenses tend to vary based on the volume of activity and other factors, including data processing and communication expenses, occupancy, equipment expense, regulatory assessments and fees, marketing and business development costs, insurance expenses and other operating expenses.
Data processing and communication expenses primarily relate to expenses paid to third party providers of core processing, cloud computing and cybersecurity, a substantial component of which is paid to a core technology provider we rely on for the banking software used by our clients and back office functions. Professional services expenses include internal and external audit, legal, loan review, compliance audit and compliance monitoring fees. Occupancy and equipment expenses includes depreciation for buildings and improvements, fixtures and furniture, equipment, and technology related items as well as building related expenses such as utilities and maintenance costs. The Commonwealth of Virginia levies a capital-based franchise tax on banks operating within the state, replacing the state income tax. FDIC and regulatory assessments represent costs incurred to cover quarterly or semi-annual payments to the FDIC or OCC for their insurance or supervision. FDIC assessments are based on a complicated matrix of factors to form an assessment rate, which is then applied to a base of quarterly average assets less quarterly tangible equity. Directors fees represent fees paid to our directors for board or committee meetings. Marketing and business development costs include sponsorships, membership dues, as well as marketing and advertising costs, which are subject to normal variability based on the volume and cost of sponsorship and business development activities. Other operating costs include other operating and administrative costs such as other vendor and employee costs, postage and printing, office supplies, and subscriptions.
As discussed above, we expect our non-interest expenses to increase as a result of the additional costs associated with being a public company.
Primary Factors Used to Evaluate Our Financial Condition
The most significant factors we use to evaluate and manage our financial condition include liquidity, asset quality and capital.
Liquidity. Maintaining an adequate level of liquidity depends on our ability to efficiently meet both expected and unexpected cash flows and collateral needs without adversely affecting our daily operations or the financial condition of the Bank. Because low-cost deposits form a primary source of our funding, and generally can be withdrawn on demand, managing our liquidity is a top priority. Our account at the Federal Reserve, which held $338.0 million as of March 31, 2024, is a primary source of our liquidity for daily and ongoing activities. For regulatory reporting purposes, the liquidity ratio is typically calculated as the sum of cash and cash equivalents plus unpledged securities classified as investment grade divided by total liabilities. Based on this calculation method, as of March 31, 2024 and December 31, 2023, our reported liquidity ratios were was 79.36% and 78.75%, respectively. It is important to note that these ratios are point-in-time measurements and may not be indicative of future liquidity positions.
Asset Quality. We monitor the quality of our assets based upon several factors, including the level and severity of deterioration in borrower cash flows and asset quality. We aim to adjust the allowance for credit losses to reflect loan volumes, identified credit and collateral conditions, economic conditions and other qualitative factors.
68
Table of Contents
Capital. We manage capital to comply with our internal planning targets and regulatory capital standards. We monitor capital levels on an ongoing basis, perform periodic evaluations under stress scenarios and project capital levels in connection with our strategic goals to ensure appropriate capital levels. We evaluate a number of capital ratios, including Tier 1 capital to total quarterly average assets (the leverage ratio) and total Tier 1 capital to risk weighted assets.
Critical Accounting Policies and Estimates
We prepare our consolidated financial statements according to generally accepted accounting principles in the United States (GAAP). Preparing these statements requires management to make estimates and assumptions that affect the reported amounts of assets and liabilities on the balance sheet and the reported amounts of revenues and expenses during the reporting period. We believe that the estimates most susceptible to significant change in the near term relate to determining the allowance for credit losses on loans and held-to-maturity securities. Our significant accounting policies and the effects of new accounting pronouncements are detailed in Note 1, Organization and Summary of Significant Accounting Policies to our consolidated financial statements and the notes thereto included elsewhere in this prospectus.
Results of Operations
Net Income
The following table sets forth the principal components of net income for the periods indicated.
| For Three Months Ended, March 31, | For Years Ended December 31, | |||||||||||||||||||||||||||||||
| (dollars in thousands) | 2024 | 2023 | $ Change |
% Change |
2023 | 2022 | $ Change |
% Change |
||||||||||||||||||||||||
| Interest and dividend income |
$ | 9,699 | $ | 7,343 | $ | 2,356 | 32.1 | % | $ | 31,789 | $ | 27,384 | $ | 4,405 | 16.1 | % | ||||||||||||||||
| Interest expense |
907 | 882 | 25 | 2.8 | % | 4,046 | 1,283 | 2,763 | 215.4 | % | ||||||||||||||||||||||
|
|
|
|
|
|
|
|
|
|
|
|
|
|
|
|
|
|||||||||||||||||
| Net interest income |
8,792 | 6,461 | 2,331 | 36.1 | % | 27,743 | 26,101 | 1,642 | 6.3 | % | ||||||||||||||||||||||
| (Recapture of) provision for credit losses |
(194 | ) | 775 | (969 | ) | NM | 641 | 822 | (181 | ) | (22.0 | %) | ||||||||||||||||||||
|
|
|
|
|
|
|
|
|
|
|
|
|
|
|
|
|
|||||||||||||||||
| Net interest income |
8,986 | 5,686 | 3,300 | 58.0 | % | 27,102 | 25,279 | 1,823 | 7.2 | % | ||||||||||||||||||||||
| Non-interest income |
1,648 | 283 | 1,365 | 482.3 | % | 3,281 | 3,110 | 171 | 5.5 | % | ||||||||||||||||||||||
| Non-interest expense |
5,741 | 4,715 | 1,026 | 21.8 | % | 19,477 | 18,226 | 1,251 | 6.9 | % | ||||||||||||||||||||||
|
|
|
|
|
|
|
|
|
|
|
|
|
|
|
|
|
|||||||||||||||||
| Net income before taxes |
4,893 | 1,254 | 3,639 | 290.2 | % | 10,906 | 10,163 | 743 | 7.3 | % | ||||||||||||||||||||||
| Income tax expense |
976 | 206 | 770 | 373.8 | % | 2,076 | 1,882 | 194 | 10.3 | % | ||||||||||||||||||||||
|
|
|
|
|
|
|
|
|
|
|
|
|
|
|
|
|
|||||||||||||||||
| Net income |
$ | 3,917 | $ | 1,048 | $ | 2,869 | 273.8 | % | $ | 8,830 | $ | 8,281 | $ | 549 | 6.6 | % | ||||||||||||||||
|
|
|
|
|
|
|
|
|
|
|
|
|
|
|
|
|
|||||||||||||||||
NM Comparisons from positive to negative values or to zero values are considered not meaningful.
For the three months ended March 31, 2024, our net income increased by $2.9 million compared to the three months ended March 31, 2023 primarily due to a $2.3 million, or 36.1%, increase in net interest income. Earnings also benefited from a $1.4 million increase in non-interest income, derived primarily from fee income earned from one-way sell ICS® deposit accounts, and the reduction of the credit loss provision totaling $969 thousand, primarily resulting from the partial recovery of a bond in the first quarter of 2024 that was charged off during the first quarter of 2023. An increase of $1.0 million in non-interest expense, driven most notably by increases in employment and professional services costs, partially offset these positive earnings components.
For the year ended December 31, 2023, our net income increased by $549 thousand, or 6.6%, compared to the prior year primarily due a $1.6 million, or 6.3%, increase in net interest income, partially offset by an increase of $1.3 million, or 6.9%, in non-interest expenses driven by growing employee compensation and data processing costs.
69
Table of Contents
Net Interest Income Analysis
Our operating results depend primarily on our net interest income, which is calculated as the difference between interest income on interest-earning assets and interest expense on interest-bearing liabilities. Interest and dividend income consists of interest and fees on loans, interest and dividends on taxable and tax-exempt securities, and interest on interest-bearing deposits in banks. Interest expense consists of interest we pay on deposits and short-term borrowings.
| For Three Months Ended, March 31, | For Years Ended December 31, | |||||||||||||||||||||||||||||||
| (dollars in thousands) | 2024 | 2023 | $ Change |
% Change |
2023 | 2022 | $ Change |
% Change |
||||||||||||||||||||||||
| Interest and dividend income Interest and fees on loans |
$ | 3,280 | $ | 3,388 | $ | (108 | ) | (3.2 | %) | $ | 13,402 | $ | 11,311 | $ | 2,091 | 18.5 | % | |||||||||||||||
| Interest and dividends on securities, taxable |
2,866 | 2,823 | 43 | 1.5 | % | 11,112 | 9,190 | 1,922 | 20.9 | % | ||||||||||||||||||||||
| Interest on securities, tax exempt |
294 | 307 | (13 | ) | (4.2 | %) | 1,219 | 1,294 | (75 | ) | (5.8 | %) | ||||||||||||||||||||
| Interest on interest-bearing deposits in banks |
3,259 | 825 | 2,434 | 295.0 | % | 6,056 | 5,589 | 467 | 8.4 | % | ||||||||||||||||||||||
|
|
|
|
|
|
|
|
|
|
|
|
|
|
|
|
|
|||||||||||||||||
| Total interest and dividend income |
9,699 | 7,343 | 2,356 | 32.1 | % | 31,789 | 27,384 | 4,405 | 16.1 | % | ||||||||||||||||||||||
|
|
|
|
|
|
|
|
|
|
|
|
|
|
|
|
|
|||||||||||||||||
| Interest expense |
808 | 790 | 18 | 2.3 | % | 3,664 | 1,082 | 2,582 | 238.6 | % | ||||||||||||||||||||||
| Interest on short-term borrowings |
99 | 92 | 7 | 7.6 | % | 382 | 201 | 181 | 90.0 | % | ||||||||||||||||||||||
|
|
|
|
|
|
|
|
|
|
|
|
|
|
|
|
|
|||||||||||||||||
| Total interest expense |
907 | 882 | 25 | 2.8 | % | 4,046 | 1,283 | 2,763 | 215.4 | % | ||||||||||||||||||||||
|
|
|
|
|
|
|
|
|
|
|
|
|
|
|
|
|
|||||||||||||||||
| Net interest income |
$ | 8,792 | $ | 6,461 | $ | 2,331 | 36.1 | % | $ | 27,743 | $ | 26,101 | $ | 1,642 | 6.3 | % | ||||||||||||||||
|
|
|
|
|
|
|
|
|
|
|
|
|
|
|
|
|
|||||||||||||||||
70
Table of Contents
Interest income and expense are affected by fluctuations in interest rates, by changes in the volume of earning assets and interest-bearing liabilities, and by the interaction of these rate and volume factors. The following table presents an analysis of net interest income and net interest margin for the periods indicated. We divide each asset or liability segments income or expense by its average daily balance to calculate the average yield or cost.
| Three months ended March 31, | ||||||||||||||||||||||||
| 2024 | 2023 | |||||||||||||||||||||||
| (dollars in thousands) | Average balance |
Interest | Average yield/cost |
Average balance |
Interest | Average yield/cost |
||||||||||||||||||
| Assets |
||||||||||||||||||||||||
| Interest-earning assets: |
||||||||||||||||||||||||
| Interest-bearing deposits in other banks |
$ | 237,726 | $ | 3,259 | 5.56 | % | $ | 71,714 | $ | 825 | 4.67 | % | ||||||||||||
| Investment securities, taxable |
503,404 | 2,866 | 2.31 | % | 527,392 | 2,823 | 2.17 | % | ||||||||||||||||
| Investment securities, tax exempt |
64,822 | 294 | 1.84 | % | 67,864 | 307 | 1.83 | % | ||||||||||||||||
| Loans |
303,063 | 3,280 | 4.39 | % | 321,557 | 3,388 | 4.27 | % | ||||||||||||||||
|
|
|
|
|
|
|
|
|
|
|
|
|
|||||||||||||
| Total interest-earning assets |
1,109,015 | 9,699 | 3.55 | % | 988,527 | 7,343 | 3.01 | % | ||||||||||||||||
| Less allowance for credit losses |
(4,671 | ) | (4,847 | ) | ||||||||||||||||||||
|
|
|
|
|
|||||||||||||||||||||
| Non-interest-earning assets |
26,170 | 25,931 | ||||||||||||||||||||||
|
|
|
|
|
|||||||||||||||||||||
| Total assets |
$ | 1,130,514 | $ | 1,009,611 | ||||||||||||||||||||
|
|
|
|
|
|||||||||||||||||||||
| Liabilities and Shareholders Equity |
||||||||||||||||||||||||
| Interest-bearing liabilities: |
||||||||||||||||||||||||
| Savings, interest-bearing checking and money market accounts |
$ | 247,771 | $ | 693 | 1.13 | % | $ | 280,732 | $ | 726 | 1.05 | % | ||||||||||||
| Time deposits |
15,839 | 115 | 2.94 | % | 14,261 | 64 | 1.82 | % | ||||||||||||||||
| Short term borrowings |
5,000 | 99 | 8.03 | % | 5,667 | 92 | 6.58 | % | ||||||||||||||||
|
|
|
|
|
|
|
|
|
|
|
|
|
|||||||||||||
| Total interest-bearing liabilities |
268,610 | 907 | 1.37 | % | 300,660 | 882 | 1.19 | % | ||||||||||||||||
| Demand deposits |
771,149 | 634,431 | ||||||||||||||||||||||
| Other liabilities |
5,046 | 3,638 | ||||||||||||||||||||||
|
|
|
|
|
|||||||||||||||||||||
| Total liabilities |
1,044,805 | 938,775 | ||||||||||||||||||||||
| Shareholders equity |
85,709 | 70,836 | ||||||||||||||||||||||
|
|
|
|
|
|||||||||||||||||||||
| Total liabilities and shareholders equity |
$ | 1,130,514 | $ | 1,009,611 | ||||||||||||||||||||
|
|
|
|
|
|||||||||||||||||||||
| Net interest income |
$ | 8,792 | $ | 6,461 | ||||||||||||||||||||
|
|
|
|
|
|||||||||||||||||||||
| Net interest spread |
2.18 | % | 1.82 | % | ||||||||||||||||||||
|
|
|
|
|
|||||||||||||||||||||
| Net interest margin |
3.15 | % | 2.60 | % | ||||||||||||||||||||
|
|
|
|
|
|||||||||||||||||||||
71
Table of Contents
| Year ended December 31, | ||||||||||||||||||||||||
| 2023 | 2022 | |||||||||||||||||||||||
| (dollars in thousands) | Average balance |
Interest | Average yield/cost |
Average balance |
Interest | Average yield/cost |
||||||||||||||||||
| Assets |
||||||||||||||||||||||||
| Interest-earning assets: |
||||||||||||||||||||||||
| Interest-bearing deposits in other banks |
$ | 114,088 | $ | 6,056 | 5.31 | % | $ | 394,268 | $ | 5,589 | 1.42 | % | ||||||||||||
| Investment securities, taxable |
514,433 | 11,112 | 2.16 | % | 503,227 | 9,190 | 1.83 | % | ||||||||||||||||
| Investment securities, tax exempt |
67,055 | 1,219 | 1.82 | % | 70,605 | 1,294 | 1.83 | % | ||||||||||||||||
| Loans |
314,444 | 13,402 | 4.26 | % | 292,170 | 11,311 | 3.87 | % | ||||||||||||||||
|
|
|
|
|
|
|
|
|
|
|
|
|
|||||||||||||
| Total interest-earning assets |
1,110,020 | 31,789 | 3.15 | % | 1,260,270 | 27,384 | 2.17 | % | ||||||||||||||||
| Less allowance for credit losses |
(4,792 | ) | (3,904 | ) | ||||||||||||||||||||
|
|
|
|
|
|||||||||||||||||||||
| Non-interest-earning assets |
26,184 | 25,729 | ||||||||||||||||||||||
|
|
|
|
|
|||||||||||||||||||||
| Total assets |
$ | 1,031,412 | $ | 1,282,095 | ||||||||||||||||||||
|
|
|
|
|
|||||||||||||||||||||
| Liabilities and Shareholders Equity |
||||||||||||||||||||||||
| Interest-bearing liabilities: |
||||||||||||||||||||||||
| Savings, interest-bearing checking and money market accounts |
$ | 284,705 | $ | 3,147 | 1.11 | % | $ | 211,451 | $ | 1,014 | 0.48 | % | ||||||||||||
| Time deposits |
18,037 | 517 | 2.87 | % | 11,716 | 68 | 0.58 | % | ||||||||||||||||
| Short term borrowings |
5,167 | 382 | 7.39 | % | 5,002 | 201 | 4.02 | % | ||||||||||||||||
|
|
|
|
|
|
|
|
|
|
|
|
|
|||||||||||||
| Total interest-bearing liabilities |
307,909 | 4,046 | 1.31 | % | 228,169 | 1,238 | 0.56 | % | ||||||||||||||||
| Demand deposits |
645,418 | 986,118 | ||||||||||||||||||||||
| Other liabilities |
3,875 | 3,043 | ||||||||||||||||||||||
|
|
|
|
|
|||||||||||||||||||||
| Total liabilities |
957,202 | 1,217,330 | ||||||||||||||||||||||
| Shareholders equity |
74,210 | 64,765 | ||||||||||||||||||||||
|
|
|
|
|
|||||||||||||||||||||
| Total liabilities and shareholders equity |
$ | 1,031,412 | $ | 1,282,095 | ||||||||||||||||||||
|
|
|
|
|
|||||||||||||||||||||
| Net interest income |
$ | 27,743 | $ | 26,101 | ||||||||||||||||||||
|
|
|
|
|
|||||||||||||||||||||
| Net interest spread |
1.83 | % | 1.61 | % | ||||||||||||||||||||
|
|
|
|
|
|||||||||||||||||||||
| Net interest margin |
2.69 | % | 2.04 | % | ||||||||||||||||||||
|
|
|
|
|
|||||||||||||||||||||
72
Table of Contents
The rate/volume table below presents the composition of the change in net interest income for the periods indicated, as allocated between the change in net interest income due to a change in the volume of average earning assets and interest-bearing liabilities, and the changes in net interest income that are due to changes in average rates. Volume and rate changes are allocated on a consistent basis using the respective percentage changes in average balances and average rates.
| For the three months ended March 31, 2024 compared to 2023 |
For the year ended December 31, 2023 compared to 2022 |
|||||||||||||||||||||||
| Increase (decrease) due to change in: | ||||||||||||||||||||||||
| (dollars in thousands) | Average volume |
Average rate |
Total | Average volume |
Average rate |
Total | ||||||||||||||||||
| Interest-earning assets |
||||||||||||||||||||||||
| Interest-bearing deposits in other banks |
$ | 1,910 | $ | 524 | $ | 2,434 | $ | (3,972 | ) | $ | 4,439 | $ | 467 | |||||||||||
| Taxable investment securities |
(128 | ) | 171 | 43 | 205 | 1,717 | 1,922 | |||||||||||||||||
| Non-taxable investment securities |
(14 | ) | 1 | (13 | ) | (65 | ) | (10 | ) | (75 | ) | |||||||||||||
| Loans |
(195 | ) | 87 | (108 | ) | 862 | 1,229 | 2,091 | ||||||||||||||||
|
|
|
|
|
|
|
|
|
|
|
|
|
|||||||||||||
| Total increase (decrease) in interest income |
$ | (1,573 | ) | $ | 783 | $ | 2,356 | $ | (2,970 | ) | $ | 7,375 | $ | 4,405 | ||||||||||
|
|
|
|
|
|
|
|
|
|
|
|
|
|||||||||||||
| Interest-bearing liabilities |
||||||||||||||||||||||||
| Savings, interest-bearing checking and money market accounts |
$ | (85 | ) | $ | 52 | $ | (33 | ) | $ | 351 | $ | 1,782 | $ | 2,133 | ||||||||||
| Time deposits |
7 | 44 | 51 | 37 | 412 | 449 | ||||||||||||||||||
| Short term debt |
(11 | ) | 18 | 7 | 7 | 174 | 118 | |||||||||||||||||
|
|
|
|
|
|
|
|
|
|
|
|
|
|||||||||||||
| Total increase (decrease) in interest expense |
$ | (89 | ) | $ | 114 | $ | 25 | $ | 395 | $ | 2,368 | $ | 2,763 | |||||||||||
|
|
|
|
|
|
|
|
|
|
|
|
|
|||||||||||||
| Increase (decrease) in net interest income |
$ | 1,662 | $ | 669 | $ | 2,331 | $ | (3,364 | ) | $ | 5,006 | $ | 1,642 | |||||||||||
|
|
|
|
|
|
|
|
|
|
|
|
|
|||||||||||||
For the three months ended March 31, 2024, our net interest income increased by $2.3 million, or 36.1%, compared to the three months ended March 31, 2023, primarily driven by a $166.0 million increase in the average volume of interest-bearing deposits in other banks, principally at the Federal Reserve. Our net interest margin increased from 2.60% in the first quarter of 2023 to 3.15% in the first quarter of 2024. For the year ended December 31, 2023, our net interest income increased 6.3% to $27.7 million from the prior year primarily driven by rate increases across all segments of interest-earning assets, and an increase in the average balance of deposits at other banks. Our net interest margin increased to 2.69% for the year ended December 31, 2023 from 2.04% for the year ended December 31, 2022. These positive earnings components were partially offset by increases to the rates paid and average balances among the non-maturity interest-bearing deposits segments.
Interest Income
Interest income and fees on loans. Loan interest income is comprised of fixed and adjustable-rate structures related to residential and commercial real estate loan products, commercial loans and other consumer loan products. Deferred loan origination fees, net of deferred loan origination costs, accrete to the loans yield over the life of the loan. For the three months ended March 31, 2024, our interest and fees on loans decreased 3.2% to $3.3 million compared to the three months ended March 31, 2023 primarily driven by a reduction of the average total loan balance of $18.5 million. The first quarter following a general election, such as the first quarter of 2023, often experiences high outstanding commercial and industrial loan balances because political organizations typically draw upon their lines of credit surrounding a general election and repay the lines over the following six to twelve month period. In addition, rising interest rates caused a reduction in demand for consumer loans during the time between interim periods, and management has strategically allowed a decline in the commercial real estate portfolio. Rising interest rates have increased the cost of borrowing and remote work trends continue to be a concern. These factors negatively impact the value of commercial properties, making commercial real estate loans less attractive.
73
Table of Contents
For the year ended December 31, 2023, our interest and fees on loans increased 18.5% to $13.4 million from $11.3 million for the year ended December 31, 2022. The income improvement was primarily driven by an increase of $22.3 million in average total loan balances, which is largely attributable to higher outstanding balances among our residential mortgage products. Consumer demand for residential mortgages was steady during 2022 and through March 31, 2023, although it has somewhat tapered off in periods thereafter as a result of rising interest rates.
See Financial Condition Loan Portfolio below for an analysis of the composition of our loan portfolio.
Interest income and dividends on securities, taxable. For the three months ended March 31, 2024, our interest and dividends on taxable securities increased 1.5% to $2.9 million from $2.8 million for the three months ended March 31, 2023. The average balance for all taxable securities decreased $24.0 million as of March 31, 2024, although the decline was fully offset by a 14 basis point increase in yield. As portions of maturing bonds have been reinvested, we have observed a steady increase in the average yield for the taxable securities portfolio. For the year ended December 31, 2023, our interest and dividends on taxable securities was $11.1 million, a 20.9% increase, compared to $9.2 million for the prior year primarily driven by an $11.2 million increase in average balances coupled with a 33 basis point increase in the average yield for the portfolio.
Interest income on securities, tax-exempt. For the three months ended March 31, 2024, our interest on tax-exempt securities decreased 4.2% from the prior period due primarily to a $3.0 million decline in the average balance of tax-exempt securities. In recent years, the attainable yields for any new investment in this segment and the investment landscape have left tax-exempt securities less attractive than their taxable counterparts. Accordingly, as tax-exempt securities have matured, those proceeds have been invested into taxable municipal securities. For the year ended December 31, 2023, our interest on tax exempt securities decreased 5.8% from the prior period primarily driven by a $3.6 million decrease in the average balance of tax-exempt securities.
See Financial Condition Securities below for an analysis of the composition of the securities portfolio, including taxable and tax-exempt securities.
Interest income on interest-bearing deposits in banks. Chain Bridge earns interest for accounts held at certain correspondent banks, with deposits at the Federal Reserve comprising most of the total balance. The Federal Reserve has historically adjusted its interest on reserves rate in conjunction with the Federal Open Market Committees federal funds rate. As of March 31, 2024 and December 31, 2023, the interest rate paid by the Federal Reserve was 5.40%. For the three months ended March 31, 2024, our interest on interest-bearing deposits in banks increased by $2.4 million compared the prior period, primarily driven by a $166.0 million increase in average balances in combination with an 89 basis point increase in the average rate earned. For the year ended December 31, 2023, our interest on interest-bearing deposits in banks increased 8.4% compared to the prior period primarily driven by a 3.89% increase in the average rate, partially offset by a $280.2 million decrease in average balances.
Interest Expense
Interest expense on deposits. The Bank pays a variable interest rate to depositors for their non-maturing savings, interest-bearing checking, and money market accounts. In addition, the Bank issues time deposits that pay a fixed rate of interest until the instrument matures. For the three months ended March 31, 2024, our interest expense on deposits increased 2.3% compared to the prior period. The slight increase was primarily driven by a 16 basis point increase in the average rate, partially offset by a $31.4 million decrease in average interest-bearing deposit balances. For the year ended December 31, 2023, our interest expense on deposits increased by $2.6 million compared to the prior period, driven by a 73 basis point increase in the average rate combined with a $79.6 million increase in the average balance. As of March 31, 2024 and December 31, 2023, approximately 73.4% and 69.0%, respectively, of our deposits were non-interest bearing.
74
Table of Contents
See Financial Condition Deposits for an analysis of the composition of the deposits portfolio, including its interest-bearing and non-interest-bearing components.
Interest expense on short-term borrowings. The Company has an unsecured line of credit with a correspondent bank, totaling $10.0 million with an outstanding balance of $5.0 million as of March 31, 2024. The majority of interest on short-term borrowings is in relation to this line of credit, but if the Bank drew upon its lines of credit with the FHLB or other correspondent banks, the related interest would also be recorded here. For the three months ended March 31, 2024, our interest on short-term borrowings increased 7.6% from the prior period primarily driven by an increase in the average rate paid. For the year ended December 31, 2023, our interest expense on short-term borrowings increased 90.0% compared to the prior period driven by an increase in the yield on these liabilities from 4.02% to 7.39%.
Provision for Credit Losses
The allowance for credit losses (ACL) represents an amount which, in managements judgment, is adequate to absorb the lifetime expected credit losses that may be sustained on outstanding loans and investments at the balance sheet date. The provision for credit losses represents the amount of expense charged to current earnings to fund an increase in the ACL. Conversely, a recapture of credit loss is recorded to earnings when the ACL is reduced. Our provisions for or recaptures of credit losses arising from within the loan and securities portfolios were as follows:
| For Three Months Ended, March 31, |
For Years Ended December 31, | |||||||||||||||||||||||||||||||
| (dollars in thousands) | 2024 | 2023 | $ Change |
% Change |
2023 | 2022 | $ Change |
% Change |
||||||||||||||||||||||||
| (Recapture of) provision for credit losses |
||||||||||||||||||||||||||||||||
| Provision for (recapture of) loan credit losses |
$ | 5 | $ | (23 | ) | $ | 28 | NM | $ | (163 | ) | $ | 822 | $ | (985 | ) | NM | |||||||||||||||
| (Recapture of) provision for securities credit losses |
(199 | ) | 798 | (997 | ) | NM | 804 | | 804 | NM | ||||||||||||||||||||||
|
|
|
|
|
|
|
|
|
|
|
|
|
|
|
|
|
|||||||||||||||||
| Total (recapture of) provision for credit losses |
(194 | ) | 775 | (969 | ) | NM | 641 | 822 | (181 | ) | (22.0 | %) | ||||||||||||||||||||
|
|
|
|
|
|
|
|
|
|
|
|
|
|
|
|
|
|||||||||||||||||
NM Comparisons from positive to negative values or to zero values are considered not meaningful.
For the three months ended March 31, 2024, our provision for credit losses consisted of a net recapture of $194 thousand, compared to a net provision of $775 thousand for the three months ended March 31, 2023. During the three months ended March 31, 2024, we received proceeds totaling $210 thousand for a bond we wrote off in its entirety during the three months ended March 31, 2023 related to a single corporate issuer whose business was ultimately closed by a regulatory authority. For the year ended December 31, 2023, our provision for credit losses decreased 22.0% from the prior period due primarily to the recapture of $163 thousand in credit losses in 2023 driven by a reduction in our loan portfolio, which was $16.0 million lower as of December 31, 2023 compared to December 31, 2022. The $804 thousand provision for securities credit losses recorded in 2023 pertains to a single corporate bond discussed above. The $822 thousand credit loss provision for loans recorded in 2022 was primarily driven by growth in the loan portfolio.
75
Table of Contents
Non-Interest Income
Non-interest income consists of deposit placement services income, service charges on deposit accounts, trust and wealth management income, gains on sale of mortgage loans, net gains or losses on sales of securities and other income.
| Three Months Ended March 31, | Year Ended December 31, | |||||||||||||||||||||||||||||||
| (dollars in thousands) | 2024 | 2023 | $ Change |
% Change |
2023 | 2022 | $ Change |
% Change |
||||||||||||||||||||||||
| Non-interest Income |
||||||||||||||||||||||||||||||||
| Deposit placement services income |
$ | 1,122 | $ | 16 | $ | 1,106 | 6,912.5 | % | $ | 1,974 | $ | 1,543 | $ | 431 | 28.0 | % | ||||||||||||||||
| Service charges on accounts |
311 | 200 | 111 | 55.5 | % | 918 | 1,154 | (236 | ) | (20.4 | %) | |||||||||||||||||||||
| Trust and wealth management income |
187 | 112 | 75 | 67.0 | % | 565 | 335 | 230 | 68.6 | % | ||||||||||||||||||||||
| Gain on sale of mortgage loans |
| | | | 12 | 18 | (6 | ) | (32.5 | %) | ||||||||||||||||||||||
| Loss on sale of securities |
| (84 | ) | 84 | NM | (389 | ) | | (389 | ) | NM | |||||||||||||||||||||
| Other income |
28 | 39 | (11 | ) | (28.2 | %) | 201 | 60 | 141 | 231.5 | % | |||||||||||||||||||||
|
|
|
|
|
|
|
|
|
|
|
|
|
|
|
|
|
|||||||||||||||||
| Total non-interest income |
$ | 1,648 | $ | 283 | $ | 1,365 | 482.3 | % | $ | 3,281 | $ | 3,110 | $ | 171 | 5.5 | % | ||||||||||||||||
NM Comparisons from positive to negative values or to zero values are considered not meaningful.
For the three months ended March 31, 2024, our non-interest income increased by $1.4 million to $1.6 million compared to the three months ended March 31, 2023 primarily driven by an increase in deposit placement services income, which is fee income we earn on one-way sell deposits sold through the ICS® network. For the year ended December 31, 2023, our non-interest income increased by 5.5% to $3.3 million compared to the prior period primarily driven by an increase in fee income on one-way sell deposits sold through the ICS® network, and partially offset by a loss on the sale of corporate bonds.
Deposit placement services income. As of March 31, 2024 and December 31, 2023, one-way sell ICS® deposits totaled $289.2 million and $130.1 million, respectively. There were no one-way sell ICS® deposits as of March 31, 2023 or December 31, 2022. For the three months ended March 31, 2024, our deposit placement services income increased by $1.1 million compared to the three months ended March 31, 2023. For the year ended December 31, 2023, our deposit placement services income increased by 28.0% to $2.0 million compared to the prior year. During both comparative periods, the increase in deposit placement services income is a direct result of the increase in the volume of one-way sell ICS® deposits, and changes in the rate paid by ICS® for those deposits which typically adjust in a manner parallel to federal funds rate adjustments. Accounts enrolled in the ICS® network are further discussed under Financial Condition Deposits below.
Service charges on accounts. For the three months ended March 31, 2024, our service charges on accounts increased by $111 thousand, or 55.5%, compared to the three months ended March 31, 2023 primarily driven by higher transaction volume, particularly among wire transfers and debit card usage. Our fee income is typically higher during the fiscal quarters prior to the general election as political organization deposit account activity causes an increase in bank transactions. For the year ended December 31, 2023, our service charges on accounts decreased 20.4% compared to the prior year as 2022 was a general election year with higher transaction activity such as wire transfers, cash letters, and debit card purchases among political organization deposit accounts compared to 2023.
Trust and wealth management income. For the three months ended March 31, 2024 and the year ended December 31, 2023, our trust and wealth management income increased by $75 thousand (or 67.0%) and $105 thousand (or 68.6%), respectively, compared to the corresponding period in the prior year due to an increase in the volume of total custody and managed assets, which increased 85.9% and 69.8% during the respective periods.
76
Table of Contents
Gain on sale of mortgage loans. For the three months ended March 31, 2024, and the three months ended March 31, 2023, we had no gains from sales of mortgage loans because there was no sales activity during the comparable periods. For the year ended December 31, 2023, our gain on sale of mortgage loans decreased by $6 thousand compared to the prior year. The volume of loans sales was minimal during 2022 and 2023 causing the related income to be similarly low.
Loss on sale of securities. Because Chain Bridge historically has not actively engaged in bond sales, gains and losses from sales of securities are irregular. For the three months ended March 31, 2024, we had no loss (or gain) on sales of securities compared to an $84 thousand loss for the three months ended March 31, 2023. For the year ended December 31, 2023, our loss on sale of securities was $389 thousand, compared to no loss (or gain) for the year ended December 31, 2022.
Other income. For the three months ended March 31, 2024, our other income decreased slightly compared to the three months ended March 31, 2023. For the year ended December 31, 2023, our other income increased by $141 thousand compared to the prior year. Other income for the year ended December 31, 2023 benefitted from a favorable legal ruling which enabled the Bank to recover $58 thousand of legal expenses incurred in a prior year, and other income during the year ended December 31, 2022 was impacted by a $63 thousand decline in the fair value of an equity security.
Non-Interest Expense
Non-interest expense consists of salaries and employee benefits, data processing and communication expenses, professional services, occupancy and equipment expenses, Virginia bank franchise tax, FDIC and regulatory assessments, directors fees, marketing and business development costs, insurance expenses, and other operating expenses.
| Three Months Ended March 31, | Year Ended December 31, | |||||||||||||||||||||||||||||||
| (dollars in thousands) | 2024 | 2023 | $ Change |
% Change |
2023 | 2022 | $ Change |
% Change |
||||||||||||||||||||||||
| Non-interest Expenses |
||||||||||||||||||||||||||||||||
| Salaries and employee benefits |
$ | 3,485 | $ | 3,021 | $ | 464 | 15.4 | % | $ | 12,359 | $ | 11,173 | $ | 1,186 | 10.6 | % | ||||||||||||||||
| Data processing and communication expenses |
595 | 546 | 49 | 9.0 | % | 2,276 | 1,965 | 311 | 15.8 | % | ||||||||||||||||||||||
| Professional services |
465 | 212 | 253 | 119.3 | % | 909 | 1,367 | (458 | ) | (33.5 | %) | |||||||||||||||||||||
| Occupancy and equipment expenses |
275 | 224 | 51 | 22.8 | % | 936 | 932 | 4 | 0.4 | % | ||||||||||||||||||||||
| Virginia bank franchise tax |
203 | 188 | 15 | 8.0 | % | 739 | 627 | 112 | 17.9 | % | ||||||||||||||||||||||
| FDIC and regulatory assessments |
193 | 128 | 65 | 50.8 | % | 585 | 848 | (263 | ) | (31.0 | %) | |||||||||||||||||||||
| Directors fees |
161 | 91 | 70 | 76.9 | % | 367 | 371 | (4 | ) | (1.1 | %) | |||||||||||||||||||||
| Marketing and business development costs |
72 | 88 | (16 | ) | (18.2 | %) | 239 | 189 | 50 | 26.5 | % | |||||||||||||||||||||
| Insurance expenses |
60 | 55 | 5 | 9.1 | % | 225 | 126 | 99 | 78.6 | % | ||||||||||||||||||||||
| Other operating expenses |
232 | 162 | 70 | 43.2 | % | 842 | 628 | 214 | 34.1 | % | ||||||||||||||||||||||
|
|
|
|
|
|
|
|
|
|
|
|
|
|
|
|
|
|||||||||||||||||
| Total non-interest expenses |
$ | 5,741 | $ | 4,715 | $ | 1,026 | 21.8 | % | $ | 19,477 | $ | 18,226 | $ | 1,251 | 6.9 | % | ||||||||||||||||
For the three months ended March 31, 2024, our non-interest expense increased by $1.0 million, or 21.8%, compared to the three months ended March 31, 2023 primarily driven by increases in salaries and benefits and professional service expenses. For the year ended December 31, 2023, our non-interest expense increased by $1.3 million, or 6.9%, compared to the prior year primarily driven by increases in salaries and employee benefit costs as well as an increase in data processing costs, partially offset by a decrease in professional services costs.
Salaries and employee benefits. For the three months ended March 31, 2024, our salaries and employee benefits increased by $464 thousand, or 15.4%, compared to the three months ended March 31, 2023 resulting
77
Table of Contents
from higher headcount and salary increases. During the year ended December 31, 2023, our salaries and employee benefits increased $1.2 million, or 10.6%, compared to the prior year driven by salary increases and higher employee benefits expense and a reduction of $142 thousand in the amount of loan origination costs deferred during the year. Deferred loan origination costs have the effect of reducing salaries expense during the period when a loan is originated. When loan origination volume declines, so too does the amount of deferred loan origination costs.
Data processing and communication expenses. For the three months ended March 31, 2024, our data processing and communication expenses increased $49 thousand, or 9.0%, compared to the three months ended March 31, 2023 driven by higher data processing expenses charged by our core provider, the installation of a new financial reporting tool, and increased costs associated with enhanced information technology (IT) functionality. For the year ended December 31, 2023, our data processing and communication expenses increased $311 thousand, or 15.8%, compared to the prior year primarily driven by increased data processing fees charged by our core provider arising from periodic rate increases and purchases of new products, increased cloud computing and cybersecurity costs incurred with our IT managed services provider, and an increase in core processing expenses incurred by the Trust & Wealth department on account of growth in managed assets and custody accounts.
Professional services. For the three months ended March 31, 2024, our professional services expense increased $253 thousand compared to the three months ended March 31, 2023 primarily driven by legal and consulting expenses incurred in connection with a corporate restructuring project. For the year ended December 31, 2023, our professional services expense decreased $458 thousand, or 33.5%, compared to the prior year due to higher legal expenses during the year ended December 31, 2022, when the Bank was a defendant in a lawsuit that was ultimately decided in the Banks favor. In addition, the Bank incurred significant legal costs during 2022 to re-evaluate and renegotiate new insurance contracts.
Occupancy and equipment expenses. For the three months ended March 31, 2024, our occupancy and equipment expenses increased $51 thousand, or 22.8%, compared to the three months ended March 31, 2023 primarily driven by building maintenance costs. For the year ended December 31, 2023, our occupancy and equipment expenses were essentially unchanged from the prior year.
Virginia bank franchise tax. For the three months ended March 31, 2024 and the year ended December 31, 2023, our Virginia bank franchise tax increased 8.0% and 17.9%, respectively, compared to the corresponding period in the prior year. For both comparative periods discussed, the increase was primarily driven by the growth in the Banks capital through retained earnings.
FDIC and regulatory assessments. For the three months ended March 31, 2024, our FDIC and regulatory assessments expense increased $65 thousand, or 50.8%, due to the growth in the Banks assets between the comparative periods. For the year ended December 31, 2023, our FDIC and regulatory assessments decreased $263 thousand, or 31.0%, compared to the prior year primarily driven by an elevated 2022 FDIC assessment which resulted from high year over year asset growth and a declining leverage ratio. Fiscal year 2023, a non-election year, did not experience similar growth.
Directors fees. For the three months ended March 31, 2024, our directors fees increased $70 thousand compared to the three months ended March 31, 2023 primarily driven by an increase in the number of committee meetings and training for newly appointed members. For the year ended December 31, 2023, our directors fees were essentially unchanged from the prior year.
Marketing and business development costs. For the three months ended March 31, 2024, our marketing and business development costs decreased $16 thousand, or 18.2%, compared to the three months ended March 31, 2023 primarily driven by fewer sponsorship events during the first three months of 2024. For the year ended December 31, 2023, our marketing and business development costs increased $50 thousand, or 26.5%, compared
78
Table of Contents
to the prior year primarily driven by an increase in sponsored events, and related business development expenses, and partially offset by a decline in advertising costs.
Insurance expenses. For the three months ended March 31, 2024, our insurance expenses increased by $5 thousand, or 9.1%, compared to the three months ended March 31, 2023. For the year ended December 31, 2023, our insurance expenses increased by $99 thousand, or 78.6%, compared to the year ended December 31, 2022. For both comparative periods discussed, the increased expense was the result of enhanced coverage combined with growth in the Banks size and transaction volume.
Other operating costs. This segment includes other operating and administrative costs such as other vendor and employee costs, postage and printing, office supplies and subscriptions. None of the components or fluctuations are individually significant, and the increase in our other operating costs during both periods were driven primarily by increased administrative costs.
Income Tax Expense
Income tax expense incurred is based upon our pre-tax income adjusted for tax exempt income and temporary deferred tax assets or liabilities. For the three months ended March 31, 2024, our income tax expense was $976 thousand, representing an increase of $770 thousand compared to $206 thousand for the three months ended March 31, 2023. The increase was driven by the increase in pre-tax earnings. For the year ended December 31, 2023, our income tax expense was $2.1 million, representing an increase of $193 thousand, or 10.3%, compared to $1.9 million for the year ended December 31, 2022. This increase was also driven by an increase in pre-tax earnings which increased 7.3% during the comparison period.
Financial Condition
Securities
Our securities portfolio is used to provide liquidity, manage risk, meet capital requirements, and generate interest income. Our securities portfolio consists of U.S. government and federal agencies, mortgage backed securities, corporate bonds, and state and municipal securities. Securities that management has the positive intent and ability to hold to maturity are classified as held to maturity (HTM) and recorded at amortized cost. Securities not classified as held to maturity or trading, are classified as available for sale (AFS) and recorded at fair value, with unrealized gains and losses excluded from earnings and reported in other comprehensive loss. We do not hold trading securities.
79
Table of Contents
The following table summarizes the amortized cost and weighted average yield of securities as of March 31, 2024 by contractual maturities.
| Balance as of March 31, 2024 | ||||||||||||||||
| Available-for-Sale | Held-to-Maturity | |||||||||||||||
| (dollars in thousands) | Amortized Cost |
Weighted Average Yield |
Amortized Cost |
Weighted Average Yield |
||||||||||||
| U.S. government and federal agencies |
||||||||||||||||
| Due in one year or less |
$ | 67,490 | 2.85 | % | $ | 3,995 | 1.50 | % | ||||||||
| Due after one year through five years |
20,932 | 2.79 | % | 83,571 | 1.86 | % | ||||||||||
| Due after five years through ten years |
5,926 | 1.32 | % | 33,790 | 1.75 | % | ||||||||||
| Due after ten years |
| | 2,585 | 1.77 | % | |||||||||||
|
|
|
|
|
|
|
|
|
|||||||||
| 94,348 | 2.74 | % | 123,941 | 1.81 | % | |||||||||||
|
|
|
|
|
|
|
|
|
|||||||||
| Mortgage backed securities |
||||||||||||||||
| Due in one year or less |
501 | 2.71 | % | | | |||||||||||
| Due after one year through five years |
3,944 | 2.19 | % | | | |||||||||||
| Due after five through ten years |
| | | | ||||||||||||
| Due after ten years |
4,625 | 2.98 | % | 1,184 | 4.62 | % | ||||||||||
|
|
|
|
|
|
|
|
|
|||||||||
| 9,070 | 2.62 | % | 1,184 | 4.62 | % | |||||||||||
|
|
|
|
|
|
|
|
|
|||||||||
| Corporate bonds |
||||||||||||||||
| Due in one year or less |
26,581 | 3.00 | % | 1,885 | 2.01 | % | ||||||||||
| Due after one year through five years |
28,878 | 2.59 | % | 57,169 | 2.57 | % | ||||||||||
| Due after five years through ten years |
503 | 1.34 | % | 508 | 2.83 | % | ||||||||||
| Due after ten years |
496 | 8.27 | % | | | |||||||||||
|
|
|
|
|
|
|
|
|
|||||||||
| 56,458 | 2.82 | % | 59,562 | 2.55 | % | |||||||||||
|
|
|
|
|
|
|
|
|
|||||||||
| State and municipal securities |
||||||||||||||||
| Due in one year or less |
14,974 | 3.21 | % | 3,012 | 1.64 | % | ||||||||||
| Due after one year through five years |
59,813 | 2.41 | % | 43,250 | 2.33 | % | ||||||||||
| Due after five years through ten years |
29,750 | 2.07 | % | 76,781 | 2.26 | % | ||||||||||
| Due after ten years |
500 | 3.55 | % | 582 | 2.59 | % | ||||||||||
|
|
|
|
|
|
|
|
|
|||||||||
| $ | 105,037 | 2.43 | % | $ | 123,625 | 2.27 | % | |||||||||
|
|
|
|
|
|
|
|
|
|||||||||
The weighted average yield is calculated using the amortized cost and yield on each security. Each securitys amortized cost is multiplied by its yield and then divided by the respective category total. The resulting values are summed to arrive at the weighted average yield. The yields on tax-exempt securities have not been calculated on a fully tax equivalent basis.
The following table summarizes our securities portfolio by the type of securities as of the dates indicated:
| As of March 31, | ||||||||||||||||||||||||
| 2024 | 2023 | Change | ||||||||||||||||||||||
| (dollars in thousands) | Amount* | % of total securities |
Amount | % of total securities |
$ | % | ||||||||||||||||||
| U.S. government treasuries |
$ | 196,158 | 34.9 | % | $ | 197,034 | 33.3 | % | $ | (876 | ) | (0.4 | %) | |||||||||||
| U.S. federal agencies securities |
19,375 | 3.4 | % | 25,280 | 4.3 | % | (5,905 | ) | (23.4 | %) | ||||||||||||||
| Mortgage backed securities |
9,580 | 1.7 | % | 11,770 | 2.0 | % | (2,190 | ) | (18.6 | %) | ||||||||||||||
| Corporate bonds |
114,353 | 20.3 | % | 123,967 | 21.0 | % | (9,614 | ) | (7.8 | %) | ||||||||||||||
| State and Municipal securities |
223,726 | 39.7 | % | 232,642 | 39.4 | % | (8,916 | ) | (3.8 | %) | ||||||||||||||
|
|
|
|
|
|
|
|
|
|
|
|
|
|||||||||||||
| Total securities |
$ | 563,192 | 100.0 | % | $ | 590,693 | 100.0 | % | $ | (27,501 | ) | (4.7 | %) | |||||||||||
|
|
|
|
|
|
|
|
|
|
|
|
|
|||||||||||||
80
Table of Contents
| As of December 31, | ||||||||||||||||||||||||
| 2023 | 2022 | Change | ||||||||||||||||||||||
| (dollars in thousands) | Amount | % of total securities |
Amount | % of total securities |
$ | % | ||||||||||||||||||
| U.S. government treasuries |
$ | 195,364 | 34.5 | % | $ | 200,078 | 33.8 | % | $ | (4,714 | ) | (2.4 | %) | |||||||||||
| U.S. federal agencies securities |
20,871 | 3.7 | % | 24,751 | 4.2 | % | (3,880 | ) | (15.7 | %) | ||||||||||||||
| Mortgage backed securities |
9,839 | 1.7 | % | 11,851 | 2.0 | % | (2,012 | ) | (17.0 | %) | ||||||||||||||
| Corporate bonds |
115,101 | 20.3 | % | 125,072 | 21.1 | % | (9,971 | ) | (8.0 | %) | ||||||||||||||
| State and Municipal securities |
225,345 | 39.8 | % | 230,411 | 38.9 | % | (5,066 | ) | (2.2 | %) | ||||||||||||||
|
|
|
|
|
|
|
|
|
|
|
|
|
|||||||||||||
| Total securities |
$ | 566,520 | 100.0 | % | $ | 592,163 | 100.0 | % | $ | (25,643 | ) | (4.3 | %) | |||||||||||
|
|
|
|
|
|
|
|
|
|
|
|
|
|||||||||||||
| * | Available for sale securities are reported at fair value, and held to maturity securities are reported at amortized cost. |
Total securities. As of March 31, 2024, our total debt securities were $563.2 million excluding the allowance for credit loss, representing a decrease of $27.5 million, or 4.7%, compared to $590.7 million as of March 31, 2023. The decrease was primarily driven by bond maturities to provide additional liquidity, which was partially offset by a decrease in gross unrealized losses within the available for sale securities portfolio. As of December 31, 2023, our total securities were $566.5 million, representing a decrease of $25.6 million, or 4.3%, compared to $592.2 million as of December 31, 2022. During both comparative periods, the decline in the securities portfolio was due primarily to managements decision not to reinvest all called or matured bonds, opting instead to build cash reserves. Building cash reserves is intended to further strengthen our liquidity position in response to the bank failures of early 2023 and to support political organization deposit outflows expected in the third and fourth quarters of 2024.
U.S. government treasuries. U.S. government treasuries represent debt securities backed by the U.S. Treasury or the full faith and credit of the U.S. government and are guaranteed as to the timely payment of interest and principal when held to maturity. As of March 31, 2024, our U.S. government treasuries decreased by $876 thousand, or 0.4%, compared to March 31, 2023. As of December 31, 2023, our U.S. government treasuries decreased by $4.7 million, or 2.4%, compared to the prior year.
U.S. federal agencies securities. U.S. federal agencies securities represent obligations issued by U.S. federal government agencies or government-sponsored enterprises that guarantee repayment of principal at maturity. As of March 31, 2024, our U.S. federal agencies securities decreased by $5.9 million, or 23.4%, compared to March 31, 2023. As of December 31, 2023, our U.S. federal agencies decreased by $8.6 million, or 3.8%, compared to the prior year.
Mortgage backed securities. Our mortgage backed securities portfolio consists of pass through and agency-issued collateralized mortgage obligations. As of March 31, 2024, our mortgage backed securities decreased by $2.2 million, or 18.6%, compared to March 31, 2023. As of December 31, 2023, our mortgage backed securities decreased by $2.0 million, or 17.0%, compared to December 31, 2022. During both periods, mortgage backed securities represented less than 4.0% of our securities portfolio.
Corporate bonds. Corporate bonds are debt obligations issued by companies to raise capital and refinance obligations of the issuer. As of March 31, 2024, our corporate bonds decreased by $9.6 million, or 7.8%, compared to March 31, 2023. As of December 31, 2023, our corporate bonds decrease by $10.0 million, or 8.0%, compared to December 31, 2022.
State and municipal securities. State and municipal securities are debt obligations issued by state and local governments. As of March 31, 2024, our state and municipal securities decreased by $8.9 million, or 3.8%, compared to March 31, 2023. As of December 31, 2023, our state and municipal securities decreased by $5.1 million, or 2.2%, compared to December 31, 2022.
81
Table of Contents
Allowance for Credit Losses Securities
Management measures expected credit losses on HTM debt securities on a collective basis by major security type (U.S. government and federal agencies, agency mortgage backed securities, corporate bonds and state and municipal securities). We estimate expected credit losses based on our historical credit loss information as adjusted for current conditions and reasonable and supportable forecasts. Securities issued by the U.S. Treasury or government agencies are not considered to be credit sensitive as they are explicitly or implicitly guaranteed by the U.S. government, and result in expectations of zero credit loss. Accordingly, managements analysis of credit loss considers only the corporate and municipal segments. Accrued interest receivable on HTM debt securities totaled $1.8 million as of March 31, 2024 and $1.6 million as of December 31, 2023 and is excluded from the estimate of credit losses.
For AFS debt securities in an unrealized loss position, management first assesses whether it intends to sell, or it is more likely than not that it will be required to sell, the security before recovery of its amortized cost basis. If either of the criteria regarding intent or requirement to sell is met, the securitys amortized cost basis is written down to fair value through income. For AFS debt securities that do not meet the aforementioned criteria, management evaluates whether the decline in fair value has resulted from credit losses or other factors. In making this assessment, management considers the extent to which fair value is less than amortized cost, any changes to the rating of the security by a rating agency, and adverse conditions specifically related to the security, among other factors. If this assessment indicates that a credit loss exists, the present value of cash flows expected to be collected from the security are compared to the amortized cost basis of the security. If the present value of cash flows expected to be collected is less than the amortized cost basis, a credit loss exists, and an allowance for credit loss is recorded for the credit loss, limited by the amount that the fair value is less than the amortized cost basis. Any impairment that has not been recorded through an allowance for credit loss is recognized in other comprehensive income (loss).
The following table presents an analysis of the allowance for credit losses on securities:
| Held to Maturity: | Three months ended March 31, |
Twelve months ended December 31, |
||||||||||||||
| (dollars in thousands) | 2024 | 2023 | 2023 | 2022 | ||||||||||||
| Average HTM debt securities outstanding |
$ | 302,801 | $ | 311,346 | $ | 308,500 | $ | 245,739 | ||||||||
| Total outstanding HTM debt securities at end of each period |
308,312 | 311,457 | 308,406 | 312,567 | ||||||||||||
| Allowance for credit losses at the beginning of period |
348 | | | | ||||||||||||
| Impact of adopting ASC 326 |
| 329 | 329 | | ||||||||||||
| Provision for credit losses |
11 | 13 | 19 | | ||||||||||||
|
|
|
|
|
|
|
|
|
|||||||||
| Total charge-offs |
| | | | ||||||||||||
|
|
|
|
|
|
|
|
|
|||||||||
| Total recoveries |
| | | | ||||||||||||
|
|
|
|
|
|
|
|
|
|||||||||
| Net (charge-offs) recoveries |
| | | | ||||||||||||
|
|
|
|
|
|
|
|
|
|||||||||
| Allowance for credit losses at end of period |
359 | 342 | 348 | | ||||||||||||
| Ratio of allowance to total HTM debt securities outstanding at period end |
0.12 | % | 0.11 | % | 0.11 | % | 0.00 | % | ||||||||
| Ratio of nonaccrual HTM securities to total HTM securities outstanding at period end |
| | | | ||||||||||||
| Ratio of allowance to nonaccrual debt securities at period end |
| | | | ||||||||||||
82
Table of Contents
| Available-for-Sale: | Three months ended March 31, |
Twelve months ended December 31, |
||||||||||||||
| (dollars in thousands) | 2024 | 2023 | 2023 | 2022 | ||||||||||||
| Average AFS debt securities outstanding |
$ | 272,532 | $ | 296,080 | $ | 284,543 | $ | 336,026 | ||||||||
| Total outstanding AFS debt securities at end of each period |
254,880 | 279,236 | 258,114 | 279,596 | ||||||||||||
| Allowance for credit losses at the beginning of period |
| | | | ||||||||||||
| Provision for credit losses |
(210 | ) | 785 | 785 | | |||||||||||
| Charge-offs: |
||||||||||||||||
| Corporate |
| (785 | ) | (785 | ) | | ||||||||||
|
|
|
|
|
|
|
|
|
|||||||||
| Total charge-offs |
| (785 | ) | (785 | ) | | ||||||||||
|
|
|
|
|
|
|
|
|
|||||||||
| Recoveries: |
||||||||||||||||
| Corporate |
210 | | | | ||||||||||||
|
|
|
|
|
|
|
|
|
|||||||||
| Total recoveries |
210 | | | | ||||||||||||
|
|
|
|
|
|
|
|
|
|||||||||
| Net (charge-offs) recoveries |
210 | (785 | ) | (785 | ) | | ||||||||||
|
|
|
|
|
|
|
|
|
|||||||||
| Allowance for credit losses at end of period |
| | | | ||||||||||||
| Ratio of allowance to total AFS debt securities outstanding at period end |
| % | | % | | % | | % | ||||||||
| Ratio of nonaccrual AFS securities to total AFS securities outstanding at period end |
| | | | ||||||||||||
| Ratio of allowance to nonaccrual debt securities at period end |
| | | | ||||||||||||
During the first quarter of 2022, the Bank transferred AFS securities with an amortized cost of $288.2 million to the HTM classification at the fair value of $281.5 million. The timing of this transaction caused the average balance of AFS securities during the twelve months ended December 31, 2022 to be higher than comparable periods presented. It also caused the average balance of HTM securities during the twelve months ended December 31, 2022 to be lower than comparable periods presented.
The charge-off recorded for the AFS portfolio during 2023 pertained to a holding from a single corporate issuer whose business was ultimately closed by a regulatory authority. The bond, initially classified as HTM, was transferred to the AFS portfolio based on the unlikely collectability of the unsecured bond and significant documented credit deterioration. A portion of the bond was subsequently sold at a loss, and the remaining unsold portion was written off entirely. During the three months ended March 31, 2024, we received proceeds totaling $210 thousand for the bond that was charged off during 2023 and recorded a recovery of credit loss.
The following table presents the allocation of the allowance for credit losses on our HTM securities portfolios by segment. There was no ACL established for the AFS portfolio as of the indicated period ends.
| As of March 31, | As of December 31, | |||||||||||||||||||||||||||||||
| 2024 | 2023 | 2023 | 2022 | |||||||||||||||||||||||||||||
| Balance at the end of each period (dollars in thousands) |
Amount | % to total HTM bonds |
Amount | % to total HTM bonds |
Amount | % to total HTM bonds |
Amount | % to total HTM bonds |
||||||||||||||||||||||||
| U.S. government and federal agencies |
$ | | | % | $ | | | % | $ | | | % | $ | | | % | ||||||||||||||||
| Mortgage backed securities |
| | % | | | % | | | % | | | % | ||||||||||||||||||||
| Corporate |
326 | 0.55 | % | 338 | 0.55 | % | 322 | 0.54 | % | | | % | ||||||||||||||||||||
| State and municipal |
33 | 0.03 | % | 4 | | % | 26 | 0.02 | % | | | % | ||||||||||||||||||||
|
|
|
|
|
|
|
|
|
|
|
|
|
|
|
|
|
|||||||||||||||||
| Total |
$ | 359 | 0.12 | % | $ | 342 | 0.11 | % | $ | 348 | 0.11 | % | $ | | | % | ||||||||||||||||
|
|
|
|
|
|
|
|
|
|
|
|
|
|
|
|
|
|||||||||||||||||
83
Table of Contents
The following tables present the allocation of the net charge offs within the AFS securities portfolio by segment. There were no charge offs or recoveries of HTM bonds during the indicated periods.
| Three months ended of March 31, | ||||||||||||||||||||||||
| 2024 | 2023 | |||||||||||||||||||||||
| Available-for-Sale: (dollars in thousands) |
Net charge- offs |
Average AFS securities outstanding |
Ratio of net charge-offs to average loans outstanding |
Net charge- offs |
Average AFS securities outstanding |
Ratio of net charge-offs to average loans outstanding |
||||||||||||||||||
| U.S. government and federal agencies |
$ | | $ | 99,833 | | % | $ | | $ | 102,909 | | % | ||||||||||||
| Mortgage backed securities |
| 10,340 | | % | | 12,558 | | % | ||||||||||||||||
| Corporate |
210 | 56,934 | 0.37 | % | (785 | ) | 65,712 | (1.19 | %) | |||||||||||||||
| State and municipal |
| 105,425 | | % | | 114,901 | | % | ||||||||||||||||
| Twelve months ended December 31, | ||||||||||||||||||||||||
| 2023 | 2022 | |||||||||||||||||||||||
| (dollars in thousands) | Net charge- offs |
Average AFS securities outstanding |
Ratio of net charge-offs to average loans outstanding |
Net charge- offs |
Average AFS securities outstanding |
Ratio of net charge-offs to average loans outstanding |
||||||||||||||||||
| U.S. government and federal agencies |
$ | | $ | 100,869 | | % | $ | | $ | 119,338 | | % | ||||||||||||
| Mortgage backed securities |
| 10,432 | | % | | 10,994 | | % | ||||||||||||||||
| Corporate |
(785 | ) | 62,447 | (1.26 | %) | | 71,237 | | % | |||||||||||||||
| State and municipal |
| 110,795 | | % | | 134,457 | | % | ||||||||||||||||
Loan Portfolio
Our loan portfolio consists of mortgage, commercial, and consumer loans to clients. A substantial portion of our loan portfolio is primarily represented by residential real estate and commercial real estate loans throughout the Washington, D.C. metropolitan area. The ability of our debtors to honor their contracts is dependent upon a number of factors, including the real estate and general economic conditions in this area.
The following table summarizes our loan portfolio by the type of loans as of the dates indicated:
| As of March 31, | ||||||||||||||||||||||||
| 2024 | 2023 | Change | ||||||||||||||||||||||
| (dollars in thousands) | Amount | % of total loans |
Amount | % of total loans |
$ | % | ||||||||||||||||||
| Commercial real estate |
$ | 59,527 | 19.50 | % | $ | 62,448 | 19.60 | % | $ | (2,921 | ) | (4.7 | %) | |||||||||||
| Commercial |
11,795 | 3.86 | % | 19,216 | 6.03 | % | (7,421 | ) | (38.6 | %) | ||||||||||||||
| Residential real estate, close-ended |
213,015 | 69.78 | % | 215,941 | 67.79 | % | (2,926 | ) | (1.4 | %) | ||||||||||||||
| Other consumer loans |
20,930 | 6.86 | % | 20,943 | 6.57 | % | (13 | ) | (0.1 | %) | ||||||||||||||
|
|
|
|
|
|
|
|
|
|
|
|
|
|||||||||||||
| Total |
$ | 305,267 | 100.0 | % | $ | 318,548 | 100.0 | % | $ | (13,281 | ) | (4.2 | %) | |||||||||||
|
|
|
|
|
|
|
|
|
|
|
|
|
|||||||||||||
| As of December 31, | ||||||||||||||||||||||||
| 2023 | 2022 | Change | ||||||||||||||||||||||
| (dollars in thousands) | Amount | % of total loans |
Amount | % of total loans |
$ | % | ||||||||||||||||||
| Commercial real estate |
$ | 60,138 | 19.77 | % | $ | 62,258 | 19.44 | % | $ | (2,120 | ) | (3.4 | %) | |||||||||||
| Commercial |
12,438 | 4.09 | % | 31,814 | 9.94 | % | (19,376 | ) | (60.9 | %) | ||||||||||||||
| Residential real estate, close-ended |
210,358 | 69.16 | % | 202,972 | 63.39 | % | 7,386 | 3.6 | % | |||||||||||||||
| Other consumer loans |
21,210 | 6.97 | % | 23,149 | 7.23 | % | (1,939 | ) | (8.4 | %) | ||||||||||||||
|
|
|
|
|
|
|
|
|
|
|
|
|
|||||||||||||
| Total |
$ | 304,144 | 100.0 | % | $ | 320,193 | 100.0 | % | $ | (16,049 | ) | (5.0 | %) | |||||||||||
|
|
|
|
|
|
|
|
|
|
|
|
|
|||||||||||||
84
Table of Contents
As of March 31, 2024, our total loans decreased by $13.3 million, or 4.2%, compared to March 31, 2023 due to higher loan balances during the first quarter of 2023. Historically, during the first quarter following a general election, such as the first quarter of 2023, we often experience high outstanding loan balances because political organizations typically draw upon their lines of credit in connection with the general election and repay the lines over the following six to twelve month period. In addition, we experienced reduced consumer demand for residential real estate loans during the second half of 2023 due to the continued higher interest rate environment. Commensurate with our strategy to reduce exposure to commercial real estate, we have reduced lending in the segment leading to a decline in the commercial real estate portfolio.
As of December 31, 2023, our total loans decreased by $16.0 million, or 5.0%, compared to December 31, 2022. In 2023, we reduced lending in the commercial real estate segment, which was partially offset by steady consumer demand for residential mortgages through March 31, 2023, although the demand somewhat tapered off in subsequent quarters in 2023. In 2022, the commercial loan portfolio benefited from higher outstanding loan balances consistent with the cadence of borrowing and repayment of loans by political organizations surrounding a general election as well as steady consumer demand for residential mortgages during 2022.
Residential real estate loans, closed-end. Single family (1-4 units) residential mortgage loans are primarily secured by owner-occupied primary and secondary residences. As of March 31, 2024, our residential real estate loans decreased by $2.9 million, or 1.4%, compared to March 31, 2023. As of December 31, 2023, our residential real estate loans increased by $7.4 million, or 3.6%, compared to December 31, 2022.
Commercial real estate loans. Commercial real estate loans are generally long-term loans secured by a commercial property that is either owner-occupied or investor owned. This category also includes commercial construction loans and multifamily residential property loans. Management has strategically allowed a decline in the commercial real estate portfolio. Rising interest rates have increased the cost of borrowing and remote work trends continue to be a concern. These factors negatively impact the value of commercial properties, making commercial real estate loans less attractive. As of March 31, 2024, our commercial real estate loans decreased by $2.9 million, or 4.7%, compared to March 31, 2023. As of December 31, 2023, our commercial real estate loans decreased by $2.1 million, or 3.4%, compared to December 31, 2022.
Commercial. Commercial loans are commercial and industrial (C&I) term loans or lines of credit and, due to the participation of political organizations in this segment, exhibit cyclicality when measured as a percentage of our loan portfolio. C&I loans include unsecured or UCC secured lending, accounts receivable, inventory or equipment financing loans or working capital loans. As of March 31, 2024, our commercial loans decreased by $7.4 million, or 38.6%, compared to March 31, 2023. As of December 31, 2023, our commercial loans were $12.4 million, representing a decrease of $19.4 million, or 60.9%, compared to $31.8 million as of December 31, 2022.
Other consumer loans. Other consumer loans include residential construction loans, revolving loans secured by residential properties and loans made directly to individuals for non-business purposes which may be secured or unsecured. As of March 31, 2024, our other consumer loans were virtually unchanged from March 31, 2023. As of December 31, 2023, our other consumer loans decreased by $1.9 million, or 8.4%, compared to December 31, 2022.
Loan Maturity and Sensitivity to Interest Rates
The information in the following table is based on the contractual maturities of individual loans, including loans that may be subject to renewal at their contractual maturity. Renewal of these loans is subject to review and credit approval, as well as modification of terms upon maturity. Actual repayments of the loans may differ from the maturities reflected below because consumer borrowers and some commercial borrowers have the right to prepay obligations with or without prepayment penalties. As of March 31, 2024, variable rate loans, which include floating and adjustable rate structures, comprised 66.0% of our loan portfolio. Our variable rate loans primarily consist of residential real estate loans that adjust every five, seven or ten years. Variable rate loans provide a better match against our deposit liabilities and reduce our interest rate risk.
85
Table of Contents
The following table details maturities and sensitivity to interest rate changes for our loan portfolio as of March 31, 2024, and the contractual maturity and interest-rate profile of our loan portfolio:
| At March 31, 2024 | Remaining contractual maturity held for investment | |||||||||||||||||||
| (dollars in thousands) | One year or less |
After one year through five years |
After five years and through fifteen years |
After fifteen years |
Total | |||||||||||||||
| Fixed rate loans: |
||||||||||||||||||||
| Commercial real estate |
$ | 6,803 | $ | 16,280 | $ | 27,437 | $ | | $ | 50,520 | ||||||||||
| Commercial |
137 | 352 | 1,302 | | 1,791 | |||||||||||||||
| Residential real estate, closed end |
| 1,380 | 39,276 | 8,280 | 48,936 | |||||||||||||||
| Other consumer loans |
466 | 2,036 | | | 2,502 | |||||||||||||||
|
|
|
|
|
|
|
|
|
|
|
|||||||||||
| Total fixed rate loans |
7,406 | 20,048 | 68,015 | 8,280 | 103,749 | |||||||||||||||
| Variable rate loans: |
||||||||||||||||||||
| Commercial real estate |
| 233 | 8,175 | 599 | 9,007 | |||||||||||||||
| Commercial |
2,524 | 7,480 | | | 10,004 | |||||||||||||||
| Residential real estate, closed end |
| 2,147 | 2,632 | 159,300 | 164,079 | |||||||||||||||
| Other consumer loans |
845 | 6,901 | 6,847 | 3,835 | 18,428 | |||||||||||||||
|
|
|
|
|
|
|
|
|
|
|
|||||||||||
| Total variable rate loans |
3,369 | 16,761 | 17,654 | 163,734 | 201,518 | |||||||||||||||
|
|
|
|
|
|
|
|
|
|
|
|||||||||||
| Total loans |
$ | 10,775 | $ | 36,809 | $ | 85,669 | $ | 172,014 | $ | 305,267 | ||||||||||
|
|
|
|
|
|
|
|
|
|
|
|||||||||||
Credit Policies and Procedures
Management employs a multi-pronged approach to address credit risk, guided by a defined risk appetite. The approach includes underwriting policies, loan risk classification grading, and an internal and external loan review process. In addition, it involves strategic portfolio management to address loan concentration and oversight by our Board. These policies and guidelines are designed with the intention of maintaining the quality of our loan portfolio while aiming to generate a return commensurate with the associated risks. However, it is important to recognize that all risk management strategies have inherent limitations.
The commercial underwriting process involves an evaluation of the borrowers ability to repay, the quality of the available collateral (if applicable), the financial character of the borrower and the nature of the credit. It also includes an analysis of the borrowers needs and an industry analysis to understand relevant external factors that might affect the borrowers financial stability and repayment capacity. Commercial borrowers are often asked to maintain their primary banking relationship with the Bank to attract both loans and transaction deposits. Residential mortgage loans and consumer loans are underwritten based on an evaluation of the borrowers repayment ability, which typically includes a review of documentation to verify income and assets. Consumers are encouraged to maintain deposit accounts with the Bank, and pricing incentives may be offered.
During the underwriting process, loans are assigned a loan risk classification grade. The risk rating scale is intended to provide a framework for analyzing risk across various credit exposures, regardless of their nature, type or location.
The internal loan review process, performed by our credit administration staff, aims to verify that basic requirements for loan origination have been met. Ongoing internal loan review processes monitor commercial borrower performance using a risk-based approach, which may result in grade confirmations or change recommendations. Certain scenarios such as delinquent payments, overdue taxes, overdrafts, lack of borrower cooperation, delayed financial statements, or significant changes to the borrowers financial position, may be considered potential indicators of problem loans. In such cases, the loan risk classification may be re-evaluated.
An external loan review is conducted annually by a third-party firm. This review examines a sample of the loan portfolio, focusing on areas such as underwriting practices, adherence to loan policies and banking regulations, loan documentation, watch list, and portfolio concentration.
86
Table of Contents
Credit concentration policies are designed to address risk relative to our regulatory capital. Concentration limits are established for various categories including loans to individual borrowers or industries, specific loan types, collateral types, commercial real estate concentrations, and total real estate loans, among others. This factor may have contributed to our efforts to navigate recent challenges in the banking environment.
Asset Quality
We seek to maintain a prudent lending approach, which has historically been associated with our asset quality performance. Our loan underwriters employ underwriting guidelines, and we assign a loan risk classification grade at origination. These practices are designed to help us evaluate potential risks throughout the life of the loan. The Banks risk classification system utilizes a 10-grade risk rating scale. The four lowest grade categories (7-10) correspond to the regulatory categories special mention, substandard, doubtful and loss.
The risk classification grade is a key component of our risk management process. Certain grades may result in a loan being added to the watch list report, which is a tool used in monitoring loans or commitments that may present elevated risks. This report is overseen by our Chief Credit Officer and presented to the Board monthly. Loan officers are responsible for managing credit risk within their loan portfolios and are encouraged to be proactive in considering whether to add a loan to the watch list report.
Management uses internal and external review processes, as described under Credit Policies and Procedures, to monitor adherence to loan and credit policies, evaluate the loan portfolio, and identify areas that may require additional attention.
Non-performing Assets
Loans are generally considered delinquent when the required principal and interest payments have not been received by the assigned due date. Loans are typically placed on nonaccrual status when a loan becomes 90 days delinquent, unless the credit is well-secured and in the process of collection. Management may, at its discretion, place loans on nonaccrual status prior to 90 days delinquency if it determines that interest may be uncollectible. Loans determined to be non-performing or potentially uncollectible may be placed in nonaccrual status pending further collection efforts or charged off if collection of principal or interest is deemed doubtful.
For loans placed in nonaccrual status, all interest previously accrued but not collected is generally reversed against interest income. The interest on loans in nonaccrual status is typically accounted for on the cash basis or cost recovery method until qualifying for return to accrual. Loans may be returned to accrual status when all the principal and interest amounts contractually due are brought current and future payments are reasonably assured.
As of March 31, 2024 and 2023, and December 31, 2023 and 2022, based on our internal classifications, we did not identify any assets that met our criteria for classification as non-performing assets or OREO.
Allowance for Credit Losses Loans
The ACL represents an amount that is intended to absorb the lifetime expected credit losses that may be sustained on outstanding loans at the balance sheet date. Additional information regarding the ACL evaluation can be found in Note 1 and Note 3 to our audited consolidated financial statements for the year ended December 31, 2023 and the notes thereto included elsewhere in this prospectus.
The estimate for expected credit losses is based on an evaluation of the various factors, including but not limited to, size and current risk characteristics of the loan portfolio, past events, current conditions, reasonable and supportable forecasts of future economic conditions, and prepayment experience as related to credit contractual term information. The ACL is generally measured on a collective (pool) basis when similar risk characteristics exist and is typically recorded upon the initial recognition of a financial asset.
87
Table of Contents
The ACL may be adjusted by charge-offs, net of recoveries of previous losses, and may be increased or decreased by a provision for or recapture of credit losses, which is recorded in the consolidated statements of income. Management estimates the allowance balance using various information sources, both internal and external, relating to past events, current conditions, and reasonable and supportable forecasts. Historical credit loss experience typically provides a basis for the estimation of expected credit losses. Adjustments to historical loss information may be made for differences in current loan-specific risk characteristics and changes in environmental conditions. Expected credit losses are typically estimated over the contractual term of the loans, adjusted for expected prepayments when appropriate. The contractual term generally excludes expected extensions, renewals, and modifications.
For loans that do not share risk characteristics with a pool of other loans, expected credit losses are measured on an individual loan basis. Management individually evaluates the expected credit loss for certain loans, such as those that are collateral dependent, are graded substandard or doubtful, or are identified as having risk characteristics dissimilar to those of the established loan pools.
For loans considered collateral-dependent, the Company has adopted a practical expedient to the ACL, which allows for recording an ACL based on the fair value of the collateral rather than by estimating expected losses over the life of the loan.
While the ACL on loans follows these guidelines, and management believes the allowance is appropriate based on current information, the judgmental nature of the calculation could lead to fluctuations due to ongoing evaluations of the loan portfolio. These evaluations may be influenced by economic conditions in the Washington, D.C. metropolitan area, changes in asset quality, or loan portfolio growth, among other factors, which could potentially require additional provisions for the allowance for credit losses.
The quality of the loan portfolio and the adequacy of the allowance are subject to review by our internal and external auditors as well as our regulators.
88
Table of Contents
The following table presents an analysis of the allowance for credit losses:
| Three months ended March 31, |
Twelve months ended December 31, |
|||||||||||||||
| (dollars in thousands) | 2024 | 2023 | 2023 | 2022 | ||||||||||||
| Average loans outstanding |
$ | 303,037 | $ | 321,559 | $ | 314,409 | $ | 292,116 | ||||||||
| Total loans outstanding at end of each period |
305,267 | 318,548 | 304,144 | 320,193 | ||||||||||||
| Allowance for credit losses at the beginning of period |
4,319 | 4,482 | 4,482 | 3,660 | ||||||||||||
| Provision for (recapture of) credit losses |
5 | (23 | ) | (163 | ) | 822 | ||||||||||
|
|
|
|
|
|
|
|
|
|||||||||
| Charge-offs |
||||||||||||||||
| Commercial real estate |
| | | | ||||||||||||
| Commercial non-real estate |
| | | | ||||||||||||
| Residential real estate |
| | | | ||||||||||||
| Other consumer loans |
| | | | ||||||||||||
| Total charge-offs |
| | | | ||||||||||||
| Recoveries |
||||||||||||||||
| Commercial real estate |
| | | | ||||||||||||
| Commercial non-real estate |
| | | | ||||||||||||
| Residential real estate |
| | | | ||||||||||||
| Other consumer loans |
| | | | ||||||||||||
| Total recoveries |
| | | | ||||||||||||
|
|
|
|
|
|
|
|
|
|||||||||
| Net (charge-offs) recoveries |
| | | | ||||||||||||
|
|
|
|
|
|
|
|
|
|||||||||
| Allowance for credit losses at end of period |
4,324 | 4,459 | 4,319 | 4,482 | ||||||||||||
| Ratio of allowance to total loans outstanding at period end |
1.42 | % | 1.40 | % | 1.42 | % | 1.40 | % | ||||||||
| Ratio of nonaccrual loans to total loans outstanding at period end |
| | | | ||||||||||||
| Ratio of allowance to nonaccrual loans at period end |
| | | | ||||||||||||
The following tables present the allocation of the allowance for credit losses:
| As of March 31, | As of December 31, | |||||||||||||||||||||||||||||||
| 2024 | 2023 | 2023 | 2022 | |||||||||||||||||||||||||||||
| Balance at the end of each period (dollars in thousands) |
Amount | % of total loans |
Amount | % of total loans |
Amount | % of total loans |
Amount | % of total loans |
||||||||||||||||||||||||
| Commercial real estate |
$ | 1,217 | 0.40 | % | $ | 1,139 | 0.36 | % | $ | 1,233 | 0.41 | % | $ | 905 | 0.28 | % | ||||||||||||||||
| Commercial non-real estate |
177 | 0.06 | % | 287 | 0.09 | % | 189 | 0.06 | % | 573 | 0.18 | % | ||||||||||||||||||||
| Residential real estate |
2,681 | 0.88 | % | 2,836 | 0.89 | % | 2,668 | 0.88 | % | 2,650 | 0.83 | % | ||||||||||||||||||||
| Other consumer loans |
249 | 0.08 | % | 197 | 0.06 | % | 229 | 0.08 | % | 354 | 0.11 | % | ||||||||||||||||||||
|
|
|
|
|
|
|
|
|
|
|
|
|
|
|
|
|
|||||||||||||||||
| Total |
$ | 4,324 | 1.42 | % | $ | 4,459 | 1.40 | % | $ | 4,319 | 1.42 | % | $ | 4,482 | 1.40 | % | ||||||||||||||||
|
|
|
|
|
|
|
|
|
|
|
|
|
|
|
|
|
|||||||||||||||||
The allocations of the allowance between loan segments did not vary significantly during the periods presented. However, we note a modest migration of applied allowances from the commercial segment as of December 31, 2022 to the commercial real estate segment as of December 31, 2023. The change is driven by the qualitative components of our calculation which portrayed increasingly unstable economic conditions in the commercial real estate market and an increase of delinquency rates among our peers. The impact of the increasing loss rate applied to the commercial real estate segment was partially offset by the reduction in the overall loan portfolio.
There were no charge-offs for the interim periods ended March 31, 2024 and 2023, or the years ended December 31, 2024 and 2023. As a result, the ratio of charge-offs to average loans outstanding is 0.00% for all reported periods.
89
Table of Contents
Deposits
We provide a wide range of commercial and personal deposit services. The core deposit products we offer include non-interest-bearing and interest-bearing checking accounts, and savings and money market accounts. We aim to attract transaction account deposits, particularly from commercial clients. Our deposit base is largely comprised of funds from commercial entities, specifically federal political organizations, trade associations, non-profit organizations and business enterprises. As of March 31, 2024, we estimate that a majority of our demand deposits were represented by political organizations. Deposits received from federal political organizations exhibit seasonality, aligning with the cycle of federal election campaigns.
We are a member of the IntraFi® network of institutions, which allows our deposit clients to enroll in the ICS® program. This program is designed to provide our clients access to FDIC insurance beyond the standard maximum deposit insurance amount at a single insured depository institution. For accounts enrolled in this service, we select whether each account should be in a reciprocal position or a one-way sell position. A reciprocal position means that we receive an equal amount of network deposits for our enrolled accounts, and those deposits are reflected on our balance sheet. Conversely, we do not receive reciprocal network funding when accounts are positioned as one-way sell, and therefore the deposits are not reported on the balance sheet. During periods of increased political organization deposits, which typically occur in connection with election cycles, we may adjust the positioning of certain accounts enrolled in the ICS® program. These adjustments can include changing some accounts from a reciprocal position to a one-way sell position, which affects whether and how these deposits are reflected on our balance sheet. These adjustments are part of our overall asset and liability management strategy, which aims to maintain appropriate balance sheet metrics in accordance with regulatory guidelines and our risk management policies.
As of March 31, 2024, our total deposits were $1.1 billion, representing an increase of $167.8 million, or 17.3%, compared to $968.0 million as of March 31, 2023, primarily driven by an increase in political organization deposits. As of December 31, 2023, our total deposits were $1.1 billion, representing an increase of $159.1 million, or 16.7%, compared to $953.0 million as of December 31, 2022, primarily driven by an increase in political organization deposits. However, the growth in political organization and core accounts during both comparative periods was muted by the volume of deposits sold one-way through ICS® as of March 31, 2024 and December 31, 2023.
The following table presents the types of deposits compared to total deposits for the periods indicated:
| As of March 31, | ||||||||||||||||||||||||
| 2024 | 2023 | Change | ||||||||||||||||||||||
| (dollars in thousands) | Amount* | % of total deposits |
Amount | % of total deposits |
$ | % | ||||||||||||||||||
| Non-interest-bearing |
$ | 833,359 | 73.4 | % | $ | 618,831 | 63.9 | % | $ | 214,528 | 34.7 | % | ||||||||||||
| Savings, interest-bearing and money market accounts |
286,803 | 25.3 | % | 309,278 | 32.0 | % | (22,475 | ) | (7.3 | %) | ||||||||||||||
| Time, $250 and over |
9,140 | 0.8 | % | 6,979 | 0.7 | % | 2,161 | 31.0 | % | |||||||||||||||
| Other time |
6,453 | 0.6 | % | 32,865 | 3.4 | % | (26,412 | ) | (80.4 | %) | ||||||||||||||
|
|
|
|
|
|
|
|
|
|
|
|
|
|||||||||||||
| Total |
$ | 1,135,755 | 100.0 | % | $ | 967,953 | 100.0 | % | $ | 167,802 | 17.3 | % | ||||||||||||
|
|
|
|
|
|
|
|
|
|
|
|
|
|||||||||||||
| As of December 31, | ||||||||||||||||||||||||
| 2023 | 2022 | Change | ||||||||||||||||||||||
| (dollars in thousands) | Amount | % of total loans |
Amount | % of total loans |
$ | % | ||||||||||||||||||
| Non-interest-bearing |
$ | 766,933 | 69.0 | % | $ | 666,493 | 69.9 | % | $ | 100,440 | 15.1 | % | ||||||||||||
| Savings, interest-bearing and money market accounts |
328,350 | 29.5 | % | 273,888 | 28.7 | % | 54,462 | 19.9 | % | |||||||||||||||
| Time, $250 and over |
9,385 | 0.8 | % | 5,374 | 0.6 | % | 4,011 | 74.6 | % | |||||||||||||||
| Other time |
7,357 | 0.7 | % | 7,199 | 0.8 | % | 158 | 2.2 | % | |||||||||||||||
|
|
|
|
|
|
|
|
|
|
|
|
|
|||||||||||||
| Total |
$ | 1,112,025 | 100.0 | % | 952,954 | 100.0 | % | $ | 159,071 | 16.7 | % | |||||||||||||
|
|
|
|
|
|
|
|
|
|
|
|
|
|||||||||||||
90
Table of Contents
The following table presents the average balances and average rates paid for the periods indicated:
| Three months ended March 31, | Twelve months ended December 31, | |||||||||||||||||||||||||||||||
| 2024 | 2023 | 2023 | 2022 | |||||||||||||||||||||||||||||
| (dollars in thousands) | Average Balance |
Average Rate |
Average Balance |
Average Rate |
Average Balance |
Average Rate |
Average Balance |
Average Rate |
||||||||||||||||||||||||
| Non-interest-bearing |
$ | 771,149 | 0.00 | % | $ | 634,431 | 0.00 | % | $ | 645,418 | 0.00 | % | $ | 986,118 | 0.00 | % | ||||||||||||||||
| Savings, interest-bearing checking and money market accounts |
247,771 | 1.13 | % | 280,733 | 1.05 | % | 284,705 | 1.11 | % | 211,451 | 0.48 | % | ||||||||||||||||||||
| Time, $250 and over |
9,287 | 2.99 | % | 6,070 | 1.74 | % | 8,263 | 2.74 | % | 4,830 | 0.48 | % | ||||||||||||||||||||
| Other time |
6,552 | 2.82 | % | 8,191 | 1.88 | % | 9,775 | 2.98 | % | 6,885 | 0.65 | % | ||||||||||||||||||||
|
|
|
|
|
|
|
|
|
|
|
|
|
|
|
|
|
|||||||||||||||||
| Total average deposits |
$ | 1,034,759 | 0.31 | % | $ | 929,425 | 0.34 | % | $ | 948,161 | 1.45 | % | $ | 1,209,284 | 0.36 | % | ||||||||||||||||
|
|
|
|
|
|
|
|
|
|
|
|
|
|
|
|
|
|||||||||||||||||
FDIC deposit insurance covers $250 thousand per depositor, per FDIC-insured bank, for each account ownership category. We estimate total uninsured deposits were $744.6 million and $558.0 million as of March 31, 2024 and 2023, respectively, and $648.0 million and $612.2 million as of December 31, 2023 and 2022, respectively, representing approximately 65.5% and 57.6% of our deposit portfolio as of March 31, 2024 and March 31, 2023, respectively, and approximately 58.3% and 64.2% of our deposit portfolio as of December 31, 2023 and 2022, respectively.
The maturity profile of our uninsured time deposits, those amounts that exceed the FDIC insurance limit, as of March 31, 2024 are as follows:
| (dollars in thousands) | Three months or less |
More than three months to twelve months |
More than twelve months to three years |
More than three years |
Total | |||||||||||||||
| Time deposits, uninsured |
$ | 3,549 | $ | 5,281 | $ | 310 | $ | 0 | $ | 9,140 | ||||||||||
Borrowings
The Bank has the several supplementary funding sources, including a secured line of credit with the FHLB and various available secured and unsecured lines of credit with correspondent banks.
Federal Home Loan Bank Advance. The Bank has a secured line of credit with the FHLB, which is renewed annually in December. The Bank typically pledges single-family residential real estate loans within the Banks loan portfolio to establish credit availability. As of March 31, 2024 and December 31, 2023, the secured line of credit had no collateral pledged and therefore no available or outstanding balance. As of December 31, 2022, for the same secured line, the Bank had pledged collateral to provide credit availability of $1.5 million with no outstanding balance.
Short Term Borrowings. As of March 31, 2024, December 31, 2023 and December 31, 2022, the Company had an unsecured line of credit from a correspondent bank totaling $10.0 million with an outstanding balance of $5.0 million. The line matures December 5, 2024 and contains certain covenants regarding our return on average assets, risk-based capital, and level of non-performing assets. We were in compliance with all financial covenants as of March 31 2024. We also maintain federal funds lines of credit agreements with three correspondent banks that provide combined availability of $68.0 million. There were no outstanding federal funds purchased balances as of March 31, 2024, December 31, 2023 or December 31, 2022.
91
Table of Contents
Off-Balance Sheet Arrangements
We are party to credit related financial instruments with off-balance sheet risk in the normal course of business to meet the financing needs of our clients. These financial instruments include commitments to extend credit and standby letters of credit. Such commitments involve, in varying degrees, elements of credit and interest rate risk in excess of the amount recognized in the consolidated balance sheets.
Our exposure to credit loss is represented by the contractual amount of these commitments. We follow the same credit policies in making commitments as we do for on-balance sheet instruments.
The contractual amounts of financial instruments with off-balance sheet commitments are as follows:
| As of March 31, | As of December 31, | |||||||||||||||
| (dollars in thousands) | 2024 | 2023 | 2023 | 2022 | ||||||||||||
| Commitments to grant loans |
$ | 1,100 | $ | 1,269 | $ | 0 | $ | 7,738 | ||||||||
| Unfunded commitments under lines of credit |
22,922 | 31,046 | 22,947 | 29,159 | ||||||||||||
| Standby letters of credit |
4,108 | 3,394 | 3,598 | 3,274 | ||||||||||||
For information regarding the arrangement related to the ICS® network and related one-way sell ICS® deposits, see Deposits above.
Liquidity and Capital Management
Liquidity Management
Liquidity refers to our capacity to meet cash and collateral obligations in a timely manner. Maintaining appropriate levels of liquidity depends on our ability to address both expected and unexpected cash flows and collateral needs while aiming to avoid adverse effects on our daily operations or the financial condition of the Bank. Effective liquidity management is considered essential to our business model, as deposits, which can generally be withdrawn on demand, form a primary source of our funding. We employ various strategies intended to manage liquidity. Our account at the Federal Reserve, which held approximately $338.0 million as of March 31, 2024, serves as a primary source of liquidity for daily and ongoing activities. We also maintain additional supplemental sources of liquidity, as discussed below. For regulatory reporting purposes, the liquidity ratio is typically calculated as the sum of its cash and cash equivalents plus unpledged securities classified as investment grade divided by total liabilities. Based on this calculation method, as of March 31, 2024, and December 31, 2023, our reported liquidity ratios were 79.36% and 78.75%, respectively. It is important to note that these ratios are point-in-time measurements and may not be indicative of future liquidity positions.
Deposit account balances received from federal political organizations fluctuate due to the seasonality of fundraising and spending around federal elections. Management seeks to address liquidity needs by tagging such accounts, tracking activity, communicating with clients and retaining high cash balances at the Federal Reserve to fund sudden deposit outflows.
Management estimates that up to 65.5% of deposits were uninsured as of March 31, 2024. To obtain FDIC insurance for deposits exceeding the $250 thousand threshold, some clients enroll in the ICS®, which is described in greater detail under Deposits above. As of March 31, 2024, deposit balances totaling $388.5 million were enrolled in the ICS® program. Of the total, $289.2 million were one-way sells and therefore not reflected on the balance sheet. In one days time, management can convert these accounts to a reciprocal position, thereby providing additional liquidity if needed. To fund the outflow of deposits during phases of the federal election cycle when campaigns and committees are actively spending, management will rely on the Banks cash balances at the Federal Reserve and conversion of one-way sell ICS® accounts to reciprocal as its primary sources of liquidity. Additional supplemental funding sources are available if needed.
92
Table of Contents
Supplemental Funding Sources. In addition to the primary sources discussed above, we maintain secured lines of credit with the FHLB and Federal Reserve Discount Window, for which we can borrow up to the allowable amount of pledged collateral. The Bank can advance FHLB funds of up to 25% of assets as reported in the latest call report, using pledged collateral such as qualifying mortgages and investment securities. Based on the March 31, 2024 call report, 25% of total assets equates to credit availability of $308.4 million. As of March 31, 2024, we had no collateral pledged or outstanding balance with the FHLB or Federal Reserve.
The Bank has access to additional unsecured funding through its account with ICS®. The Bank can request funding of up to ten percent (10%) of total assets ($123.4 million as of the March 31, 2024 call report) in a one-way buy of daily maturing or term deposit products. As of March 31, 2024, there was no outstanding balance.
The Bank maintains unsecured lines of credit with three correspondent banks that provide combined availability of $68.0 million. There were no outstanding balances as of March 31, 2024.
As an intermediate source of liquidity, we may sell AFS securities. Our bond portfolio is structured to provide liquidity when management anticipates it will be needed, and a portion of our AFS bonds are invested in liquid investments like U.S. Treasury securities. In the event liquidity is needed from the bond portfolio, management will take into consideration a number of factors when determining which investments to sell. Variables include the marketability of the bonds, current prices and estimated losses, and other factors.
Liquidity Risk Management
Liquidity risk refers to the potential that the Banks financial condition or overall safety and soundness could be adversely affected by a real or perceived inability to meet contractual obligations. This risk category includes potential challenges in managing unplanned decreases or changes in funding sources. Liquidity risk management involves efforts to identify, measure, monitor and control liquidity events.
The Banks Asset/Liability Committee (ALCO) of the Board typically reviews current and projected liquidity scenarios, including stressed scenarios, at its quarterly meetings. The ALCO seeks to ensure that measurement systems are designed to identify and quantify the Banks liquidity exposure, and that reporting systems and practices are intended to communicate relevant information about the level and sources of that exposure. Management is responsible for implementing board-approved policies, strategies, and procedures, and for monitoring liquidity on both a daily and long-term basis.
Capital Resources
Capital adequacy is generally considered an important indicator of financial stability and performance. Our objectives include maintaining capitalization at levels that we believe are sufficient to support asset growth and to promote confidence among our depositors, investors, and regulators. We recognize that robust capital management practices are integral to addressing various financial and operational challenges, which may include managing credit risk, liquidity risk, balance sheet growth, new products, regulatory changes and competitive pressures.
Stockholders equity as of March 31, 2024 was $87.6 million, an increase of $4.2 million compared to $83.4 million as of December 31, 2023. Net income for the quarter ended March 31, 2024 contributed $3.9 million to the increase in stockholders equity. Forming the remaining balance of the change, accumulated other comprehensive loss decreased $235 thousand during the three months ended March 31, 2024, which is primarily related to the improvement in the market value of the AFS securities portfolio.
Stockholders equity as of December 31, 2023 was $83.4 million, an increase of $14.7 million, compared to $68.8 million as of December 31, 2023. Net income for the year ended December 31, 2023 contributed $8.8 million to the increase in stockholders equity. Accumulated other comprehensive loss, another driver of the change, decreased $6.1 million during the same period as a result of an improvement in the market value of the AFS securities portfolio.
93
Table of Contents
The Company has a $10.0 million line of credit from a correspondent bank that it uses to provide capital to the Bank. As of March 31, 2024, $5.0 million was outstanding on this line of credit.
Book value per share as of March 31, 2024 and December 31, 2023 was $3,259.44 and $3,104.98, respectively. The increase between periods is primarily the result of earnings, which was $145.74 per share during the three months ended March 31, 2024.
Because total assets on a consolidated basis are less than $3.0 billion, we are not subject to the consolidated capital requirements imposed by federal regulations. However, the Bank is subject to various regulatory capital requirements administered by the federal banking agencies. Certain regulatory measurements of capital adequacy are risk-based, meaning they utilize a formula that considers the individual risk profile of the financial institutions assets. For example, certain assets, such as cash at the Federal Reserve and investments in U.S. Treasury securities, are deemed to carry zero risk by the regulators because of explicit or implied federal government guarantees. As of March 31, 2024 and December 31, 2023, respectively, 33.3% and 34.1% of the Banks total assets were invested in such zero-risk assets. The tier 1 leverage ratio, another regulatory capital measurement, does not consider the riskiness of assets. The leverage ratio is computed as tier 1 capital divided by total average assets for the quarter.
The Banks capital level is characterized as well-capitalized under the Basel III Capital Rules. A summary of the Banks regulatory capital ratios, and minimum requirement to be considered well-capitalized are presented below:
| March 31, | December 31, | Well- capitalized requirement |
||||||||||||||||||||||||||||||||||
| 2024 | 2023 | 2023 | 2022 | |||||||||||||||||||||||||||||||||
| ($ in thousands) | Amount | Ratio | Amount | Ratio | Amount | Ratio | Amount | Ratio | Ratio | |||||||||||||||||||||||||||
| Total risk-based capital ratio |
$ | 108,659 | 26.44 | % | $ | 97,054 | 22.18 | % | $ | 104,523 | 25.44 | % | $ | 95,856 | 21.46 | % | 10.00 | % | ||||||||||||||||||
| Tier 1 risk-based capital ratio |
103,976 | 25.30 | % | 92,253 | 21.08 | % | 99,856 | 24.30 | % | 91,374 | 20.46 | % | 8.00 | % | ||||||||||||||||||||||
| Common equity tier one risk-based capital ratio |
103,976 | 25.30 | % | 92,253 | 21.08 | % | 99,856 | 24.30 | % | 91,374 | 20.46 | % | 6.50 | % | ||||||||||||||||||||||
| Tier 1 leverage ratio |
103,976 | 9.10 | % | 92,253 | 8.99 | % | 99,856 | 9.21 | % | 91,374 | 8.08 | % | 5.00 | % | ||||||||||||||||||||||
Interest Rate Sensitivity and Market Risk
Our business activities include attracting deposits and using those deposits to invest in cash, securities, and loans. These activities may involve interest rate risk, which can potentially arise from factors such as timing and volume differences in the repricing of our rate-sensitive assets and liabilities, changes in credit spreads, fluctuations in the general level of market interest rates, and shifts in the shape and level of market yield curves. Changes in interest rates may affect our current and future earnings by impacting our net interest income and the level of other interest-sensitive income and operating expenses. Interest rate fluctuations may also influence the underlying economic value of our assets, liabilities and off-balance sheet items. This is because the present value of future cash flows, and in some cases the cash flows, themselves, may change when interest rates vary.
Interest rate risk is generally considered a significant market risk for financial institutions. We have developed an interest rate risk policy that aims to provide management with guidelines for funds management. We have also established a system for monitoring our net interest rate sensitivity position. However, its important to note that despite these measures, significant changes in interest rates could potentially impact our earnings, liquidity and capital positions.
We had a total one-year cumulative gap in rate sensitive assets and rate sensitive liabilities of $414.2 million, $319.4 million, and $76.5 million as of March 31, 2024, December 31, 2023 and December 31, 2022, respectively, indicating that, overall, our assets will reprice before our liabilities. Generally, when interest-earning assets mature or reprice more quickly than interest-bearing liabilities, decreasing interest rates could reduce net interest income and increasing interest rates could increase net interest income.
94
Table of Contents
Our ALCO is comprised of our CEO and at least two independent directors, and meets at least quarterly to manage interest rate risk in accordance with policies approved by the Banks board of directors. Members of management from various departments also participate in the ALCO meetings. The board of directors receives monthly interest rate risk measurement results. The ALCO monitors the volume, maturities, pricing and mix of assets and funding sources with the objective of managing assets and funding sources to provide results that are consistent with liquidity, growth, risk limits and profitability goals.
We use interest rate risk models and rate shock simulations to assess the interest rate risk (IRR) sensitivity of net interest income and economic value of equity over a variety of parallel and non-parallel rate scenarios. Many assumptions are used to calculate the impact of interest rate fluctuations on our net interest income, such as asset prepayments, non-maturity deposit price sensitivity and decay rates, and rate drivers. Due to the inherent use of estimates and assumptions in the model, our actual results may, and most likely will, differ from our simulated results. Management reviews the assumptions on an as-needed basis and at least annually through a thorough examination. Key changes are presented to the ALCO.
The table below summarizes the results of our IRR analysis in simulating the change in net interest income over a 12-month horizon as of the indicated dates. The ramped scenario below presents the anticipated percentage change in net interest income when rates are increased or decreased in a parallel manner evenly over the 12-month time horizon, and the immediate scenario assumes that the parallel rate shift occurs immediately.
| Change in interest rates (ramped) | -400 bps | -300 bps | -200 bps | -100 bps | +100 bps | +200 bps | +300 bps | +400 bps | ||||||||||||||||||||||||
| March 31, 2024 |
(17.29 | %) | (12.92 | %) | (8.59 | %) | (4.28 | %) | 4.33 | % | 8.62 | % | 12.92 | % | 17.14 | % | ||||||||||||||||
| December 31, 2023 |
(16.22 | %) | (12.11 | %) | (8.06 | %) | (4.04 | %) | 4.00 | % | 8.02 | % | 12.14 | % | 16.11 | % | ||||||||||||||||
| December 31, 2022 |
(6.87 | %) | (5.10 | %) | (3.33 | %) | (1.69 | %) | 1.69 | % | 3.28 | % | 4.96 | % | 6.61 | % | ||||||||||||||||
| Change in interest rates (immediate) | -400 bps | -300 bps | -200 bps | -100 bps | +100 bps | +200 bps | +300 bps | +400 bps | ||||||||||||||||||||||||
| March 31, 2024 |
(37.90 | %) | (28.11 | %) | (18.55 | %) | (9.19 | %) | 9.14 | % | 18.23 | % | 27.34 | % | 36.45 | % | ||||||||||||||||
| December 31, 2023 |
(34.76 | %) | (25.74 | %) | (16.98 | %) | (8.41 | %) | 8.34 | % | 16.54 | % | 24.88 | % | 33.27 | % | ||||||||||||||||
| December 31, 2022 |
(17.59 | %) | (13.42 | %) | (8.52 | %) | (3.92 | %) | 3.76 | % | 7.39 | % | 11.10 | % | 14.94 | % | ||||||||||||||||
The results show that we are asset-sensitive, further indicating that we can expect net interest income to increase as rates rise, and to decrease as rates decline. Interest rates do not normally move all at once or evenly over time, but this analysis assists in our understanding of the potential direction and magnitude of net interest income changes due to changing interest rates.
The following table illustrates the results of our interest rate risk analysis in simulating the change in fair value of equity as of the indicated dates.
| Change in interest rates | -400 bps | -300 bps | -200 bps | -100 bps | +100 bps | +200 bps | +300 bps | +400 bps | ||||||||||||||||||||||||
| March 31, 2024 |
10.22 | % | 9.46 | % | 6.75 | % | 3.75 | % | (3.33 | %) | (5.98 | %) | (8.18 | %) | (10.06 | %) | ||||||||||||||||
| December 31, 2023 |
14.25 | % | 12.33 | % | 8.27 | % | 3.21 | % | (4.81 | %) | (8.85 | %) | (12.35 | %) | (15.45 | %) | ||||||||||||||||
| December 31, 2022 |
39.97 | % | 34.32 | % | 23.99 | % | 12.34 | % | (10.22 | %) | (21.76 | %) | (32.01 | %) | (41.37 | %) | ||||||||||||||||
Due to the nature of our client base, and the resulting balance sheet cyclicality, we will sometimes hold high volumes of immediately repricing assets (i.e., cash) to fund impending political organization deposit outflows. The changes in the our balance sheet over the course of a two-year election cycle causes a degree of variability among its interest rate risk results over time.
95
Table of Contents
Our Company
Chain Bridge Bancorp, Inc. is a Delaware-chartered bank holding company and the parent of its wholly-owned subsidiary, Chain Bridge Bank, N.A., a nationally chartered commercial bank with fiduciary powers granted by the OCC. The Company was incorporated on May 26, 2006, and the Bank opened on August 6, 2007. The Company conducts substantially all of its operations through the Bank and has no other subsidiaries.
We offer a range of commercial and personal banking services, including deposits, treasury management, payments, loans, commercial lending, residential mortgage financing, consumer loans, trusts and estate administration, wealth management, and asset custody.
Our mission is to deliver exceptional banking and trust services nationwide, blending financial strength, personalized service, and advanced technology to offer tailored solutions to businesses, non-profit organizations, political organizations, individuals, and families. We aspire to grow responsibly by adapting our personalized service and advanced technology solutions to our clients evolving needs while emphasizing strong liquidity, asset quality, and financial strength. We aim to be recognized for our Strength, Service, Solutions: Your Bridge to Better Banking Nationwide.
As of March 31, 2024, we held total assets of $1.2 billion, including $346.3 million in cash and cash equivalents, of which $338.0 million were interest-bearing reserves held at the Federal Reserve. Our portfolio included $562.8 million in securities available for sale and held to maturity, with $196.2 million of that in U.S. Treasuries. Net loans held for investment, after accounting for deferred fees and allowances, totaled $300.9 million. Our total deposits stood at $1.1 billion, with stockholders equity at $87.6 million. Approximately 91.8% of these deposits were held in transaction accounts. Our loan-to-deposit ratio was 26.9%.
Our Trust & Wealth department oversaw $186.8 million in assets under custody and $80.7 million in assets under management as of March 31, 2024. Additionally, we had $289.2 million in excess deposits placed at other participating banks as one-way sales using the IntraFi Cash Service® (ICS®) program.
96
Table of Contents
The Company aims to enhance stockholder value while managing risk. One of the metrics that we use to measure our performance is book value per share. The following chart shows that the Company has increased its book value per share at a compound annual growth rate (CAGR) of 8.2% since December 31, 2007, 8.2% from December 31, 2013 and 9.8% from December 31, 2018:
Chain Bridge Bancorp, Inc.
Historical Book Value per Share
Our Regulatory Framework and Banking Philosophy
Chain Bridge Bank, N.A. operates under a national charter with full fiduciary powers granted by the OCC. As of March 31, 2024, only approximately 5.8% of insured depository institutions held this combination of charter and powers, according to FDIC data.
Our national charter allows us to offer banking services across state lines without additional state banking licenses. The OCC serves as our primary federal regulator, overseeing our operations and compliance with applicable federal banking laws and regulations. Additionally, our national bank fiduciary powers enable us to offer trust services broadly.
97
Table of Contents
The following chart shows the proportion of insured depository institutions with a national charter and trust powers as of March 31, 2024:
Within this regulatory context, our Banks operations reflect a banking philosophy that emphasizes liquidity, asset quality, and financial strength. This approach guides our asset allocation strategy, risk management practices, and deposit gathering efforts.
Deposit Composition and Strategy
We aim to attract transaction account deposits, particularly from commercial clients. Our investment approach for these funds is intended to be relatively conservative, based on our interpretation of prudent banking practices and current regulatory guidelines.
98
Table of Contents
As of March 31, 2024, we served deposit clients in 47 states, the District of Columbia, the U.S. Virgin Islands, and Puerto Rico. Approximately 36% of our total deposits and our one-way sell ICS® deposits originated from the District of Columbia and approximately 35% originated from Virginia. A substantial portion of our deposits, particularly those from outside the District of Columbia and Virginia, came from firms providing treasury and regulatory compliance services for political organizations. The following chart shows the distribution of the Banks total deposits and one-way sell ICS® deposits by dollar amount across the United States as of March 31, 2024:
To support our strategy of attracting commercial transaction account deposits, we emphasize services designed to attract commercial clients who manage high transaction volumes. These services include digital onboarding solutions, image cash letter (ICL) processing and treasury management offerings that accommodate multiple users with customizable approval hierarchies. This focus aligns with our goal of attracting and retaining commercial clients with complex transactional needs.
At March 31, 2024, our deposit base included a substantial portion of accounts which we classify as transaction accounts, representing 91.8% of total deposits. For the three months ended March 31, 2024, our cost of funds was 0.35%. The composition of our deposit base and the resulting cost of funds reflect our focus on transaction accounts. Based on our experience, we believe that clients using transaction accounts typically engage more frequently with our banking services and relationship officers compared to those using non-transaction accounts. This potentially increased engagement may lead to higher utilization of our services and aligns with our focus on building strong, long-term client relationships.
99
Table of Contents
The following charts show the composition of the Banks deposits as of March 31, 2024 and the Banks transaction deposits as a percentage of total deposits as of December 31, 2019 through 2023 and March 31, 2024:
|
|
|
Balance Sheet Strategy and Composition
Our balance sheet composition reflects our banking philosophy of emphasizing liquidity, asset quality, and financial strength. Compared to many banks, we aim to allocate a higher proportion of our assets to interest-bearing reserves at the Federal Reserve and to securities that we believe qualify as investment grade. The following chart shows the Companys asset composition as of December 31, 2019 through 2023 and March 31, 2024:
100
Table of Contents
Our asset allocation strategy is designed to balance liquidity maintenance with income generation. We prioritize investments in securities that we believe qualify as investment grade, with a significant portion allocated to U.S. Treasury securities. This approach reflects our focus on managing credit risk while maintaining liquidity. The following chart shows the composition of the Companys securities portfolio as of March 31, 2024:
1. Available for sale securities are reported at fair value, and held to maturity securities are reported at amortized cost.
As of March 31, 2024, our liquidity ratiocalculated as the sum of cash and cash equivalents plus unpledged securities classified as investment grade, divided by total liabilitieswas 79.36%. Recent interest rate increases, however, have created a situation where most securities purchased prior to the last year would realize losses if sold before maturity. This dynamic could potentially constrain their actual liquidity in scenarios requiring immediate liquidation.
Compared to many other banks, we maintain a lower proportion of assets we consider to be illiquid. This is evident in our lack of bank owned life insurance (BOLI) and our loan-to-deposit ratio of 26.9% as of March 31, 2024. We consider BOLI illiquid due to difficulties in selling and significant early termination penalties, including taxation of gains and a 10% IRS penalty. The following chart shows the Companys loan-to-deposit ratio from December 31, 2019 through March 31, 2024:
101
Table of Contents
Lending Approach and Credit Risk Management
Our lending policies are designed to manage credit risk. Owner-occupied and non-owner-occupied commercial real estate loans, including construction and development loans, represented 20.6% of our gross loans as of March 31, 2024. Our approach has historically resulted in what we consider to be low levels of non-performing assets and charge-offs. As of March 31, 2024, we have reported no non-performing assets since June 30, 2012. The Company has not incurred any charge-offs since the third quarter of 2017 and has incurred a cumulative of $265 thousand of net-charge-offs in its history.
The chart below shows the Banks asset and loan composition as of March 31, 2024:
1. C&D loans include construction and development loans and CRE loans include other owner-occupied and non-owner-occupied commercial real estate loans.
Performance Considerations
The foregoing description reflects our banking philosophy and practices as of March 31, 2024. Our banking approach may lead to performance variations under different economic conditions. Our earnings and growth patterns may differ from banks with alternative strategies, particularly in low interest rate environments where our high liquidity may generate comparatively lower returns. The effectiveness of our approach is subject to various factors, including interest rate fluctuations, economic conditions, regulatory changes, and competitive pressures. As such, we may alter our strategies, practices, and asset composition in response to changing circumstances.
Operational Model and Technology Focus
Our model emphasizes attentive, relationship-based service enhanced by technology solutions. This strategy allows the Bank to serve clients efficiently across a wide geographic area while maintaining lower overhead costs compared to some branch-based banking models.
We believe our use of technology allows us to deliver banking services efficiently, with a focus on meeting the needs of commercial clients who manage high transaction volumes. Our treasury management system is designed to handle substantial transaction volumes and accommodate complex organizational structures often found in larger commercial entities. The system features multi-user access with customizable approval hierarchies, allowing clients to tailor the system to their specific operational needs. It also offers integration capabilities with popular accounting software and includes mobile batch check deposit functionality.
102
Table of Contents
Our technology infrastructure includes systems for processing ICLs in X9.37 file formats. This feature allows us to handle electronic deposits efficiently for transaction-intensive clients. The ICL processing can benefit organizations requiring streamlined payment processing. While this service may be particularly useful for certain high-volume clients, we aim to provide efficient banking solutions to a diverse range of commercial enterprises. As payment technologies evolve, we strive to adapt our services to meet changing client needs.
The Bank operates without a branch network. As of March 31, 2024, we maintain our headquarters location but do not operate any branches. This approach offers several potential advantages, including cost-efficiency and broad geographic reach. Since our inception, we have prioritized the digital delivery of our services. Our digital platform enables us to serve clients nationwide without the need for a local physical presence. We allocate the savings from our branch-less model to invest more in our technology infrastructure and human capital.
Our model has historically contributed to favorable efficiency metrics. For the three months ended March 31, 2024 (annualized), we reported an efficiency ratio of 55.0%, which is calculated as non-interest expense divided by the sum of net interest income and non-interest income, and a non-interest expense to average assets ratio of 2.04%. The following chart shows the Companys efficiency ratio and ratio of non-interest expense to average assets for the years ended December 31, 2019 through December 31, 2023 and the three months ended March 31, 2024:
|
|
|
Note: Ratios for the three-months ended March 31, 2024 are presented at an annualized basis.
While we emphasize digital services, we also prioritize attentive personal service and a relationship-based approach. Our relationship officers provide dedicated service to various client segments, including our political organization clients.
Experience in Serving Political Organizations
We focus on clients and business segments where our experience may offer advantages, such as services for political organizations, tailored business, and residential lending and trust and wealth management. Our approach generally favors developing capabilities in less saturated sectors and avoiding highly competitive markets, like commercial real estate or mass-market consumer banking. We have historically grown organically, without relying on marketing, branches, or commissioned sales. Many of our new business opportunities have come through word-of-mouth referrals, and we believe our client-focused approach has contributed to maintaining strong relationships.
As of March 31, 2024, we estimate a majority of our demand deposits were represented by political organizations. We have experience providing deposit services to various political organizations, including:
| | Campaign committees |
| | Party committees (national, state, and local) |
| | Corporate and trade association PACs |
103
Table of Contents
| | Super PACs and Hybrid PACs |
| | Non-committee 527 organizations |
| | Leadership PACs |
| | Joint fundraising committees |
| | Presidential inaugural committees |
Many of our relationship officers are proficient in servicing political organization clients. They offer personalized service and tailored solutions for account management, image cash letter, remote deposit capture, payment processing and treasury management.
Certain aspects of our deposits fluctuate seasonally. Most of this seasonality comes from commercial depositors, primarily political organizations and their vendors that generate and spend funds around federal election cycles. Federal elections in the United States occur every two years in the fourth quarter, on the first Tuesday after the first Monday in November. Primary elections for federal offices, determined by the state and political parties, typically occur in the first, second, or third quarter of the year. Historically, our total deposits have gradually increased in quarters leading up to a federal election, followed by a sharp decline around the election. Deposit growth tends to be stronger leading up to presidential elections, which occur every four years, compared to biennial midterm elections.
Accordingly, Federal election cycles significantly influence our deposit levels. Certain types of accounts, such as political party committee accounts, maintain funds throughout the election cycle. Other types of accounts, such as campaign committee accounts, are often established for single campaigns and exhibit greater seasonality. In order to mitigate seasonality risk, we aim to maintain a relatively high level of cash reserve deposits at the Federal Reserve.
As of June 2024, the Bank is experiencing increased deposit levels ahead of the November 2024 presidential election, consistent with patterns observed in previous election cycles. As a result of the 2024 presidential election, we expect deposit outflows during the third and fourth quarters of 2024, with the possibility of some outflows extending into early 2025. The precise amount and timing of such outflows remain uncertain and may differ from historical cycles.
104
Table of Contents
The following graph illustrates the seasonality of the Companys deposits from June 30, 2014 through March 31, 2024:
Total Deposit Seasonality
(dollars in billions)
Federal election cycles also impact revenue-generating activities, such as wire transfers, payments, check processing, debit card usage, and treasury management services, which also increase during this period until the end of the election cycle. Additionally, deposits from trade associations may exhibit seasonality. These associations typically bill their members annually for dues and spend the funds down over the course of the year.
105
Table of Contents
Loan Portfolio and Credit Quality
Our loan portfolio is less concentrated in commercial real estate (CRE) loans compared to that of many other banks. As of March 31, 2024, the Banks non-owner occupied CRE represented 43.5% of the Banks total risk-based capital compared to the regulatory guidance threshold of 300% for CRE concentration limits. Additionally, the Banks acquisition, development, and construction (ADC) loans were 12.5% of our total risk-based capital, compared to the regulatory guidance threshold of 100%. The following chart shows the Banks CRE and ADC loans each as a percentage of the Banks total risk-based capital from December 31, 2019 through March 31, 2024:
|
|
|
Our lending policies are designed to limit credit risk by evaluating borrower creditworthiness with a focus on equity, collateral, personal guarantees and capacity to service debt. This strategy has historically helped mitigate credit risk. The Companys allowance for credit losses on loans as a percentage of gross loans was 1.41% at March 31, 2024. As of March 31, 2024, we have reported no non-performing assets since June 2012. The Company has not incurred any charge-offs since the third quarter of 2017 and has incurred a cumulative of $265 thousand of net-charge-offs in its history. The charts below show the ratio of the Companys net charge-offs to average loans and the ratio of the Companys allowance for credit losses on loans to gross loans for the years ended December 31, 2019 to 2023 and the three months ended March 31, 2024:
|
|
|
Note: Ratios for the three-months ended March 31, 2024 are presented at an annualized basis.
106
Table of Contents
Profitability and Stockholder Returns
Our profits are largely a function of the size of our deposits, the gross rate of return earned from investing those deposits, and our costs. Our strategy focuses on increasing our transaction accounts, enhancing the return on our investments, and reducing costs, while mitigating risk and maintaining liquidity, asset quality, and capital strength. We believe we have developed an efficient operating platform by leveraging technology and providing personal service. Rising interest rates since March 2022 have positively impacted our net interest margin. Over the twelve months ended March 31, 2024, the Company earned net income of $11.7 million, or $583 per share.
Our branch-less strategy contributes to lower expense levels compared to many banks. For the three months ended March 31, 2024, our non-interest expense as a percentage of average assets was 2.0%, and our efficiency ratio was 55.0% on an annualized basis. The Companys net interest margin, return on average assets, return on average risk-weighted assets, and return on average equity have increased during recent periods, as illustrated in the charts below.
|
|
|
Note: Ratios for the three-months ended March 31, 2024 are presented at an annualized basis.
As of June 2024, the Bank is experiencing increased deposit levels ahead of the November 2024 presidential election, consistent with patterns observed in previous election cycles. As a result of the 2024 presidential election, we expect deposit outflows during the third and fourth quarters of 2024, with the possibility of some outflows extending into early 2025. These outflows are expected to adversely affect our net interest margin, return on average assets, return on average risk-weighted assets, and return on average equity. The precise amount and timing of such outflows, as well as the effect of such outflows on our net interest margin, return on average assets, return on average risk-weighted assets, and return on average equity, remain uncertain and may differ from historical cycles.
107
Table of Contents
Our Strategy
We aim to build on our established strengths while maintaining what we believe to be a relatively conservative banking approach. Our strategy focuses on markets where we believe we can offer unique value, rather than competing in large, crowded sectors. At the core of our strategy is expanding our market share in specialized political organization deposit services. Political organizations constitute a significant portion of our client base, and the number of political organizations has grown in recent election cycles, according to Federal Election Commission data. We also hold a notable position with corporate and trade association PACs, which we plan to reinforce. We may explore expansion in related areas that align with our core strengths.
We focus on clients and business segments where our experience may offer advantages. Such segments include political organizations, customized business and residential lending, and trust and wealth management. We usually avoid highly competitive areas like commercial real estate lending or mass-market consumer banking.
Our large base of transaction account deposits assists us in managing our earning assets. During periods of high seasonal deposits, we have used the ICS® network to manage our Tier 1 leverage ratio. If we gain more capital to support balance sheet growth, we plan to focus on increasing our share in our target markets.
Our strategy depends on many factors, including market conditions, regulations, and how well we execute our plans. See Risk Factors for a discussion of these and other risks. Further, our strategy may change as circumstances shift, and we cannot guarantee future success. We regularly review our approach to balance growth opportunities with risk management.
Competition
The banking industry is highly competitive. We compete for loans, deposits, capital and fiduciary services with other banks and other kinds of financial institutions and enterprises, such as securities firms, insurance companies, savings and loan associations, credit unions, mortgage brokers, and private lenders, many of which have substantially greater resources or are subject to less stringent regulations. We primarily compete for commercial deposit accounts with the countrys largest banks, which have national reach, and regional banks, some of which also have national reach and advanced technology and treasury management platforms for commercial customers. We also compete with other state, national and international financial institutions located in our market areas as well as savings associations, savings banks and credit unions for loans and retail deposits. Competition among providers of financial products and services continues to increase, with consumers having the opportunity to select from a growing variety of traditional and nontraditional alternatives, including fintech companies, which have grown significantly in recent years. The ability of non-banking financial institutions to provide services previously limited to commercial banks has intensified competition. See Risk FactorsOther Risks Related to Our BusinessThere is no assurance that the Bank will be able to compete successfully with others for its business.
Our Potential Competitive Strengths
Our business model may offer the following potential competitive strengths. While we believe these aspects of our business model demonstrate competitive strengths, our business model also involves certain risks, as discussed in the Risk Factors section.
Regulatory Framework and Banking Philosophy
The Bank operates under a national bank charter with full fiduciary powers, a distinction shared by only a small percentage of U.S. commercial banks. As a national bank, the Bank is primarily regulated by the OCC, which provides us with a unified regulatory framework that may enhance operational efficiency and allow for consistent service delivery across state lines.
108
Table of Contents
Our banking philosophy is reflected in our asset allocation, liquidity position, and risk management practices. Regular examinations by the OCC provide additional oversight of our operations and risk management processes. The combination of our national charter and our positioning may help create a strong foundation for our banking and fiduciary services.
Deposits and Proficiency in Serving Political Organizations
We provide deposit services to a wide range of political organizations, including campaign committees, party committees, PACs, Super PACs, and other tax-exempt 527 organizations. These entities operate within a unique regulatory environment and have specialized operational needs. We organize our associate teams based on their familiarity with specific types of political clients and their unique requirements. This approach is designed to offer attentive relationship management that addresses the complex banking needs of political organizations, such as multi-fund deposit capabilities and managing cyclical cash flow patterns. Our teams work to understand and anticipate the specific challenges faced by political organizations in their banking activities, aiming to provide efficient and effective solutions to our clients. We believe our experience in serving political organizations may contribute to our competitive position in the banking industry.
Technology-Oriented Approach
Since our founding, we have prioritized the use of digital technologies in our operations. This approach has allowed us to expand without relying on a costly branch network. As of March 31, 2024, approximately 29% of our total deposits and one-way sell ICS® deposits originated from outside the District of Columbia and Virginia.
Our technology-oriented strategy aims to provide commercial clients with convenient access to banking services and may contribute to operational efficiencies. For example, we emphasize digital onboarding processes and managing high volumes of deposits using ICL files formatted as X9.37 files, which allows third-party vendors to digitally scan and transmit large volumes of payment images and data for deposit processing. We believe that our transaction-intensive clients may benefit from this service, and that our experience in providing ICL services may differentiate us from our competitors.
We also strive to stay informed about developments in financial technology that could be relevant to our business. While we believe this approach offers certain benefits, the effectiveness and implementation of any banking strategy can vary based on numerous factors, including market conditions, regulatory changes, and competitive pressures.
Client Service Approach
We focus on providing attentive personal service and enhanced accessibility to our clients. Our approach centers on offering direct access to dedicated relationship teams who strive to understand each clients specific needs and industry context. We assign specialized teams to serve specific client segments, aiming to provide knowledgeable and contextual support. These teams endeavor to offer multiple channels for client communication and work towards prompt responses to inquiries. Our goal is to understand individual client needs and tailor our services accordingly, within the scope of our offerings. We believe this approach may enhance the banking experience for many of our clients.
Experienced Leadership
Our executive management team comprises banking professionals with extensive industry experience. Peter G. Fitzgerald, our Chairman, founded the Company in May 2006, drawing on his familys multi-generational background in banking. John J. Brough, our Chief Executive Officer, and David M. Evinger, our President, have been with the Company since July 2006 and have overseen the Banks operations since its inception on August 6, 2007.
109
Table of Contents
Our Board includes individuals with diverse professional backgrounds, bringing expertise in areas such as auditing, risk management, information technology, cybersecurity, governance, credit risk management, and trusts and estates.
Our Principal Products, Services and Markets
We offer a range of banking and trust services, including deposits, treasury management, payments, commercial lending, residential loans, mortgage financing, consumer loans, trust and estate administration, and wealth management. While our deposits come from across the United States, the majority of our loans and trust services are concentrated in the Washington D.C. metropolitan area.
Deposit Services
As of March 31, 2024, transaction account deposit balances made up 91.8% of our total deposits. We provide a variety of commercial and personal deposit services to commercial and individual clients.
Commercial Deposit Services. We offer a suite of deposit accounts designed to meet the needs of businesses:
| | Business Checking Accounts: These accounts are designed for startups, sole proprietorships, and organizations with limited check writing and deposit activity, featuring online and mobile banking capabilities. |
| | Commercial Analysis Checking: These accounts are designed for businesses with high transaction volumes and substantial balances, offering an earnings credit in lieu of interest to offset item processing and service charges. |
| | Commercial Money Market Accounts: These accounts provide competitive interest rates that increase with higher deposit balances, which is an attractive option for clients managing excess cash reserves. |
Personal Banking Services. For individual clients, we offer a variety of checking and savings accounts. These accounts offer online and mobile banking, debit card controls, electronic statements and digital wallet capabilities.
We provide deposit services electronically, which allows us to avoid the costs associated with maintaining a traditional branch network, allowing us to invest more in people and technology and provide our deposit services to clients nationwide. We are also a member of the IntraFi® network of institutions which allows our deposit clients to enroll in the ICS® program to achieve full FDIC insurance. For a discussion of the ICS® program, see Managements Discussion and Analysis of Financial Condition and Results of Operations. As of March 31, 2024, we held deposits from clients across 47 states, the District of Columbia, the U.S. Virgin Islands, and Puerto Rico, with approximately 36% of total deposits and one-way sell ICS® deposits from the District of Columbia and approximately 35% from Virginia.
We have experience in providing deposit services to political organizations. A substantial portion of our deposit business is derived from federal and, to a lesser extent, state political organizations. We have developed a familiarity with the particular banking needs of these entities, many of which are highly regulated under federal or state law, and the compliance professionals who serve them. Our experience in processing transactions for these organizations allows us to offer services designed to meet the needs of our clients in this sector. For example, we serve our deposit clients through experienced relationship officers and seek to offer personal service and tailored solutions for account management, image cash letters, remote deposit capture, payment processing, and treasury management.
110
Table of Contents
Lending
We provide lending services to consumers and commercial borrowers primarily located in the Washington D.C. metropolitan area. As of March 31, 2024, our loan portfolio consisted of 69.8% residential real estate loans, 19.5% commercial real estate loans, 6.9% other consumer loans and 3.9% commercial loans, and approximately 85% of our loans were to borrowers located in the Washington, D.C. metropolitan area.
Consumer Lending. Our consumer lending primarily consists of residential mortgage financing, with a primary focus on adjustable rate mortgages. Long-term fixed-rate mortgages exceeding fifteen years are generally not retained on our balance sheet. We specialize in non-conforming jumbo mortgages designed for individuals with sophisticated financial profiles and diverse income streams, as well as construction loans for building or renovating a primary residence. We also provide co-op financing, a service typically not offered by mass retail lenders.
Commercial Lending. We provide commercial real estate loans and commercial loans to businesses primarily located in the Washington D.C. area. We also provide commercial real estate loans secured by income producing properties or owner-occupied properties. We also provide commercial loans to finance a range of business needs, including expansion, equipment purchases and working capital. In the fourth quarter of 2023, we launched our own-branded business credit card program, offering both secured and unsecured credit lines, helping us reduce our reliance on third-party product providers. Our secured business credit card provides businesses with a credit line backed by collateral. Our unsecured business credit card offers a line of credit without collateral, suitable for established businesses with strong credit histories. This initiative was designed to meet the needs of our commercial clients. As of March 31, 2024, the outstanding balance on our business credit cards was immaterial.
Trust and Wealth Management Services
Our Trust & Wealth Department commenced operations in the third quarter of 2020 after the approval by the OCC of the Banks application for full fiduciary powers. Our trust offerings serve individuals, families, charitable organizations, and businesses. Our Trust & Wealth Department offers a range of fiduciary services, including:
| | Serving as trustee, investment manager with sole or joint discretion, executor, administrator, registrar of stocks and bonds, and guardian of estates, management of hard-to-value assets such as real estate, closely held businesses, mineral interests, loans and notes, life insurance, and tangible assets like collectibles, and offering specialized trusts such as special needs trusts, settlement protection trusts, land trusts, and charitable trusts. |
| | Providing wealth management services, including investment management, financial planning, and personalized strategies integrating investments, cash flow, risk management, and estate planning. |
| | Providing custodial services for both publicly traded and unique and hard-to-value assets to individual investors, trust administrators, nonprofits, and retirement account holders. |
In 2023, we initiated a pilot of the Black Diamond Wealth Platform, which is designed to enhance client experiences by providing a dashboard that integrates information from our trust accounting system and financial planning software. The platform allows clients to access more detailed information about their financial status, such as asset allocation, account activity, portfolio performance, and projected income, for both individual accounts and consolidated portfolios. We have completed the initial rollout of the platform to our current clients, but work continues throughout 2024 as we incorporate additional features.
Although we primarily provide trust and wealth management services to clients in the Washington, D.C. area, our national banking charter and fiduciary powers enable us to provide these services in the majority of states, differentiating us from many other financial institutions. However, some states have physical presence requirements for trust services, and the interplay between federal and state regulations in this area continues to
111
Table of Contents
evolve. We consider these factors as we serve clients across jurisdictions. As of March 31, 2024, 66.50% of the assets under custody and management from our trust and wealth management services were derived from clients located in Virginia, Maryland, and Washington, D.C.
Our Trust & Wealth department is subject to the supervision, examination and regulation of the OCC, which requires us to adhere to federal regulations and industry standards pertinent to fiduciary activities. In addition, our fiduciary activities are governed by the National Bank Act, which creates a statutory lien for funds our clients hold in trust and custodial accounts, and prohibits the use of trust and custodial assets for the Banks business activities.
Risk Management
We believe that effective risk management and control processes are essential to the Banks safety and soundness, our ability to address the challenges that we face and, ultimately, our long-term corporate success. Generally speaking, risk is the potential that events, expected or unanticipated, may have an adverse effect on our current or projected earnings or financial condition or on our franchise value. Consistent with risk assessment system used by the OCC, we evaluate and monitor the following categories of risk:
| | Credit risk. Credit risk refers to the risk arising from an obligors failure to perform as agreed. See Managements Discussion and Analysis of Financial Condition and Results of OperationsFinancial ConditionCredit Policies and Procedures for a discussion of how we seek to manage credit risk. |
| | Interest rate risk. Interest rate risk refers to the risk arising from movements in interest rates. See Managements Discussion and Analysis of Financial Condition and Results of OperationsInterest Rate Sensitivity and Market Risk for a discussion of how we seek to manage interest rate risk. |
| | Liquidity risk. Liquidity risk refers to the risk arising from our inability to meet our obligations when they come due. Liquidity risk also includes the risk of being unable to access funding sources or manage funding levels, or failing to recognize or address changes in market conditions that affect our ability to liquidate assets quickly and with minimal loss in value. See Managements Discussion and Analysis of Financial Condition and Results of OperationsLiquidity and Capital ManagementLiquidity Risk Management for a discussion of how we seek to manage liquidity risk. |
| | Price risk. Price risk refers to the risk arising from changes in the value of assets or liabilities accounted for on a mark-to-market basis. To manage price risk, we monitor our investment portfolio and generally attempt to avoid activities that would incur additional price risk, such as market-making, dealing, trading, or otherwise taking positions in future, foreign exchange, equities, commodities, or other speculative markets. |
| | Operational risk. Operational risk refers to the risk arising from inadequate or failed internal processes or systems, the misconduct or errors of people or adverse external events. We seek to mitigate operational risks by expanding our operations team and training; working with our vendors to use antifraud protections; establishing security procedures for our clients; and engaging in periodic independent audits of our operations and operating controls. |
| | Compliance risk. Compliance risk refers to the arising from violations of, or nonconformance with, laws, rules, regulations, prescribed practices, policies and procedures, or ethical standards. We have implemented a compliance training program training program for our employees that includes policies, training, monitoring and change management. We engage an outside firm to monitor our compliance functions on a quarterly basis. |
| | Strategic risk. Strategic risk refers to the risk arising from adverse business decisions, improper implementation of decisions, or lack of responsiveness to changes in the banking industry and operating environment. Our Board is charged with overseeing our corporate strategy and our Risk Committee performs strategic risk assessments. |
We also seek to monitor our exposure to cyber risk, which generally refers to the risk arising from inadequate or failed information technology systems, vulnerabilities to internal information technology networks, engineered breaches of client information or inadequate information technology policies and procedures. Given
112
Table of Contents
the rapidly changing cybersecurity landscape, we evaluate our cyber risk management practices regularly, which may include testing the security of our information technology infrastructure, engaging third parties to conduct independent reviews and audits, scanning for internal vulnerabilities and adopting measures designed to help our clients stay protected against cybersecurity threats.
Our Board, both directly and through its committees, is responsible for overseeing our risk management processes. In particular, our Risk Committee oversees our enterprise-wide risk management framework, our financial and operational risks (including, without limitation, capital adequacy, compliance, credit, liquidity, market, operational, strategic and asset risks and the control processes with respect to such risks), and our risk appetite and tolerance. See ManagementBoard Oversight of Risk Management.
Intellectual Property
Our intellectual property is important to the success of our business. We own a variety of trademarks, service marks, trade names, logos and other intellectual property, including the trademarks Chain Bridge Bank, Chain Bridge Bank, N.A., Chain Bridge Bank, N.A. Trust & Wealth, and Chain Bridge Bank, N.A. Mortgage which we have registered with the United States Patent and Trademark Office. We intend to protect the use of our trademarks and other intellectual property nationwide.
Human Resources
As of March 31, 2024, we employed 75 full-time employees. None of our employees is party to a collective bargaining agreement. We consider our relationship with our employees to be excellent and have not experienced interruptions of operations due to labor disagreements.
Our success depends on our ability to attract, develop and retain qualified professionals. We offer competitive compensation and benefits designed to attract and retain top talent. We offer a short-term cash incentive compensation plan (the Incentive Compensation Plan) for which all employees of the Bank are eligible. The Incentive Compensation Plan focuses on both financial results and risk management and is designed to incentivize prudent and profitable growth by rewarding participants based on the performance of the Company as a whole, rather than individual achievement, in order to promote teamwork and collaboration among employees. We also administer a long-term cash incentive plan (the Cash LTIP) to incentivize and retain key employees of the Bank and encourage participants to contribute to the long-term increase of the Companys retained earnings. See Executive CompensationNarrative Disclosure to Summary Compensation TableShort-Term Cash Incentive Compensation and Executive CompensationNarrative Disclosure to Summary Compensation TableLong-Term Cash Incentive Compensation for more information about the Incentive Compensation Plan and Cash LTIP.
Properties
Chain Bridge Bank, N.A. owns all its banking and other offices, located in McLean, Virginia. Our principal executive office is located at 1445-A Laughlin Avenue, McLean, Virginia, which includes our banking office, commercial division and administrative offices. We also own property located at 1440 Emerson Avenue, McLean, Virginia for our future trust division and administrative office and at 6718 Whittier Avenue, McLean Virginia for our commercial banking, accounting and administration, and operations departments. We also own property located at 1445 Laughlin Avenue, McLean, Virginia, which includes our mortgage division and part of the space we lease to a commercial tenant.
Legal and Regulatory Proceedings
We are not presently party to any legal and regulatory proceedings the resolution of which we believe would have a material adverse effect on our business, prospects, financial condition, liquidity, results of operation, cash flows or capital levels. See Note 1, Loss Contingencies to our consolidated financial statements and the notes thereto included elsewhere in this prospectus for further information regarding our legal and regulatory proceedings.
113
Table of Contents
The Reclassification
Prior to the completion of this offering, we will file our Charter, which will authorize the establishment of our Class A common stock and Class B common stock and effect the reclassification of each outstanding share of our old common stock into 170 shares of Class B common stock. Prior to the completion of this offering, we will also adopt our amended and restated bylaws. Our Charter and Bylaws will become effective prior to the completion of this offering. See Description of Capital Stock.
114
Table of Contents
The Company and the Bank are subject to extensive regulation under federal and state law. The following information describes certain aspects of that regulation applicable to the Company and the Bank and does not purport to be complete. The costs of compliance with the regulatory regime and supervisory framework applicable to the Company and the Bank are significant. The level of regulation and oversight over financial services activities also continues to increase, including the regulatory enforcement environment applicable to banks and bank holding companies. The laws, regulations and supervisory guidance applicable to the Company and the Bank are subject to frequent and ongoing change. A change in applicable laws, regulations or policies, or a change in the way such laws, regulations, or policies are interpreted or enforced by regulatory agencies or courts, may have a material impact on the business, operations, and earnings of the Company and the Bank. The likelihood and timing of any future changes, and the effect of such changes on the Company and the Bank, are not determinable at this time with any degree of certainty.
Chain Bridge Bancorp, Inc.
The Company is a bank holding company organized under the laws of Delaware within the meaning of the Bank Holding Company Act of 1956, as amended (the BHC Act), and is registered as such with the Federal Reserve. As a bank holding company, the Company is subject to supervision, regulation, and examination by the Federal Reserve and is required to file various reports with the Federal Reserve, including FR Y-9SP (Parent Company Only Financial Statements for Small Holding Companies).
Under the BHC Act, a bank holding company may elect to become a financial holding company and thereby engage in a broader range of financial and other activities than are permissible for traditional bank holding companies. The Company has not elected to become a financial holding company and has no immediate plans to become a financial holding company.
Chain Bridge Bank, National Association
The Bank is a national bank chartered under the laws of the United States and is subject to supervision, regulation, periodic examination, enforcement authority and oversight by the OCC and is required to file Consolidated Reports of Condition and Income (Call Reports) on a quarterly basis with the FFIEC and various other reports and additional information with the OCC. The OCC has primary supervisory and regulatory authority over the operations of the Bank. The OCC has broad enforcement powers over national banks, such as the Bank, including the power to impose fines and other civil and criminal penalties and to appoint a conservator or receiver if any of a number of conditions are met. In addition to its supervisory and regulatory oversight over banking operations, the OCC also undertakes examinations and supervision of the fiduciary activities of the Bank, as described further under Permitted Activities below.
Because the Bank accepts insured deposits from the public, it is also subject to secondary regulatory oversight by the FDIC and is subject to the FDICs deposit insurance requirements. The Bank is a member of the FDIC (Certificate Number 58595).
Depository institutions, including the Bank, are subject to extensive federal regulations that significantly affect their businesses and activities. Regulatory bodies have broad authority to implement standards and initiate proceedings designed to prohibit depository institutions from engaging in unsafe and unsound banking practices. The standards relate generally to operations and management, asset quality, interest rate exposure, and capital. The bank regulatory agencies are authorized to take action against institutions that fail to meet such standards.
As required for national banks, the Bank is a member of the Federal Reserve System and has subscribed for stock in the Federal Reserve System in an amount equal to 6% of its capital and surplus, of which 3% was paid upon becoming a member of the Federal Reserve System and 3% is held in reserve and callable by the Federal Reserve.
115
Table of Contents
The Dodd-Frank Act
The Dodd-Frank Wall Street Reform and Consumer Protection Act of 2010 (the Dodd-Frank Act), signed into law in July 2010, significantly restructured the financial regulatory regime in the United States and has had a broad impact on the financial services industry as a result of the significant regulatory and compliance changes required under the act.
The Economic Growth, Regulatory Relief and Consumer Protection Act of 2018 (the EGRRCPA), which became effective May 24, 2018, amended the Dodd-Frank Act to provide regulatory relief for certain smaller and regional financial institutions, such as the Company and the Bank. The EGRRCPA, among other things, provides financial institutions with less than $10 billion in total consolidated assets with relief from certain capital requirements. The EGRRCPA also expanded the category of bank holding companies that may rely on the Federal Reserves Small Bank Holding Company Policy Statement (the SBHC Policy Statement) by raising the maximum amount of consolidated assets a qualifying bank holding company may have from $1 billion to $3 billion. In addition to meeting the asset threshold, a bank holding company must not engage in significant nonbanking activities, not conduct significant off-balance sheet activities, and not have a material amount of debt or equity securities outstanding and registered with the SEC (subject to certain exceptions). The Federal Reserve may, in its discretion, exclude any bank holding company from the application of the SBHC Policy Statement if such action is warranted for supervisory purposes.
Deposit Insurance
The Bank accepts deposits that are insured by the FDIC up to the applicable limits. Under the FDIA, the FDIC may terminate the insurance of an institutions deposits upon a finding that the institution has engaged in unsafe or unsound practices; is in an unsafe or unsound condition to continue operations; or has violated any applicable law, regulation, rule, order or condition imposed by the FDIC. We do not know of any practice, condition or violation that might lead to termination of deposit insurance at the Bank. The FDICs DIF is funded by assessments on insured depository institutions, including the Bank, which are subject to adjustment by the FDIC.
On October 18, 2022, the FDIC adopted a final rule to increase base deposit insurance assessment rate schedules uniformly by 2 basis points beginning in the first quarterly assessment period of 2023. The increase is being instituted to account for extraordinary growth in insured deposits during the first and second quarters of 2020, which caused a substantial decrease in the designated reserve ratio of the DIF to total industry deposits. The FDIC has indicated that the new assessment rate schedules will remain in effect until the DIF reserve ratio meets or exceeds 2 percent. In the years ended December 31, 2023 and 2022, the Company recorded expense of $585 thousand and $848 thousand, respectively, for FDIC insurance premiums.
Capital Requirements
The Federal Reserve, the OCC, and the FDIC have issued substantially similar capital requirements applicable to all banks and bank holding companies. In addition, those regulatory agencies may from time to time require that a banking organization maintain capital above the minimum levels because of its financial condition or actual or anticipated growth.
As a bank holding company with less than $3 billion in total consolidated assets, the Company is currently treated as a small bank holding company under the Federal Reserves SBHC Policy Statement and is exempt from the Federal Reserves consolidated risk-based capital and leverage rules at the holding company level. Although the Company expects to continue to be treated as small bank holding company under the SBHC Policy Statement, the Federal Reserve has significant discretion to determine whether a publicly traded bank holding company (or any bank holding company) may continue to rely on the SBHC Policy Statement and will make such determinations on a case-by-case basis. If the Company continues to be treated as a small bank holding company, the Companys capital adequacy will be evaluated at the bank level and on a parent-only
116
Table of Contents
basis, and it would not be subject to consolidated capital standards for regulatory purposes. If the Company in the future is advised by the Federal Reserve that it may no longer rely on the SBHC Policy Statement, the Company will become subject to the Federal Reserves consolidated capital standards applicable to bank holding companies. The Company believes that it would be able to satisfy the Federal Reserves consolidated capital rules.
The Bank is subject to the rules implementing the Basel III capital framework and certain related provisions of the Dodd-Frank Act (the Basel III Capital Rules). Under the Basel III Capital Rules, banks must hold a capital conservation buffer above the adequately capitalized risk-based capital ratios of 2.50% for all ratios, except the Tier 1 leverage ratio. The Basel III Capital Rules, effective January 1, 2015, require the Bank to comply with the following minimum capital ratios: (i) a ratio of common equity Tier 1 to risk-weighted assets of at least 4.50%, plus a 2.50% capital conservation buffer (effectively resulting in a minimum ratio of common equity Tier 1 to risk-weighted assets of 7.00%); (ii) a ratio of Tier 1 capital to risk-weighted assets of at least 6.00%, plus the 2.50% capital conservation buffer (effectively resulting in a minimum Tier 1 capital ratio of 8.50%); (iii) a ratio of total capital to risk-weighted assets of at least 8.00%, plus the 2.50% capital conservation buffer (effectively resulting in a minimum total capital ratio of 10.50%); and (iv) a leverage ratio of 4.00%, calculated as the ratio of Tier 1 capital to average assets (Tier 1 Leverage ratio). The capital conservation buffer is designed to absorb losses during periods of economic stress. Banking institutions with a ratio of common equity Tier 1 to risk-weighted assets above the minimum but below the conservation buffer face constraints on dividends, equity repurchases, and compensation, based on the amount of the shortfall.
With respect to banks, the prompt corrective action regulations pursuant to Section 38 of the FDIA require, among other things, that federal bank regulators take prompt corrective action with respect to institutions that do not meet minimum capital requirements. For this purpose, the law establishes five capital categories: well capitalized, adequately capitalized, undercapitalized, significantly undercapitalized and critically undercapitalized. At each successive lower capital category, an insured depository institution is subject to more restrictions and prohibitions, including restrictions on growth, restrictions on interest rates paid on deposits, restrictions or prohibitions on payment of dividends, and restrictions on the acceptance of brokered deposits. To be well capitalized under these regulations, a bank must have the following minimum capital ratios: (i) a common equity Tier 1 capital ratio of at least 6.50%; (ii) a Tier 1 capital to risk-weighted assets ratio of at least 8.00%; (iii) a total capital to risk-weighted assets ratio of at least 10.00%; and (iv) a Tier 1 Leverage ratio of at least 5.00%.
As of March 31, 2024, the Banks common equity Tier 1 capital ratio was 25.30%; its Tier 1 capital to risk-weighted asset ratio was 25.30%; its total capital to risk-weighted asset ratio was 26.44%; and its Tier 1 Leverage ratio was 9.10%. The Bank exceeded the thresholds to be considered well capitalized as of March 31, 2024.
In September 2019, the federal banking agencies jointly issued a final rule required by the EGRRCPA that permits qualifying banks and bank holding companies that have less than $10 billion in consolidated assets to elect to be subject to a 9% leverage ratio that would be applied using less complex leverage calculations (commonly referred to as the community bank leverage ratio or CBLR). Under the rule, which became effective on January 1, 2020, banks and bank holding companies that opt into the CBLR framework and maintain a CBLR of greater than 9% are not subject to other risk-based and leverage capital requirements under the Basel III Capital Rules and would be deemed to have met the well capitalized ratio requirements under the prompt corrective action framework. The Bank has not opted into the CBLR framework.
Enforcement Actions and Receivership
In addition to measures taken under the prompt corrective action regulations, insured banks may be subject to potential enforcement actions by the federal banking agencies for unsafe or unsound practices in conducting their businesses or for violations of any law, rule, regulation, or any condition imposed in writing by the agency or any written agreement with the agency. Enforcement actions may include the imposition of a conservator or receiver, the issuance of a cease-and-desist order that can be judicially enforced, the termination
117
Table of Contents
of insurance of deposits (in the case of a depository institution), the imposition of civil money penalties, the requirement to make restitution payments to customers who have experienced an economic loss due to bank actions, the issuance of directives to increase capital, the issuance of formal and informal agreements, the issuance of removal, and prohibition orders against institution-affiliated parties. The enforcement of such actions through injunctions or restraining orders may be based upon a judicial determination that the agency would be harmed if such equitable relief was not granted.
If the FDIC is appointed the conservator or receiver of the Bank, the FDIC has the power: (1) to transfer any of the Banks assets and liabilities to a new obligor without the approval of the Banks creditors; (2) to enforce the terms of the Banks contracts pursuant to their terms; or (3) to repudiate or disaffirm any contract or lease to which the Bank is a party, the performance of which is determined by the FDIC to be burdensome and the disaffirmation or repudiation of which is determined by the FDIC to promote the orderly administration of the Bank. In addition, the claims of holders of U.S. deposit liabilities and certain claims for administrative expenses of the FDIC against the Bank would be afforded priority over other general unsecured claims against the Bank, including claims of debt holders and depositors in non-U.S. offices, in the liquidation or other resolution of the Bank. As a result, whether or not the FDIC ever sought to repudiate any debt obligations of the Bank, the debt holders and depositors in non-U.S. offices would be treated differently from, and could receive substantially less, if anything, than the depositors in the U.S. offices of the Bank.
Dividends
The Companys ability to pay dividends or repurchase shares of its common stock is subject to restrictions set forth in the DGCL. The DGCL provides that a Delaware corporation may pay dividends or repurchase its shares either (i) out of the corporations surplus (as defined by Delaware law) or (ii) if there is no surplus, out of the corporations net profits for the fiscal year in which the dividend is declared and/or the preceding fiscal year. It is the Federal Reserves policy, however, that bank holding companies should generally pay dividends on common stock only out of income available over the previous four quarters, and only if prospective earnings retention is consistent with the organizations expected future needs and financial condition. Federal Reserve policy requires that a bank holding company must notify the Federal Reserve if its dividends or repurchase or redemption of shares would cause a net reduction in the amount of such capital instrument outstanding at the beginning of the quarter in which the redemption or repurchase occurs. It is also the Federal Reserves policy that bank holding companies should not maintain dividend levels or repurchase shares in amounts that would undermine their ability to be a source of strength to its banking subsidiaries. The Federal Reserve also discourages dividend payment ratios that are at maximum allowable levels unless both asset quality and capital are very strong. In addition, if the Company does not maintain an adequate capital conservation buffer under the Basel III Capital Rules, its ability to pay dividends to or repurchase shares from stockholders may be restricted.
The Bank is a legal entity that is separate and distinct from the Company. The Companys principal source of cash flow is dividends it receives from the Bank. Statutory and regulatory limitations apply to the Banks payment of dividends to the Company. As a general rule, the amount of a dividend may not exceed, without prior regulatory approval, the sum of net income in the calendar year to date and the retained net earnings of the immediately preceding two calendar years. A depository institution may not pay any dividend if payment would cause the institution to become undercapitalized or if it already is undercapitalized. The OCC may prevent the payment of a dividend if it determines that the payment would be an unsafe and unsound banking practice. The OCC also has advised that a national bank should generally pay dividends only out of current operating earnings.
Permitted Activities
As a bank holding company, the Company is limited generally to managing or controlling banks, furnishing services to or performing services for its subsidiaries, and engaging in other activities that the Federal Reserve determines by regulation or order to be so closely related to banking or managing or controlling banks as to be a
118
Table of Contents
proper incident thereto. Other than its ownership and management of the Bank, the Company does not engage in any other material business.
The Bank is authorized to engage in activities permissible for national banks under federal law. On March 5, 2020, the OCC granted the Bank separate authorization to perform fiduciary activities. The Bank initiated these activities on September 18, 2020 with the opening of its Trust & Wealth Department. The Bank is authorized to perform a range of fiduciary services, including serving as trustee, investment manager with sole or joint discretion, executor, administrator, registrar of stocks and bonds, and guardian of estates. Some states have physical presence requirements for trust services, and the interplay between federal and state regulations in this area continues to evolve. The Banks fiduciary activities are subject to the supervision, examination and regulation of the OCC, which, among other things, requires adherence to conflict of interest rules, rigorous record-keeping requirements, and regular audits and internal controls to maintain the integrity of fiduciary activities.
Banking Acquisitions; Changes in Control
The BHC Act requires, among other things, the prior approval of the Federal Reserve in any case where a bank holding company proposes to (i) acquire direct or indirect ownership or control of more than 5% of the outstanding voting stock of any bank or bank holding company (unless it already owns a majority of such voting shares), (ii) acquire all or substantially all of the assets of another bank or bank holding company, or (iii) merge or consolidate with any other bank holding company. In determining whether to approve a proposed bank acquisition, the Federal Reserve will consider, among other factors, the effect of the acquisition on competition, the effect of the transaction on the convenience and needs of the community to be served, the projected capital ratios and levels on a post-acquisition basis, and the acquiring institutions performance under the CRA, and its compliance with fair housing and other consumer protection laws.
In addition, Section 18(c) of the FDIA, commonly known as the Bank Merger Act, requires the prior written approval of the OCC before any national bank may (i) merge or consolidate with, (ii) purchase or otherwise acquire the assets of or (iii) assume the deposit liabilities of another bank if the resulting institution is to be a national bank. In determining whether to approve a proposed merger transaction, the OCC must consider the effect on competition, the financial and managerial resources and future prospects of the existing and resulting institutions, the convenience and needs of the communities to be served, and the effectiveness of each insured depository institution involved in the proposed merger transaction in combating money-laundering activities.
In acting on any application by a banking organization to make an investment or acquisition subject to its approval, federal banking regulators have substantial discretion in whether or not to grant any approval or non-objection. If the Company or the Bank were to fail to meet certain regulatory criteria or expectations, it could have a material negative effect on the Companys or the Banks ability to obtain approvals and non-objections necessary to engaged in investments or acquisitions.
Subject to certain exceptions, the BHC Act and the CIBC Act, together with the applicable regulations, require Federal Reserve approval (or, depending on the circumstances, no notice of disapproval) prior to any person or company acquiring control of a bank or bank holding company. A conclusive presumption of control exists if an individual or company acquires the power, directly or indirectly, to direct the management or policies of an insured depository institution or to vote twenty-five percent (25%) or more of any class of voting securities of any insured depository institution. A rebuttable presumption of control exists if a person or company acquires ten percent (10%) or more but less than twenty-five percent (25%) of any class of voting securities of an insured depository institution and either the institution has registered its securities with the SEC under Section 12 of the Securities Exchange Act of 1934, as amended (the Exchange Act), or no other person will own a greater percentage of that class of voting securities immediately after the acquisition.
119
Table of Contents
Source of Strength
Federal Reserve policy has historically required bank holding companies to act as a source of financial and managerial strength to their subsidiary banks. The Dodd-Frank Act codified this policy as a statutory requirement. Under this requirement, the Company is expected to commit resources to support the Bank, including at times when the Company may not be in a financial position to provide such resources. Any capital loans by a bank holding company to any of its subsidiary banks are subordinate in right of payment to depositors and to certain other indebtedness of such subsidiary banks. In the event of a bank holding companys bankruptcy, any commitment by the bank holding company to a federal bank regulatory agency to maintain the capital of a subsidiary bank will be assumed by the bankruptcy trustee and entitled to priority of payment.
The Federal Deposit Insurance Corporation Improvement Act
Under FDICIA, the federal bank regulatory agencies possess broad powers to take prompt corrective action to resolve problems of insured depository institutions. The extent of these powers depends upon whether the institution is well capitalized, adequately capitalized, undercapitalized, significantly undercapitalized, or critically undercapitalized, as defined by FDICIA.
As required by FDICIA, the federal bank regulatory agencies also have adopted Interagency Guidelines Prescribing Safety and Soundness Standards relating to, among other things, internal controls and information systems, internal audit systems, loan documentation, credit underwriting, and interest rate exposure. In general, the guidelines require appropriate systems and practices to identify and manage the risks and exposures specified in the guidelines. In addition, the agencies adopted regulations that authorize, but do not require, an institution that has been notified that it is not in compliance with safety and soundness standards to submit a compliance plan. If, after being so notified, an institution fails to submit an acceptable compliance plan, the agency must issue an order directing action to correct the deficiency and may issue an order directing other actions of the types to which an undercapitalized institution is subject under the prompt corrective action provisions described above.
Transactions with Affiliates
Sections 23A and 23B of the Federal Reserve Act and Regulation W establish certain quantitative limits and other requirements for loans, purchases of assets, and certain other transactions between the Bank and its affiliates, including the Company. Among other requirements, loans or extensions of credit to, or other covered transactions with, an affiliate, to the extent permitted, must be on terms and conditions that are substantially the same, or at least as favorable to the Bank, as those prevailing for comparable nonaffiliated transactions.
Loans to executive officers, directors, or to any person who, directly or indirectly, or acting through or in concert with one or more persons, owns, controls or has the power to vote more than 10% of any class of voting securities of a bank and their related interests, are subject to Sections 22(g) and 22(h) of the Federal Reserve Act and their corresponding regulations (Regulation O). Among other things, these loans must be made on terms (including interest rates charged and collateral required) substantially the same as those offered to unaffiliated individuals or be made as part of a benefit or compensation program and on terms widely available to employees, and must not involve a greater than normal risk of repayment. In addition, the amount of loans a bank may make to these persons is subject to both quantitative limits and procedural requirements.
Consumer Financial Protection
The Company is subject to a number of federal and state consumer protection laws that extensively govern its relationship with its clients. These laws include the ECOA, the Fair Credit Reporting Act, the Truth in Lending Act, the Truth in Savings Act, the Electronic Fund Transfer Act, the Expedited Funds Availability Act,
120
Table of Contents
the Home Mortgage Disclosure Act, the FHA, the Real Estate Settlement Procedures Act, the Fair Debt Collection Practices Act, the Service Members Civil Relief Act, laws governing flood insurance, federal and state laws prohibiting unfair and deceptive business practices, foreclosure laws, and various regulations that implement some or all of the foregoing. These laws and regulations mandate certain disclosure requirements and regulate the manner in which financial institutions must deal with clients when taking deposits, making loans, collecting loans, and providing other services. For example, mortgage lenders are required to make a reasonable and good faith determination based on verified and documented information that a consumer applying for a mortgage loan has a reasonable ability to repay the loan according to its terms, either by considering underwriting factors prescribed by Regulation Z or by originating loans that meet the definition of a qualified mortgage. If the Company fails to comply with these laws and regulations, it may be subject to various penalties. Failure to comply with consumer protection requirements may also result in failure to obtain any required bank regulatory approval for merger or acquisition transactions or in being prohibited from engaging in such transactions even if approval is not required.
The Dodd-Frank Act centralized responsibility for consumer financial protection by creating a new agency, the CFPB, and giving it responsibility for implementing, examining, and enforcing compliance with federal consumer protection laws for institutions, as well as their affiliates, with more than $10 billion of assets and, to a lesser extent, smaller institutions. The CFPB focuses on (i) risks to consumers and compliance with the federal consumer financial laws, (ii) the markets in which firms operate and risks to consumers posed by activities in those markets, (iii) depository institutions that offer a wide variety of consumer financial products and services, and (iv) non-depository companies that offer one or more consumer financial products or services. The CFPB has broad rule-making authority for a wide range of consumer financial laws that apply to all banks, including, among other things, the authority to prohibit unfair, deceptive or abusive acts and practices. Abusive acts or practices are defined as those that materially interfere with a consumers ability to understand a term or condition of a consumer financial product or service or take unreasonable advantage of a consumers (i) lack of financial savvy, (ii) inability to protect himself in the selection or use of consumer financial products or services, or (iii) reasonable reliance on a covered entity to act in the consumers interests. The CFPB can issue cease-and-desist orders against banks and other entities that violate consumer financial laws. The CFPB may also institute a civil action against an entity in violation of federal consumer financial law in order to impose a civil penalty or injunction.
Because the Company and the Bank have less than $10 billion in assets, most consumer protection aspects of the Dodd-Frank Act will continue to be applied to the Company by the Federal Reserve and to the Bank by the OCC. However, the CFPB may include its own examiners in regulatory examinations by a smaller institutions principal regulators and may require smaller institutions to comply with certain CFPB reporting requirements. In addition, regulatory positions taken by the CFPB and administrative and legal precedents established by CFPB enforcement activities, including in connection with supervision of larger bank holding companies and banks, could influence how the Federal Reserve and OCC apply consumer protection laws and regulations to financial institutions that are not directly supervised by the CFPB. The precise effect of the CFPBs consumer protection activities on the Company and the Bank cannot be determined with certainty.
Community Reinvestment Act
The CRA requires the appropriate federal banking agency, in connection with its examination of a bank, to assess the banks record in meeting the credit needs of the communities served by the bank, including low- and moderate-income neighborhoods. Furthermore, such assessment is also required of banks that have applied, among other things, to merge or consolidate with or acquire the assets or assume the liabilities of an insured depository institution, or to open or relocate a branch. In the case of a bank holding company applying for approval to acquire a bank or bank holding company, the record of each subsidiary bank of the applicant bank holding company is subject to assessment in considering the application. Under the CRA, institutions are assigned a rating of outstanding, satisfactory, needs to improve, or substantial non-compliance. The Bank was rated outstanding in its most recent CRA evaluation received on December 6, 2021.
121
Table of Contents
On October 24, 2023, the federal bank regulatory agencies issued a final rule to modernize their respective CRA regulations. The revised rules substantially alter the methodology for assessing compliance with the CRA, with material aspects taking effect January 1, 2026 and revised data reporting requirements taking effect January 1, 2027. Among other things, the revised rules evaluate lending outside traditional assessment areas generated by the growth of non-branch delivery systems, such as online and mobile banking, apply a metrics-based benchmarking approach to assessment, and clarify eligible CRA activities. The final rules are likely to make it more challenging or costly for the Bank to maintain its current rating of outstanding or receive a rating of at least satisfactory on its CRA evaluation.
Anti-Money Laundering Legislation
The Company is subject to several federal laws that are designed to combat money laundering, terrorist financing, and transactions with persons, companies or foreign governments designated by U.S. authorities (the AML laws). This category of laws includes the Bank Secrecy Act of 1970, the Money Laundering Control Act of 1986, the USA PATRIOT Act of 2001, and the Anti-Money Laundering Act of 2020.
The AML laws and their implementing regulations require insured depository institutions, broker-dealers, and certain other financial institutions to have policies, procedures, and controls to detect, prevent, and report potential money laundering and terrorist financing. The AML laws and their regulations also provide for information sharing, subject to conditions, between federal law enforcement agencies and financial institutions, as well as among financial institutions, for counter-terrorism purposes. Federal banking regulators are required, when reviewing bank holding company acquisition and bank merger applications, to take into account the effectiveness of the anti-money laundering activities of the applicants.
Office of Foreign Assets Control
The U.S. Treasury Departments Office of Foreign Assets Control (OFAC) is responsible for administering and enforcing economic and trade sanctions against specified foreign parties, including countries and regimes, foreign individuals, and other foreign organizations and entities. OFAC publishes lists of prohibited parties that are regularly consulted by the Company in the conduct of its business in order to assure compliance. The Company is responsible for, among other things, blocking accounts of, and transactions with, prohibited parties identified by OFAC, avoiding unlicensed trade and financial transactions with such parties, and reporting blocked transactions after their occurrence. Failure to comply with OFAC requirements could have serious legal, financial, and reputational consequences for the Company.
Privacy Legislation
Several recent laws, including the Right to Financial Privacy Act of 1978, and related regulations issued by the federal bank regulatory agencies, also provide new protections against the transfer and use of customer information by financial institutions. A financial institution must provide to its customers information regarding its policies and procedures with respect to the handling of customers personal information. Each institution must conduct an internal risk assessment of its ability to protect customer information. These privacy provisions generally prohibit a financial institution from providing a customers personal financial information to unaffiliated parties without prior notice and approval from the customer.
In October 2023, the CFPB proposed a new rule that would require a provider of payment accounts or products, such as the Bank, to make certain data available to consumers upon request regarding the products or services they obtain from the provider. The proposed rule is intended to give consumers control over their financial data, including with whom it is shared, and encourage competition in the provision of consumer financial products and services. For banks with over $850 million and less than $50 billion in total assets, such as the Bank, compliance would be required approximately two and one-half years after adoption of the final rule.
122
Table of Contents
Incentive Compensation
In June 2010, the federal bank regulatory agencies issued final Interagency Guidance on Sound Incentive Compensation Policies intended to ensure that the incentive compensation policies of financial institutions do not undermine the safety and soundness of such institutions by encouraging excessive risk-taking. The Interagency Guidance on Sound Incentive Compensation Policies is based upon the key principles that a financial institutions incentive compensation arrangements should (i) provide incentives that do not encourage risk-taking beyond the institutions ability to effectively identify and manage risks, (ii) be compatible with effective internal controls and risk management, and (iii) be supported by strong corporate governance, including active and effective oversight by the financial institutions board of directors.
The Dodd-Frank Act requires the federal banking agencies and the SEC to adopt rules on incentive-based payment arrangements at specified regulated entities, including banks, having at least $1 billion in total assets. The federal banking agencies issued such proposed rules in March 2011 and issued a revised proposed rule in June 2016. The rule was re-proposed in May 2024, and has not been finalized.
The Federal Reserve reviews, as part of the regular risk-focused examination process, the incentive compensation arrangements of financial institutions, such as the Company, that are not large complex banking organizations. These reviews are tailored to each financial institution based on the scope and complexity of the institutions activities and the prevalence of incentive compensation arrangements. The findings of the supervisory initiatives are included in reports of examination. Deficiencies are incorporated into the institutions supervisory ratings, which can affect the institutions ability to make acquisitions and take other actions. Enforcement actions may be taken against a financial institution if its incentive compensation arrangements, or related risk-management control or governance processes, pose a risk to the institutions safety and soundness and the financial institution is not taking prompt and effective measures to correct the deficiencies.
In accordance with an SEC rule, securities exchanges have adopted rules mandating, in the case of a restatement, the recovery or clawback of excess incentive-based compensation paid to current or former executive officers and requiring listed issuers to disclose any recovery analysis where recovery is triggered by a restatement.
Ability-to-Repay and Qualified Mortgage Rule
Pursuant to the Dodd-Frank Act, the CFPB issued a final rule, effective in January 2014, amending Regulation Z as implemented by the Truth in Lending Act, requiring mortgage lenders to make a reasonable and good faith determination based on verified and documented information that a consumer applying for a mortgage loan has a reasonable ability to repay the loan according to its terms. Mortgage lenders are required to determine consumers ability to repay in one of two ways. The first alternative requires the mortgage lender to consider eight specified underwriting factors when making the credit decision. Alternatively, the mortgage lender can originate qualified mortgages, which are entitled to a presumption that the creditor making the loan satisfies the ability-to-repay requirements. In general, a qualified mortgage is a mortgage loan without negative amortization, interest-only payments, balloon payments, or a term exceeding 30 years and must meet certain price-based thresholds, and the points and fees paid by a consumer cannot exceed 3% of the total loan amount. Qualified mortgages that are higher-priced (e.g., subprime loans) garner a rebuttable presumption of compliance with the ability-to-repay rules, while qualified mortgages that are not higher-priced (e.g., prime loans) are given a safe harbor of compliance. The Bank is predominantly an originator of compliant qualified mortgages.
Cybersecurity
In March 2015, federal regulators issued two related statements regarding cybersecurity. One statement indicates that financial institutions should design multiple layers of security controls to establish lines of defense and to ensure that their risk management processes also address the risk posed by compromised customer
123
Table of Contents
credentials, including security measures to reliably authenticate customers accessing internet-based services of the financial institution. The other statement indicates that a financial institutions management is expected to maintain sufficient business continuity planning processes to ensure the rapid recovery, resumption, and maintenance of the institutions operations after a cyberattack involving destructive malware. A financial institution is also expected to develop appropriate processes to enable recovery of data and business operations and address rebuilding network capabilities and restoring data if the institution or its critical service providers fall victim to this type of cyberattack. If the Company fails to observe the regulatory guidance, it could be subject to various regulatory sanctions, including financial penalties.
Effective April 1, 2022, the OCC, Federal Reserve, and FDIC issued a joint rule imposing upon banking organizations and their service providers notification requirements for significant cybersecurity incidents. Specifically, the rule requires banking organizations to notify their primary federal regulator as soon as possible and no later than 36 hours after the discovery of a computer-security incident that rises to the level of a notification incident as those terms are defined in the rule. Banks service providers are required under that rule to notify any affected bank to or on behalf of which the service provider provides services as soon as possible after determining that it has experienced an incident that materially disrupts or degrades, or is reasonably likely to materially disrupt or degrade, covered services provided to such bank for as much as four hours.
Additionally, effective December 9, 2022, amendments to the Gramm-Leach-Bliley Act of 1999 Safeguards Rule went into effect. That rule requires financial institutions to: (i) appoint a qualified individual to oversee and implement their information security programs; (ii) implement additional criteria for information security risk assessments; (iii) implement safeguards identified by assessments, including access controls, data inventory, data disposal, change management, and monitoring, among other things; (iv) implement information system monitoring in the form of either continuous monitoring or periodic penetration testing; (v) implement additional controls, including training for security personnel, periodic assessment of service providers, written incident response plans, and periodic reports from the qualified individual to the board of directors. Additionally, multiple states and Congress are considering laws or regulations which could create new individual privacy rights and impose increased obligations on companies handling personal data.
The Companys systems and those of its clients and third-party service providers are under constant threat. Risks and exposures related to cybersecurity attacks are expected to remain high for the foreseeable future due to the rapidly evolving nature and sophistication of these threats, as well as due to the expanding use of internet banking, mobile banking, and other technology-based products and services by the Company and its clients.
Future Legislation and Regulation
Congress may enact legislation from time to time that affects the regulation of the financial services industry, and state legislatures may enact legislation from time to time affecting the regulation of financial institutions chartered by or operating in those states. Federal and state regulatory agencies also periodically propose and adopt changes to their regulations or change the manner in which existing regulations are applied. The substance or impact of pending or future legislation or regulation, or the application thereof, cannot be predicted, although enactment of the proposed legislation could impact the regulatory structure under which the Company and the Bank operate and may significantly increase costs, impede the efficiency of internal business processes, require an increase in regulatory capital, require modifications to business strategy, and limit the ability to pursue business opportunities in an efficient manner. A change in statutes, regulations or regulatory policies applicable to the Company or the Bank could have a material adverse effect on the business, financial condition, and results of operations of the Company and the Bank.
124
Table of Contents
Directors and Executive Officers
The following table sets forth biographical information regarding our directors and executive officers as of the date of this prospectus:
| Name |
Age | Position with the Company |
||||
| Executive Officers: |
||||||
| Peter G. Fitzgerald |
63 | Chairman of the Board | ||||
| John J. Brough |
60 | Chief Executive Officer and Director | ||||
| David M. Evinger |
51 | President and Director | ||||
| Joanna R. Williamson |
41 | Executive Vice President and Chief Financial Officer | ||||
| Rachel G. Miller |
30 | Senior Vice President, Counsel and Corporate Secretary | ||||
| Non-employee Directors: |
||||||
| Mark Martinelli |
64 | Director | ||||
| Yonesy F. Núñez |
46 | Director | ||||
| Michael J. Conover |
66 | Director | ||||
| Leigh-Alexandra Basha |
64 | Director | ||||
| Thomas G. Fitzgerald, Jr. |
39 | Director | ||||
| Andrew J. Fitzgerald |
43 | Director | ||||
| Joseph M. Fitzgerald |
71 | Director | ||||
| Michelle L. Korsmo |
52 | Director | ||||
| Benita Thomspon-Byas |
56 | Director | ||||
| Paul Leavitt |
74 | Director | ||||
Executive Officers
Peter G. Fitzgerald, J.D., Chairman of the Board
Mr. Peter G. Fitzgerald has served as the Chairman of the Companys Board since incorporating the Company in May 2006. He has also served as the Chairman of the Banks board of directors since the Bank commenced operations in August 2007. Mr. Fitzgerald has been continuously active in his roles as Chairman since assuming these positions, and his service constitutes his principal occupation. Mr. Fitzgeralds professional background is in banking, law, and public service. He began his legal career as an associate at Isham, Lincoln & Beale in Chicago and later practiced banking law at Riordan, Larson, Bruckert & Moore. From January 1993 to October 1, 1994, he served as General Counsel for Suburban Bancorp, Inc., overseeing legal affairs for 13 banks and various non-bank subsidiaries. On October 1, 1994, Suburban Bancorp, Inc. merged into Bank of Montreal (BMO) and became Harris Bankmont, Inc. Following the merger, Mr. Fitzgerald continued to serve in a legal capacity at Harris Bankmont, Inc. until the end of 1996, when he resigned to run for the U.S. Senate. Between 1988 and 1998, he held board positions at three nationally chartered commercial banks and one state-chartered commercial bank. In 1998, Mr. Fitzgerald was elected to the U.S. Senate, where he served as a Senator representing Illinois from 1999 to 2005. Prior to his tenure in the U.S. Senate, he was elected to the Illinois State Senate, serving from 1993 to 1998. Mr. Fitzgerald completed his secondary education at Portsmouth Abbey School. He earned his A.B. degree, cum laude, with highest distinction in Latin and Greek, from Dartmouth College, and was a co-recipient of the Perkins Literature Prize. As a Rotary scholar, he spent one year studying Modern Greek at the Aristotelian University of Thessaloniki in Greece. Mr. Fitzgerald earned his J.D. degree from the University of Michigan School of Law.
Mr. Fitzgeralds experience in banking, law, and public service, as well as his commitment to the Company and the Bank since their establishment, provide him with the qualifications, attributes, and skills necessary to serve as Chairman of the Board.
125
Table of Contents
John J. Brough, II, M.B.A., Chief Executive Officer and Director
Mr. John J. Brough joined the Company as an Organizer, Chief Executive Officer and director in July 2006. He became a director and the founding Chief Executive Officer of the Bank on August 6, 2007, the day the Bank commenced operations and received its charter from the OCC. Mr. Brough earned his B.S. degree and M.B.A. from Georgetown University. He also participated in the Georgetown International Management Graduate Business Program at Oxford University, England. He maintained his CPA license from 1999 to 2017. Mr. Brough is actively involved in the Virginia Bankers Association (VBA), where he serves on the Board of Directors and the Audit Committee. Additionally, he is a member of the board of VBA Management Services, Inc. and a Trustee of the Virginia Bankers School of Bank Management. From 2015 to 2018, he chaired the Board of Governors of Bishop Denis J. OConnell High School, a Roman Catholic college preparatory school located in Arlington, Virginia.
Mr. Broughs institutional knowledge and banking and accounting experience, as well as his experience as a director of the Company and the Bank, qualify him to serve on our Board of Directors.
David M. Evinger, M.B.A., President and Director
Mr. David M. Evinger serves as director, President and Chief Credit Officer of the Bank, as well as director and President of the Company. Mr. Evinger joined the Company in July 2006 as an Organizer and became Executive Vice President and Chief Credit Officer of the Bank on August 6, 2007, the day the Bank commenced operations and received its charter from the OCC. In 2018, the Banks board of directors promoted him to President of Risk Management, and in 2020, to President of the Bank. The Companys Board promoted him to President of the Company in 2013, and he was elected to the Companys Board in 2016 and the Banks board of directors in 2018. Mr. Evinger holds a B.A. and an M.B.A. from Marymount University and is a graduate of the Virginia Bankers School of Bank Management. He serves as the Chairman of the VBA Lending Executives Committee and on the Advisory Board of the College of Business, Innovation, Leadership, and Technology and Presidents Advisory Council at Marymount University. Since 2015, Mr. Evinger has been a faculty member at the Carolinas-Virginia Commercial Lending School of the Risk Management Association.
Mr. Evingers banking and credit risk management experience, as well as his experience as a director of the Company and the Bank, qualify him to serve on our Board of Directors.
Joanna R. Williamson, CPA, Executive Vice President and Chief Financial Officer
Joanna R. Williamson, CPA, is the Executive Vice President and Chief Financial Officer of both the Company and the Bank. Ms. Williamson joined the Bank in August 2015 as Vice President and Controller. In January 2018, she was appointed Treasurer of the Company and later assumed the role of Senior Vice President and Chief Financial Officer of the Bank. In January 2023, she was promoted to Executive Vice President of the Bank. As of January 2024, she holds the position of Executive Vice President and Chief Financial Officer of the Company and has been reappointed as Executive Vice President and Chief Financial Officer of the Bank. Prior to joining the Bank, Ms. Williamson held managerial positions at Fannie Mae and Dixon Hughes Goodman LLP. She also worked as a Senior Auditor with Ernst & Young. Ms. Williamson is a licensed Certified Public Accountant (CPA) and holds an M.S. and a B.S. in Accounting, magna cum laude, from Virginia Tech.
Rachel G. Miller, Esq., Senior Vice President, Counsel and Corporate Secretary
Rachel G. Miller, Esq., joined the Company and the Bank as Senior Vice President, Counsel, and Corporate Secretary on April 1, 2024. As Corporate Secretary for both the Company and the Bank, Ms. Miller manages board and committee meetings, advises on corporate governance matters, and provides legal counsel. Prior to joining the Company and the Bank, Ms. Miller worked at the law firm Jones Day in the firms Government Regulation Practice from 2021 to 2024. In this capacity, she advised clients on campaign finance, election laws,
126
Table of Contents
corporate governance, entity formation, and compliance matters. Ms. Miller also served as a Law Clerk to the Honorable Chad A. Readler of the United States Court of Appeals for the Sixth Circuit for the 2020 judicial term. Ms. Miller earned her Juris Doctor, summa cum laude, from the University of Notre Dame Law School and received her Bachelor of Arts degree double-majoring in Economics & Government from The University of Texas at Austin. During her time at Notre Dame Law School, Ms. Miller served as an Articles Editor for the Notre Dame Law Review. Ms. Miller is admitted to practice law in the State of New York, the District of Columbia, and before the United States Court of Appeals for the Sixth Circuit. She is also admitted as a Corporate Counsel Registrant in the Commonwealth of Virginia.
Non-employee Directors
Mark Martinelli, CPA, CGMA, CAMS, Chair of the Audit Committee & Director
Mr. Mark Martinelli has served as a director of both the Company and the Bank since January 2024. His professional background is in bank auditing and accounting. Throughout his career, Mr. Martinelli has held numerous leadership positions, including chief executive officer, chief financial officer, and chief audit executive. From 2014, following its spinoff from General Electric Company and initial public offering, until his retirement in 2022, Mr. Martinelli served as the Executive Vice President and Chief Audit Executive at Synchrony Financial, the largest issuer of private label credit cards in the United States. Prior to that, he was a senior audit executive at HSBC North America Holdings and its predecessor, Republic New York Corporation, where he was Senior Executive Vice President and Chief Auditor from 2010 to 2014. Mr. Martinelli began his career at KPMG, LLP, where he was a member of their financial services practice for nine years. In addition to his professional achievements, Mr. Martinelli actively participates in academia and industry discussions. He is a member of the Stan Ross Accountancy Board at Zicklin School of Business, Baruch College, and serves on the Department of Accounting & Taxation Executive Advisory Board at St. Johns University. Mr. Martinelli serves as the Vice Chair of the Baruch College Fund Audit Committee. He holds a Bachelor of Science in Accounting from St. Johns University and contributes to The CPA Journal as a member of the Editorial Review Board.
Mr. Martinelli is a CPA, Chartered Global Management Accountant (CGMA), and Certified Anti-Money Laundering Specialist (CAMS). He chairs the Audit Committee of the Board of the Company. Mr. Martinellis expertise in financial services, auditing and accounting qualify him to serve on our Board of Directors.
Dr. Yonesy F. Núñez, CISSP, CISM, CISA, CGEIT, Director
Dr. Yonesy F. Núñez has served as a director of both the Company and the Bank since January 2024. He possesses an extensive background in information security and technology and has been serving as the Managing Director and Chief Information Security Officer at The Depository Trust & Clearing Corporation (DTCC) since July 2023. Prior to joining DTCC, Dr. Núñez served as Chief Information Security Officer at Jack Henry & Associates, a leading provider of core processing software and services to U.S. banks, from November 2020 to July 2023. Between 2012 and 2020, Dr. Núñez held various senior information security positions at Wells Fargo and Citi. He serves on the advisory boards of Forgepoint Capital and Glilot Capital Partners. His academic credentials include a Doctor of Professional Studies in Computing Information Assurance and Security from Pace University, a Master of Science in Information Systems Engineering from New York University Tandon School of Engineering, and a Bachelor of Science in Finance and Computer Information Systems, with a minor in Economics, from Manhattan College. He is bilingual in English and Spanish, and has limited working proficiency in Italian and Japanese.
Dr. Núñez is a Certified Information Systems Security Professional (CISSP), Certified Information Security Manager (CISM), Certified Information Systems Auditor (CISA), and Certified in the Governance of Enterprise IT (CGEIT). Dr. Núñez chairs the Information Technology Committee of the Banks board of directors. Dr. Núñezs background in information security and technology qualify him to serve on our Board of Directors.
127
Table of Contents
Michael J. Conover, Chair of the Risk Committee and Director
Mr. Michael J. Conover has served as a director of both the Company and the Bank since January 2024. Mr. Conover has been a Managing Director at Soundview Partners Limited Liability Company (Soundview Partners) since June 2021. Prior to joining Soundview Partners, he served as a financial services industry Partner at KPMG LLP (U.S.) for over 20 years until his retirement in 2020, but continues working on a specific assignment with KPMG LLP (Canada) as a Senior Advisor. During his tenure at KPMG, Mr. Conover established the Financial Risk Management practice in the United States, led the Global Capital Markets sector for Audit, Tax and Advisory, and engaged in numerous financial advisory and risk management assignments around the world. He served as KPMGs Global Lead Partner for several of the worlds largest banks and financial services companies. Before joining KPMG, Mr. Conover was a Managing Director at The Secura Group, focusing on financial consulting and risk management. He also held positions at Ryan, Beck & Co., and Drexel Burnham Lambert, where he was involved in bank mergers, acquisitions, and capital-raising assignments. Mr. Conover is a member of the Ithaca College Board of Trustees.
Mr. Conover holds a Bachelor of Science in Finance from Ithaca College and participated in the IMD Global Lead Partner Leadership Program in Lausanne, Switzerland. He chairs the Risk Committee of the Board of the Company. Mr. Conovers experience in the financial services industry, and his expertise in bank risk management, qualify him to serve on our Board of Directors.
Leigh-Alexandra Basha, J.D., L.L.M., Director
Ms. Leigh-Alexandra Basha has served as a director of both the Company and the Bank since February 2024. Ms. Basha is a partner at McDermott Will & Emery LLP, where she leads the firms Private Client Practice Group in Washington, D.C. Her practice focuses on international estate and tax planning, including estate and trust administration, family wealth preservation, tax compliance, business succession planning, and pre-immigration planning. Prior to her current position at McDermott Will & Emery LLP, which she assumed in 2015, Ms. Basha was a partner at Holland & Knight, LLP for a decade, during which time she chaired its International Private Wealth Services practice. Ms. Basha has served as an adjunct professor at American University Washington College of Law, teaching wills, trusts, and estates. She has authored or edited various publications on international tax and estate planning, including A Guide to International Estate Planning: Drafting, Compliance, and Administration Strategies, Second Edition. She received her A.B. degree from Georgetown University, her J.D. from American University Washington College of Law and her Master of Laws from Georgetown University Law Center. She chairs the Trust Oversight Committee of the Banks board of directors.
In her capacity as a director of the Company and the Bank, Ms. Bashas contributions are independent of her professional obligations at McDermott Will & Emery LLP. Ms. Bashas experience in trusts and estate law qualifies her to serve on our Board of Directors.
Thomas G. Fitzgerald, Jr., CFA, Director
Mr. Thomas G. Fitzgerald, Jr. serves as a director of both the Company and the Bank. He has been a member of the Companys Board since April 2020 and joined the Banks board of directors in January 2024. His professional experience is in investment management and banking, with expertise in fixed-income analysis, financial statement analysis, and corporate finance. Since September 2018, Mr. Fitzgerald has served as the chief executive officer of Fitzgerald Investment Management Company LLC, where he oversees a single-family office that prioritizes asset allocation and cost-effective investment strategies for individuals and limited
partnerships. In addition to his chief executive officer position, Mr. Fitzgerald has been a Manager of TF Management LLC, the General Partner of TGF Investments, L.P., since 2018. In this capacity, he manages private investments, including the partnerships investments in the Company. Prior to his current roles, Mr. Fitzgerald held various leadership positions at First Bancorp of Durango, Inc. between 2012 and 2018. He
128
Table of Contents
served as a director and later as President from September 2017 to September 2018. During his tenure, he managed the companys merger with Triumph Bancorp, Inc. and served as a director at the First National Bank of Durango and Bank of New Mexico. From 2008 to 2017, Mr. Fitzgerald worked as a Managing Director at Perry Capital, a New York City-based investment management firm specializing in cross-asset and event-driven strategies. He managed the firms largest investments in financial institutions in the United States and globally and focused on distressed debt across various industries. Mr. Fitzgerald began his professional career as an Analyst in the Financial Institutions Group at Lehman Brothers, where he served on teams advising regional banks during the Global Financial Crisis.
He is a Chartered Financial Analyst (CFA) and holds a B.A. in Economics from Stanford University, with minors in Classics and Management Science & Engineering. He chairs the Asset-Liability Committee of the Banks board of directors and serves on the Governance and Nominating Committee of the Board of the Company. Mr. Fitzgeralds expertise in investment management and banking qualify him to serve on our Board of Directors.
Andrew J. Fitzgerald, J.D., M.B.A., Director
Mr. Andrew J. Fitzgerald serves as a director of both the Company and the Bank. He has been a member of the Companys Board since April 2020 and joined the Banks board of directors in January 2024. Since January 2018, Mr. Fitzgerald has served as the Chief Investment Officer and, since January 2022, the Managing General Partner of Otis Road Investments, L.P. This single-family office focuses on family wealth preservation, capital appreciation, and diversification, actively investing in the banking and financial services sectors and a variety of other industries. From 2011 to 2017, Mr. Fitzgerald was a Managing Director and Associate General Counsel at Hovde Group, an investment bank specializing in financial institutions. In addition to his banking and investment management work, Mr. Fitzgerald is co-founder of Trippers & Askers, a winery based in Santa Barbara, California. Mr. Fitzgerald has been a director of Southern Wisconsin Bancshares Corporation and Farmers Savings Bank since 2013. He also serves as the Chair of the Board of Trustees of Calm, a not-for-profit specializing in the prevention and treatment of childhood trauma.
Mr. Fitzgerald earned his B.A., M.B.A., and J.D. degrees from Northwestern University. He serves on the Governance and Nominating Committee of the Board of the Company. Mr. Fitzgeralds legal and financial services industry expertise qualify him to serve on our Board of Directors.
Joseph M. Fitzgerald, Director
Mr. Joseph M. Fitzgerald (no relation to the Fitzgerald Family) serves as a director of both the Company and the Bank. He has been a member of the Banks board of directors since its founding in 2007 and joined the Companys Board in October 2022. His professional expertise is in risk management for financial institutions. Since January 2005, Mr. Fitzgerald has been the president of Fitzgerald Financial LLC, providing risk management and regulatory consulting services to financial institutions worldwide. He previously spent over 18 years at the Secura Group, where he was the Managing Director of its global credit services practice. His career commenced as a National Bank Examiner at the OCC, the regulator of nationally chartered banks, where he represented the OCC on the Basel International Supervisors Committee Subgroups for off-balance-sheet risk and interest rate risk. Mr. Fitzgerald also served as a regular instructor to both OCC and FFIEC schools for credit, foreign exchange, and nontraditional banking activities.
Mr. Fitzgerald graduated from the University of Notre Dame and completed further studies at the Darden School of International Banking at the University of Virginia and obtained a Certificate of Accountancy from the University of Pittsburgh. Mr. Fitzgerald chairs the Loan Committee of the Banks board of directors. Mr. Fitzgeralds expertise in financial risk management and bank supervision and regulation, coupled with his experience as a director of the Bank, qualify him to serve on our Board of Directors.
129
Table of Contents
Michelle L. Korsmo, Chair of the Governance and Nominating Committee and Director
Ms. Michelle L. Korsmo serves as a director of both the Company and the Bank. She has been a member of the Banks board of directors since November 2019 and joined the Companys Board in October 2022. Her professional experience is in leading trade associations, government affairs, and corporate governance. Since May 2022, Ms. Korsmo has been President and Chief Executive Officer of the National Restaurant Association, the leading business association for the restaurant industry, which comprises approximately one million restaurant and food service outlets and a workforce of 15.5 million employees. She is also the Chief Executive Officer of the National Restaurant Association Educational Foundation. From September 2018 to May 2022, Ms. Korsmo was President and Chief Executive Officer of the Wine & Spirits Wholesalers of America, the national trade association representing the wholesale tier of the wine and spirits industry. She also served seven years as head of the American Land Title Association (ALTA), the national trade association for real estate settlement services and the land title industry. Prior to ALTA, Ms. Korsmo served as Executive Vice President of the Americans for Prosperity Foundation and previously served as the Deputy Chief of Staff at the U.S. Department of Labor.
Ms. Korsmo has served as a Trustee at Sterling Multifamily Trust since 2017 and currently serves as Chair of the Governance and Nominating Committee. Ms. Korsmo is also a member of the Bryce Harlow Foundation board of directors. She chairs the Governance and Nominating Committee of the Board of the Company. Ms. Korsmos management and governance expertise qualify her to serve on our Board of Directors.
Benita Thompson-Byas, Chair of the Compensation Committee and Director
Ms. Benita Thompson-Byas serves as a director of both the Company and the Bank. She has been a member of the Banks board of directors since its founding in 2007 and joined the Companys Board in October 2022. Her areas of expertise include marketing, communications, business operations, and human resources. In her position as Senior Vice President and Vice Chair of Thompson Hospitality, L.P. since January 2008, Ms. Thompson-Byas has been instrumental in steering the company to its status as the largest minority-owned food service company in the United States. Additionally, Ms. Thompson-Byas serves as the Director of Community Relations at Thompson Hospitality, orchestrating the companys philanthropic efforts. She is also responsible for overseeing the partnership between Thompson Hospitality and Compass Group, which involves operations at over 600 dining centers in 46 states and six countries. The partnership focuses on supporting diverse suppliers and fostering educational and career opportunities, notably through collaborations with Historically Black Colleges and Universities.
Ms. Thompson-Byas earned her Bachelor of Arts in English from the University of Virginias College of Arts and Sciences. She chairs the Compensation Committee of the Board of the Company. Ms. Thompson-Byass business and management experience, as well as her experience as a director of the Bank, qualify her to serve on our Board of Directors.
Paul W. Leavitt, Director
Mr. Paul W. Leavitt serves as a director of both the Company and the Bank. He has been a member of the Companys Board since December 2016 and joined the Banks board of directors in January 2018. His professional background is in journalism and communications. Prior to his retirement in 2008, Mr. Leavitt had a 21-year career with USA Today in various editorial capacities, including serving as the Washington News Editor. Since September 2001, Mr. Leavitt has served as a Trustee of Drake University and currently serves as Chair of the Endowment Investment Committee. He is also a Director and Vice President of Mill Reef Properties, Ltd. He received his undergraduate degree in journalism from Drake University and then studied Russian at Moscow State University.
Mr. Leavitt serves on the Audit and Compensation Committees of the Board of the Company. Mr. Leavitts communications and investment expertise and his experience as a director of the Company and of the Bank qualify him to serve on our Board of Directors.
130
Table of Contents
Director Independence
Our Board has affirmatively determined that each of , , , , , and qualify as independent directors under NYSE listing standards.
Our Charter will require that so long as our Class A common stock is listed for trading on a national securities exchange, a majority of directors will be independent in accordance with NYSE listing standards.
Family Relationships
Mr. Peter G. Fitzgerald, the Chairman of the Board of the Company, is the uncle of Mr. Thomas G. Fitzgerald, Jr., a director of the Company, and Mr. Andrew J. Fitzgerald, a director of the Company. Mr. Thomas G. Fitzgerald, Jr. and Mr. Andrew J. Fitzgerald are first cousins. Other than discussed above, there are no family relationships between or among any of our directors and executive officers.
Board Structure and Committees
Board Composition. The Board of Directors is comprised of 13 members and is currently chaired by Peter G. Fitzgerald. The Chairman of the Board is elected annually by the Board. The Boards core duties involve overseeing our operations, offering strategic guidance, counseling, and direction to management. Regular Board meetings are held quarterly, with additional sessions convened as necessary. Directors also convene monthly for meetings of the Board of Directors of the Bank.
The Board does not have a policy requiring the roles of the Chairman and Chief Executive Officer to be separate. Instead, it opts for the flexibility to decide the best structure based on our needs at any given time. This approach enables the Board to adapt and provide effective leadership under varying circumstances. Currently the roles of Chairman of the Board and Chief Executive Officer are distinct, with Peter G. Fitzgerald serving as Chairman of the Board and John J. Brough serving as Chief Executive Officer for both the Company and the Bank. This separation of roles allows for clear delineation of responsibilities at the top of the Company. Under our Bylaws, the Chairman will be an officer of the Company acting in a general executive capacity and, subject to the direction of the Board, will have general responsibility for the supervision of the policies and affairs of the Company and the effective administration of the Companys business. The Board does not have a lead independent director. To help ensure the independence of the Board, the independent directors of the Board occasionally meet without members of management at various times during the year. The Board does not have any immediate intention to modify this structure, valuing the stability and clarity it provides.
Committees. The Board of Directors established four standing committees to assist the Board in its responsibilities. These are the Audit Committee, the Compensation Committee, the Risk Committee and the Governance and Nominating Committee.
Additionally, the Board retains the authority to establish other committees as deemed necessary, in compliance with applicable laws, regulations, and our Bylaws and corporate governance guidelines. Each
committees current composition and specific responsibilities are detailed below. Committee members will continue to serve for the duration of their tenure on the Board, subject to resignation or reassignment as determined by the Board. The Board has adopted written charters detailing the scope and responsibilities of the Audit Committee, Compensation Committee, Risk Committee and Governance and Nominating Committee. These charters are accessible on our website. See Where You Can Find More Information.
Audit Committee. The Audit Committee is composed of Mr. Conover, Mr. Joseph Fitzgerald, Mr. Leavitt, and Mr. Martinelli, with Mr. Martinelli serving as the Chair. All members of the Audit Committee will be independent under the listing standards of the NYSE and meet the requirements of Rule 10A-3 of the Exchange Act. All members of the Audit Committee will, in the judgment of our board of directors, be financially literate, or become so within a reasonable period of time after appointment to the Audit Committee,
131
Table of Contents
and at least one member of the Audit Committee will have accounting or related financial management expertise. Additionally, one member will qualify as an audit committee financial expert under SEC rules. The Audit Committee is required to meet periodically as deemed necessary to carry out its responsibilities, and at least four times per year.
The role of the Audit Committee is to assist the Board in its oversight responsibilities relating to:
| | the integrity of our financial statements; |
| | our compliance with legal and regulatory requirements; |
| | our system of internal controls for finance, accounting, trust operations and legal and regulatory compliance; |
| | the independence and qualifications of our independent auditors; and |
| | the performance of our independent auditors and the internal audit function of the Company and its subsidiaries. |
The role of the Audit Committee is one of oversight. Our management is responsible for the preparation, presentation and integrity of our financial statements and for the effectiveness of internal control over financial reporting. Management and the internal audit function of the Company and its subsidiaries are responsible for maintaining appropriate accounting and financial reporting principles and policies and internal controls and procedures that provide for compliance with accounting standards and applicable laws and regulations. The independent auditors are responsible for planning and carrying out a proper audit of our annual financial statements and of our internal control over financial reporting at such time as we become subject to such requirement and other procedures.
In accordance with applicable banking law, the Audit Committee is comprised solely of outside directors who are independent of the Companys management. The Board has determined that all current members of the Audit Committee meet the FDICs criteria for outside directors.
Compensation Committee. The Compensation Committee is composed of Ms. Basha, Ms. Korsmo, Mr. Leavitt, and Ms. Thompson-Byas, with Ms. Thompson-Byas serving as the Chair. All members of the Compensation Committee will be independent under the applicable rules of each of the SEC and the NYSE. The Compensation Committee is scheduled to meet at least twice a year, or more frequently if necessary, to fulfill its duties.
The role of the Compensation Committee is to assist the Board in its responsibilities relating to:
| | the compensation and retention strategies for senior executive officers, specifically those holding the title of Executive Vice President and above; |
| | employee benefit programs of the Company; and |
| | our policies and strategies relating to its human capital management function. |
Risk Committee. The Risk Committee is composed of Mr. Conover, Mr. Joseph Fitzgerald, Mr. Núñez, and Mr. Martinelli, with Mr. Conover serving as the Chair. The Risk Committee convenes at least quarterly, or more frequently if necessary, to fulfill its duties.
The role of the Risk Committee is to assist the Board in its oversight responsibilities relating to:
| | our risk-management policies relating to our operations; |
| | financial and operational risks, including, without limitation, capital adequacy, compliance, credit, liquidity, market, operational, strategic, and asset risks and the control processes with respect to such risks; |
| | our risk appetite and tolerance (i.e., the level and type of risk the Company is able and willing to assume in its exposures and business activities, given its business objectives and obligations to stakeholders); and |
| | the performance of any other related tasks that the Board shall, from time to time, assign. |
132
Table of Contents
Risk assessment and risk management are the responsibility of the Companys management. The Risk Committees responsibility is one of oversight and review.
Governance and Nominating Committee. The Governance and Nominating Committee is comprised of Mr. Andrew J. Fitzgerald, Mr. Thomas G. Fitzgerald, Jr., and Ms. Korsmo, with Ms. Korsmo serving as the Chair. All members of our Governance and Nominating Committee will be independent under the listing standards of the NYSE. The Governance and Nominating Committee schedules meetings at least twice a year, or more frequently if required, to fulfill its duties.
The role of the Governance and Nominating Committee is to assist the Board in its responsibilities relating to:
| | corporate governance matters, including, among other things, the review and establishment of our policies and practices, such as our Code of Conduct for our directors, officers and employees and the procedures for the oversight and evaluation of the Board and management; |
| | the Board of the Company and its committees, including, among other things, the evaluation and recommendation of new Board committees, evaluating and recommending nominees to stand for election as directors at annual or special meetings of stockholders and the review and evaluation of our non-employee director compensation; and |
| | succession planning for senior executive officers of the Company. |
Board Oversight of Risk Management
The Board believes that effective risk management and control processes are critical to our safety and soundness, our ability to predict and manage the challenges that we face and, ultimately, our long-term corporate success. The Board, both directly and through its committees, is responsible for overseeing our risk management processes, with each of the committees assuming a different and important role in overseeing the management of the risks the Company faces.
The Risk Committee oversees our enterprise-wide risk management framework, our financial and operational risks (including, without limitation, capital adequacy, compliance, credit, liquidity, market, operational, strategic, and asset risks and the control processes with respect to such risks), and our risk appetite and tolerance. The Audit Committee is responsible for overseeing risks associated with the integrity of our financial statements, our compliance with legal and regulatory requirements, our system controls for finance, accounting, trust operations and legal and regulatory compliance. The Audit Committee also reviews, with our management, guidelines and policies governing the process by which our management and the relevant departments of the Company assess and manage our exposure to risk, and our major financial risk exposures and the steps our management has taken to monitor and control such exposures. The Compensation Committee oversees risks and exposures associated with our compensation policies, plans and practices, regarding both executive compensation and the compensation structure generally. The Governance and Nominating Committee oversees risks associated with the independence of our Board and potential conflicts of interest.
The role of the Board in our risk oversight is consistent with our leadership structure, with our management having responsibility for assessing and managing our risk exposure, and the Board and its committees providing oversight in connection with those efforts. We believe this division of risk management responsibilities presents a consistent, systemic and effective approach for identifying, managing and mitigating risks throughout our operations.
Code of Conduct and Ethics
Prior to the completion of this offering, we will amend our current Code of Conduct that applies to all of our directors, officers, and employees, including our principal executive officer, principal financial officer, principal accounting officer and controller, or persons performing similar functions. The Code of Conduct provides that
133
Table of Contents
our directors, officers, and employees are expected to uphold the highest level of personal and professional integrity in all activities and must comply with all applicable laws, regulations and Chain Bridge policies, including our Code of Conduct and, when amended, will be intended to comply with the NYSEs requirements for a code of conduct and qualify as a code of ethics as defined by the rules of the SEC. If we amend or grant any waiver from any provision of our Code of Conduct that applies to our directors or executive officers, we will publicly disclose such amendment or waiver as required by applicable law, including by filing a Current Report on Form 8-K, and intend to disclose such amendment or waiver on our website. Following the completion of this offering, the code of conduct and ethics will be available on our website. See Where You Can Find More Information.
134
Table of Contents
EXECUTIVE AND DIRECTOR COMPENSATION
Director Compensation
Non-employee directors of the Company are compensated through a combination of an annual stipend and per-meeting fees. No equity-based compensation is provided to any of the Directors. Directors who are also employees of the Company or the Bank do not receive compensation for their board service.
In 2023, the annual stipend for serving as a director of the Company was set at $5,000 and, for a director of the Bank, $10,000. Directors serving on both Boards receive only the Banks stipend, foregoing the stipend for serving on the Company Board. For each Company or Bank Board meeting attended in 2023 (whether in person or virtually), Directors were paid a fee of $1,200. Additionally, for committee meetings, Directors were paid a fee of $600 per meeting. To recognize their additional responsibilities, chairs of any Company or Bank Board committee were paid an extra annual stipend of $1,200, and non-employee secretaries of committees received $1,000 annually. Directors who served as members of the Loan Committee received an additional $50 for each request to approve a loan outside a scheduled meeting.
2023 Non-Employee Director Compensation Table
The following table provides the compensation paid to individuals serving as our non-employee Directors for the fiscal year ended December 31, 2023.
| Name |
Company Board Fees Earned or Paid in Cash ($) |
Bank Board Fees Earned or Paid in Cash ($) |
Non-equity Incentive Plan Compensation ($) |
Total ($) |
||||||||||||
| Andrew J. Fitzgerald |
$ | 14,600 | $ | 0 | $ | 0 | $ | 14,600 | ||||||||
| Joseph M. Fitzgerald |
11,400 | 32,100 | 0 | 43,500 | ||||||||||||
| Thomas G. Fitzgerald, Jr. |
16,400 | 0 | 0 | 16,400 | ||||||||||||
| Phillip F. Herrick(a) |
4,800 | 29,500 | 0 | 34,300 | ||||||||||||
| Thomas E. Jacobi(a)(b) |
0 | 217,775 | 42,244 | (c) | 260,019 | |||||||||||
| Michelle L. Korsmo |
10,200 | 20,800 | 0 | 31,000 | ||||||||||||
| Paul W. Leavitt |
6,000 | 29,700 | 0 | 35,700 | ||||||||||||
| Christopher Lippman(a) |
3,600 | 19,600 | 0 | 23,200 | ||||||||||||
| Jonathan E. Missner(a) |
9,000 | 22,000 | 0 | 31,000 | ||||||||||||
| Philip A. Odeen(a) |
11,000 | 0 | 0 | 11,000 | ||||||||||||
| Elizabeth M. OShea(a) |
8,200 | 24,750 | 0 | 32,950 | ||||||||||||
| Paul Shiffman(a) |
4,800 | 30,900 | 0 | 35,700 | ||||||||||||
| Benita Thompson-Byas |
5,400 | 26,800 | 0 | 32,200 | ||||||||||||
| W. Michael Wheat(d) |
5,400 | 20,100 | 0 | 25,500 | ||||||||||||
|
|
|
|
|
|
|
|
|
|||||||||
| Totals |
$ | 110,800 | $ | 474,025 | $ | 42,244 | $ | 627,069 | ||||||||
|
|
|
|
|
|
|
|
|
|||||||||
| (a) | On December 31, 2023, each of Philip F. Herrick, Christopher Lippman, Thomas E. Jacobi, Jonathan E. Missner, Philip A. Odeen, Elizabeth M. OShea, and Paul Shiffman retired as a director of the Company and the Bank. |
| (b) | The amounts paid to Mr. Jacobi reflect the compensation paid to him as an employee of the Bank. Mr. Jacobi received no additional compensation for his service as a director of the Company or the Bank. |
| (c) | The amount reported reflects (1) actual bonus of $24,765 earned by Mr. Jacobi as an employee of the Bank for fiscal year 2023 under the Incentive Compensation Plan, as discussed below in Narrative Disclosure to Summary Compensation Table, and which was paid in February 2024, reflecting the Companys performance throughout the calendar year in 2023, and (2) $17,479 earned in 2023 by Mr. Jacobi as an employee of the Bank under the Cash LTIP, as discussed further below. Payouts under the Incentive Compensation Plan for Mr. Jacobi are determined by multiplying Mr. Jacobis annual base salary by a |
135
Table of Contents
| fraction, the numerator of which is the number of points achieved based on the performance measurements for the applicable year multiplied by .75, and the denominator of which is 100. |
| (d) | On October 3, 2023, W. Michael Wheat retired as a director of the Company and the Bank. |
Executive Compensation
As an emerging growth company, the Company has opted to comply with the executive compensation disclosure rules applicable to smaller reporting companies, as such term is defined in the rules promulgated under the Securities Act. The compensation provided to our Named Executive Officers for the year ended December 31, 2023 is detailed in the 2023 Summary Compensation Table and accompanying footnotes and narrative that follow. Named Executive Officers refers to those executive officers of the Company determined and identified in accordance with applicable SEC requirements. For fiscal year 2023, our Named Executive Officers are:
Peter G. Fitzgerald, Chairman of the Board
John J. Brough, II, Chief Executive Officer
David M. Evinger, President
2023 Summary Compensation Table
| Name |
Year | Salary ($) |
Non-Equity Incentive Plan Compensation(1) ($) |
All Other Compensation ($)(2) |
Total ($) |
|||||||||||||||
| Peter G. Fitzgerald Chairman of the Board |
2023 | $ | 294,008 | $ | 44,579 | $ | 15,040 | $ | 353,627 | |||||||||||
| John J. Brough, II Chief Executive Officer |
2023 | $ | 355,876 | $ | 96,864 | $ | 19,010 | $ | 471,750 | |||||||||||
| David M. Evinger President |
2023 | $ | 341,663 | $ | 88,352 | $ | 16,500 | $ | 446,515 | |||||||||||
| (1) | The amounts reported reflect (1) actual bonuses earned for fiscal year 2023 under the Incentive Compensation Plan, as discussed further below in Narrative Disclosure to Summary Compensation Table, that were paid in February 2024, reflecting the Companys performance throughout the calendar year of 2023 ($44,579 for Mr. Fitzgerald, $53,960 for Mr. Brough and $51,805 for Mr. Evinger) and (2) amounts earned in 2023 under the Cash LTIP, as discussed further below ($42,904 for Mr. Brough and $36,547 for Mr. Evinger). |
| (2) | The amounts reported reflect (1) for Mr. Fitzgerald, $15,040 paid by the Bank in the form of matching contributions under its 401(k) plan, as discussed further below in Narrative Disclosure to Summary Compensation Table; (2) for Mr. Brough, (i) $16,500 paid by the Bank in the form of matching contributions under its 401(k) plan, (ii) $2,310 paid by the Bank for Mr. Broughs life insurance policy premium and (iii) $200 paid by the Bank as an automobile allowance; and (3) for Mr. Evinger, $16,500 paid by the Bank in the form of matching contributions under its 401(k) plan in 2023. |
Outstanding Equity Awards at Fiscal Year-Ended December 31, 2023
None of our Named Executive Officers held any equity awards as of December 31, 2023.
Narrative Disclosure to Summary Compensation Table
General. The Compensation Committee holds the view that the annual total compensation package for Named Executive Officers which encompasses base salary, short-term incentives, and long-term incentives should be closely aligned with the Companys financial and risk management performance and the value
136
Table of Contents
delivered to stockholders. Additionally, compensation levels are intended to be generally competitive and consistent when benchmarked against the performance of the Companys industry peers. The Company currently does not have employment agreements or other individual contracts in place with any of the Named Executive Officers.
Salary. Annual base salaries for Named Executive Officers are determined with consideration to each executives level of experience, individual performance over the preceding year, and the financial and risk management outcomes of the Company during that same period. The Compensation Committee further evaluates salary data from comparable positions within the banking and finance industry to ensure that the base salary levels are competitive. This approach is designed to attract and retain top talent capable of contributing significantly towards achieving the Companys strategic goals. As of December 31, 2023, the base salaries for Mr. Fitzgerald, Mr. Brough and Mr. Evinger were $294,008, $355,876, and $341,663, respectively.
Short-Term Cash Incentive Compensation. The Company maintains a short-term cash incentive compensation plan (the Incentive Compensation Plan) for eligible employees of the Bank, including the Named Executive Officers. The Incentive Compensation Plan rewards participants based on the performance of the Company as a whole, focusing on both financial results and risk management.
Bonuses are earned under the Incentive Compensation Plan based on, for fiscal year 2023, a total of up to 24 points awarded for the achievement of two performance components: financial performance and risk management. The 2023 financial performance component (up to 14 available points) is based upon the Companys annual return on average equity and growth in average assets. The 2023 risk management performance component (up to 10 points) is based upon a number of compliance, safety and soundness, internal audit, and similar factors. In the event of certain risk failures, no amounts are earned under the Incentive Compensation Plan regardless of the number of points earned. The Board has the final authority to approve incentive payments under the Incentive Compensation Plan.
Payouts under the Incentive Compensation Plan for each Named Executive Officer are determined by multiplying the Named Executive Officers annual base salary by a fraction, the numerator of which is the number of points achieved based on the performance measurements for the applicable year and the denominator of which is 100.
In 2023, a total 15.16 points were achieved under the Incentive Compensation Plan, comprising 8.15 points earned under the financial performance component and 7.01 points earned under the risk management component, resulting in the following annual cash bonuses becoming payable to Named Executive Officers: Mr. Fitzgerald: $44,579; Mr. Brough: $53,960; and Mr. Evinger: $51,805; these amounts were paid in February 2024.
The Incentive Compensation Plan includes a claw-back provision allowing the Company to recoup incentive payments from senior executives under circumstances that negatively affect the Companys financial health, such as financial statement restatements or risk management failures. This provision is in place to promote responsible growth, prudent risk-taking, and a culture of compliance.
Long-Term Cash Incentive Compensation. The Company administers a long-term cash incentive plan (the Cash LTIP) to incentivize and retain key employees of the Bank and encourage participants to contribute to the long-term increase of the Companys retained earnings. Mr. Brough and Mr. Evinger participate in the Cash LTIP. Mr. Fitzgerald does not hold any awards under the Cash LTIP.
Under the Cash LTIP, awards are calculated based on the growth of the Companys retained earnings per share over a seven-year vesting period. Following the end of the vesting period, the payouts of each award under the Cash LTIP is equal to (i) the retained earnings of the Company on the seventh anniversary of the last day of the plan year with respect to which the award was granted, plus (ii) all cash dividends declared and paid by the
137
Table of Contents
Company on or after the last day of the year for which the award was granted, up to and including such seventh anniversary date, minus (iii) the Companys retained earnings as of the last day of the year with respect to which the award was granted, divided by the number of shares of common stock of the Company outstanding on such seventh anniversary date. The seven-year period is designed to promote long-term retention of participants and to deter engagement in short-term, high-risk activities that may harm the Companys long-term interests.
Under the Cash LTIP, in the event of any increase or decrease in retained earnings of the Company or the number of shares of Company common stock outstanding that occurs by reason of a corporate event (including, but not limited to, a stock issuance, stock dividend, stock split, reverse stock split, recapitalization, repurchase of treasury shares, merger, consolidation, combination, exchange of shares, infusion of capital, or other similar corporate change), the Compensation Committee will equitably adjust the number and value of Cash LTIP awards then-outstanding.
The Compensation Committee maintains the authority and discretion to determine eligibility for participation in the Cash LTIP and to allocate awards thereunder. The Board holds the final authority to approve any awards.
For fiscal year 2023, the amounts earned by the Named Executive Officers under the Cash LTIP were as follows, which represent the vesting and distribution of awards granted in 2016: Mr. Brough: $42,904; and Mr. Evinger: $36,547.
For fiscal year 2023, the Named Executive Officers were granted the following awards under the Cash LTIP: Mr. Brough: 46 awards; and Mr. Evinger: 46 awards.
Stock Awards; Option Awards. The Company currently does not grant any type of equity compensation to Named Executive Officers or its other employees.
Nonqualified Deferred Compensation Plan. The Company does not provide a nonqualified deferred compensation plan for the Named Executive Officers or other employees.
401(k) Plan. The Bank offers a 401(k) tax-qualified defined contribution plan aimed at providing retirement benefits to all eligible full-time employees, including the Named Executive Officers, facilitating tax-deferred savings for their retirement years. As a safe harbor 401(k) Plan, the Bank matches 100% of employee contributions up to 4% of an employees pay, and 50% on contributions between 4% and 6% of an employees pay. The Banks current matching contribution rate is 5%. Employees must make contributions of at least 6% to qualify for matching contributions and vest in such contributions after two years of service.
Other Benefits. Our Named Executive Officers are eligible to participate in the Banks health and welfare programs, including health, dental, group term life and long-term disability insurance, in each case to the same extent and on the same basis as our other employees.
Potential Payments upon Termination or a Change of Control
Cash Severance. As stated above, the Company is not party to any employment agreements with the Named Executive Officers, nor are there any severance plans, programs or policies in place.
Annual Bonuses under the Incentive Compensation Plan
Under the Incentive Compensation Plan, upon a termination of employment due to retirement after attainment of age 65, death, or total disability, a Named Executive Officer will earn a pro-rata annual bonus for the year of termination, based on the actual level of performance. On any other termination of employment, no bonus will be earned.
138
Table of Contents
Under the Incentive Compensation Plan, if the Company or the Bank is party to a merger or consolidation in which it is not the surviving corporation, the Incentive Compensation Plan will be frozen and bonuses will be determined thereunder as of the date of such merger or consolidation based on results through that date.
Awards under the Cash LTIP
Under the Cash LTIP, upon a termination of employment due to retirement, after attainment of age 65 and having three years of employment with the Bank, death, or total disability, a Named Executive Officer will vest in any outstanding, unvested awards under the Cash LTIP, which will be paid within 74 days following termination of employment (for death or total disability) or following the end of the regular vesting period (for retirement).
Under the Cash LTIP, a Named Executive Officer will become fully vested in all awards under the Plan if on or prior to the 74 days following a change of control, (1) the employment of the Named Executive Officer is terminated without cause or (2) the Named Executive Officers base salary is reduced from the level immediately prior to the change of control.
Clawback Policy
We intend to timely adopt an incentive compensation clawback policy that complies with the listing standards of the NYSE.
139
Table of Contents
SECURITY OWNERSHIP OF CERTAIN BENEFICIAL OWNERS AND MANAGEMENT
This section sets forth information, as of the date of this prospectus, regarding the beneficial ownership of our common stock by our principal stockholders, including members of the Fitzgerald Family, executive officers, and directors.
A person is deemed to be a beneficial owner of a share of common stock if such person has or shares voting power, which includes the power to vote or to direct the voting of such share, or investment power, which includes the power to dispose of or to direct the disposition of such share. A person is also deemed to be a beneficial owner of any shares of which that person has a right to acquire beneficial ownership within 60 days. Under this definition, more than one person may be deemed to be a beneficial owner of the same shares.
The percentage ownership set forth below immediately prior to the completion of this offering is based on 4,568,920 shares of common stock outstanding as of March 31, 2024 (giving effect to the reclassification of each outstanding share of our old common stock into 170 shares of Class B common stock prior to the completion of this offering) and held by approximately 275 stockholders of record. Applicable percentage ownership after the offering assumes (1) no conversions of shares of our Class B common stock into shares of our Class A common stock and (2) the issuance of shares of Class A common stock in this offering (or shares if the underwriters elect to exercise in full their option to purchase additional shares from us).
Except as otherwise indicated, the address for each stockholder listed below is c/o Chain Bridge Bancorp, Inc., 1445-A Laughlin Avenue, McLean, Virginia 22101.
Beneficial Ownership of Principal Stockholders, Executive Officers and Directors
The following table sets forth information, as of the date of this prospectus, regarding the beneficial ownership of our common stock immediately prior to the completion of this offering by:
| | any person known by us to own beneficially more than 5% of any class of our outstanding common stock, including members of the Fitzgerald Family; |
| | each of our executive officers; |
| | each of our directors; and |
| | all of our directors and executive officers as a group. |
140
Table of Contents
|
Prior to This Offering and the Share Repurchase |
After This Offering Assuming Underwriters Option is Not Exercised |
After This Offering Assuming Underwriters Option is Exercised in Full |
||||||||||||||||||||||||||||||||||||||
| Name |
Title of Stock Class |
Beneficial Ownership |
Percentage | Percent of Voting Power** |
Beneficial Ownership |
Percentage | Percent of Total Voting Power** |
Beneficial Ownership |
Percentage | Percent of Total Voting Power** |
||||||||||||||||||||||||||||||
| Greater than 5% Stockholders |
||||||||||||||||||||||||||||||||||||||||
| Peter G. Fitzgerald(1) |
|
Class A common stock |
|
| | 22.50 | % | | | |||||||||||||||||||||||||||||||
| |
Class B common stock |
|
1,027,820 | 22.50 | % | |||||||||||||||||||||||||||||||||||
| Gerald F. Fitzgerald(2) |
|
Class A common stock |
|
| | 11.72 | % | | | | | |||||||||||||||||||||||||||||
| |
Class B common stock |
|
535,670 |
|
11.72 |
% |
||||||||||||||||||||||||||||||||||
| James G. Fitzgerald(3) |
|
Class A common stock |
|
| | 10.14 | % | | | | | |||||||||||||||||||||||||||||
| |
Class B common stock |
|
463,080 | 10.14 | % | |||||||||||||||||||||||||||||||||||
| Julie Fitzgerald Schauer(4) |
|
Class A common stock |
|
| | 9.55 | % | | | | | |||||||||||||||||||||||||||||
| |
Class B common stock |
|
436,220 | 9.55 | % | |||||||||||||||||||||||||||||||||||
| Thomas G. Fitzgerald(5) |
|
Class A common stock |
|
| | 8.13 | % | | | | | |||||||||||||||||||||||||||||
| |
Class B common stock |
|
371,620 | 8.13 | % | |||||||||||||||||||||||||||||||||||
| Directors and Executive Officers |
||||||||||||||||||||||||||||||||||||||||
| Peter G. Fitzgerald(1) |
|
Class A common stock |
|
| | 22.50 | % | | | |||||||||||||||||||||||||||||||
| |
Class B common stock |
|
1,027,820 | 22.50 | % | |||||||||||||||||||||||||||||||||||
| Thomas G. Fitzgerald, Jr.(6) |
|
Class A common stock |
|
| | 4.67 | % | | | |||||||||||||||||||||||||||||||
| |
Class B common stock |
|
213,350 | 4.67 | % | |||||||||||||||||||||||||||||||||||
| Andrew J. Fitzgerald(7) |
|
Class A common stock |
|
| | 3.83 | % | | | |||||||||||||||||||||||||||||||
| |
Class B common stock |
|
175,100 | 3.83 | % | |||||||||||||||||||||||||||||||||||
| Paul W. Leavitt(8) |
|
Class A common stock |
|
| | 1.73 | % | | | |||||||||||||||||||||||||||||||
| |
Class B common stock |
|
79,050 | 1.73 | % | |||||||||||||||||||||||||||||||||||
| John J. Brough, II(9) |
|
Class A common stock |
|
| | 1.54 | % | | | |||||||||||||||||||||||||||||||
| |
Class B common stock |
|
70,380 | 1.54 | % | |||||||||||||||||||||||||||||||||||
| David M. Evinger(10) |
|
Class A common stock |
|
| | 1.18 | % | | | |||||||||||||||||||||||||||||||
| |
Class B common stock |
|
53,720 | 1.18 | % | |||||||||||||||||||||||||||||||||||
| Joseph M. Fitzgerald(11) |
|
Class A common stock |
|
| | * | ** | | | |||||||||||||||||||||||||||||||
| |
Class B common stock |
|
27,880 | * | ** | |||||||||||||||||||||||||||||||||||
| Benita Thompson-Byas |
|
Class A common stock |
|
| | * | ** | | | |||||||||||||||||||||||||||||||
| |
Class B common stock |
|
18,020 | * | ** | |||||||||||||||||||||||||||||||||||
| Joanna R. Williamson |
|
Class A common stock |
|
| | * | ** | |||||||||||||||||||||||||||||||||
| |
Class B common stock |
|
5,950 | * | ** | |||||||||||||||||||||||||||||||||||
141
Table of Contents
|
Prior to This Offering and the Share Repurchase |
After This Offering Assuming Underwriters Option is Not Exercised |
After This Offering Assuming Underwriters Option is Exercised in Full |
||||||||||||||||||||||||||||||||||||
| Name |
Title of Stock Class |
Beneficial Ownership |
Percentage | Percent of Voting Power** |
Beneficial Ownership |
Percentage | Percent of Total Voting Power** |
Beneficial Ownership |
Percentage | Percent of Total Voting Power** |
||||||||||||||||||||||||||||
| Michelle L. Korsmo |
Class A common stock |
| | * | ** | | | |||||||||||||||||||||||||||||||
| Class B common stock |
3,400 | * | ** | |||||||||||||||||||||||||||||||||||
| Leigh-Alexandra Basha |
Class A common stock |
| | * | ** | | | |||||||||||||||||||||||||||||||
| Class B common stock |
170 | * | ** | |||||||||||||||||||||||||||||||||||
| Michael J. Conover |
Class A common stock |
| | * | ** | | | |||||||||||||||||||||||||||||||
| Class B common stock |
170 | * | ** | |||||||||||||||||||||||||||||||||||
| Mark Martinelli |
Class A common stock |
| | * | ** | | | |||||||||||||||||||||||||||||||
| Class B common stock |
170 | * | ** | |||||||||||||||||||||||||||||||||||
| Yonesy F. Núñez |
Class A common stock |
| | * | ** | | | |||||||||||||||||||||||||||||||
| Class B common stock |
170 | * | ** | |||||||||||||||||||||||||||||||||||
| Rachel G. Miller |
Class A common stock |
| | | ||||||||||||||||||||||||||||||||||
| Class B common stock |
| | ||||||||||||||||||||||||||||||||||||
| All Directors and Executive Officers as a group (15 persons): |
Class A common stock |
| | 36.67 | % | | | |||||||||||||||||||||||||||||||
| Class B common stock |
1,675,350 | 36.67 | % | |||||||||||||||||||||||||||||||||||
| * | Shares of Class B common stock are convertible at any time by the holder into shares of Class A common stock on a share-for-share basis. |
| ** | Percent of total voting power represents voting power with respect to all shares of our Class A common stock and Class B common stock, as a single class. The holders of our Class B common stock are entitled to 10 votes per share and holders of our Class A common stock are entitled to one vote per share. See Description of Capital Stock Voting Rights for more information about the voting rights of our Class A common stock and Class B common stock. |
| *** | Represents less than 1%. |
| 1) | Includes 229,500 shares of Class B common stock held directly by Peter G. Fitzgerald and 68,000 shares held by his spouse. Also includes 730,320 shares held within trusts for which he serves as trustee, co-trustee, or adviser, and for which he may be deemed to have voting or investment power. These shares consist of 444,550 shares held by the Everglades Trust (adviser), 103,190 shares held by the JBF 2013 Trust (trustee), 103,020 shares held by the Fitzgerald 2002 Special Trust (co-trustee), and 79,560 shares held by the GFF Family Trust (co-trustee). |
| 2) | One West Northwest Highway, Palatine, Illinois 60067. Includes 211,140 shares of Class B common stock held by JEM Management, L.P., a family limited partnership of which Gerald F. Fitzgerald is the managing general partner and for which he may be deemed to have voting or investment power and 141,950 shares held by SC Investments II, L.P., a family limited partnership of which he is the general partner and for which he may be deemed to have voting or investment power. Also includes 606 and 468 shares for which he may be deemed to have voting or investment power held, respectively, by the Fitzgerald 2002 Special Trust and the GFF Family Trust for which he serves as a co-trustee and for which he may be deemed have voting or investment power. |
| 3) | 1629 W. Colonial Parkway, Inverness, IL 60067. Includes 59,500 shares of Class B common stock held directly by James G. Fitzgerald. Also includes 17,000 shares of Class B common stock held by Otis Road |
142
Table of Contents
| Investments, L.P., a family limited partnership for which James G. Fitzgerald is a co-manager of the limited liability company managing general partner and for which he may be deemed to have voting or investment power. Also includes 51,000 shares of Class B common stock held by Anhinga Trust for which he serves as a trustee and for which he may be deemed to have voting or investment power. Also includes 103,020 and 79,560 shares of Class B common stock held, respectively, by the Fitzgerald 2002 Special Trust and the GFF Family Trust for which James G. Fitzgerald serves as a co-trustee and for which he may be deemed to have voting or investment power. |
| 4) | One West Northwest Highway, Palatine, Illinois 60067. Includes 436,220 shares of Class B common stock held within the Julie Fitzgerald Schauer 1994 Trust for which Julie Fitzgerald Schauer serves as the trustee and is the sole beneficiary. |
| 5) | 1629 W. Colonial Parkway, Inverness, IL 60067. Includes 189,040 shares of Class B common stock held by TGF Investments, L.P., a family limited partnership for which Thomas G. Fitzgerald is a co-manager of the limited liability company managing general partner and for which he may be deemed to have voting or investment power. Also includes 103,020 and 79,560 shares of Class B common stock held, respectively, within the Fitzgerald 2002 Special Trust and the GFF Family Trust for which he serves as a co-trustee and for which he may be deemed to have voting or investment power. |
| 6) | Includes 7,310 shares of Class B common stock held directly by Thomas G. Fitzgerald, Jr. and 1,700 shares of Class B common stock jointly owned by Thomas G. Fitzgerald Jr. and his spouse. Also includes 189,040 shares of Class B common stock held by TGF Investments, L.P., a family limited partnership for which Thomas G. Fitzgerald, Jr. is a co-manager of the limited liability company managing general partner and for which he may be deemed to have voting or investment power. |
| 7) | Includes 5,100 shares of Class B common stock held within the Andrew J. Fitzgerald 2011 Trust, for which Andrew J. Fitzgerald serves as the trustee and is the sole beneficiary. Also includes 17,000 shares of Class B common stock held by Otis Road Investments, L.P., a family limited partnership for which Andrew J. Fitzgerald is a managing general partner and a co-manager of the limited liability company managing general partner and for which he may be deemed to have voting or investment power. |
| 8) | Includes 70,550 shares of Class B common stock held directly by Paul W. Leavitt and 8,500 shares of Class B common stock held by his spouse. |
| 9) | Includes 14,280 shares of Class B common stock held directly by John J. Brough, II and 56,100 shares of Class B common stock co-owned with his spouse. |
| 10) | Includes 15,130 shares of Class B common stock held directly by David M. Evinger, 29,750 shares of Class B common stock held jointly with his spouse, 8,160 shares of Class B common stock held by his spouse, and 510 shares of Class B common stock co-owned with his adult children. |
| 11) | Joseph M. Fitzgerald is not a member of the Fitzgerald Family. |
143
Table of Contents
CERTAIN RELATIONSHIPS AND OTHER RELATED PARTY TRANSACTIONS
In addition to the compensation arrangements with directors and executive officers described in Executive and Director Compensation above, this section describes each transaction since January 1, 2021, and each proposed transaction, in which:
| | we have been or are to be a participant; |
| | the amount involved exceeds or will exceed $120,000; and |
| | any of our directors, executive officers or principal stockholders, or any immediate family member of or person sharing the household with any of these individuals (other than tenants or employees) (collectively, principal stockholders), had or will have a direct or indirect material interest. |
Relationship with the Fitzgerald Family
Our Chairman, Peter G. Fitzgerald, is the uncle of our directors, Thomas G. Fitzgerald and Andrew J. Fitzgerald. In addition, Peter G. Fitzgeralds siblings, Gerald F. Fitzgerald, James G. Fitzgerald, Julie Fitzgerald Schauer and Thomas G. Fitzgerald, are greater than 5% beneficial owners of our common stock. Although the members of the Fitzgerald Family, in the aggregate, beneficially own a majority of our outstanding common stock and are expected to own a majority of the combined voting power of our common stock following the completion of this offering, no member is currently party to any voting agreement or other arrangement or understanding regarding the voting of our shares. Certain family members may share beneficial ownership with respect to certain family trusts and other vehicles as set forth under Security Ownership of Certain Beneficial Owners and Management.
Ordinary Banking Relationships
Certain of our directors, executive officers, and principal stockholders along with their immediate family members and affiliates, are clients of, or have had transactions with, the Company or the Bank in the ordinary course of business. These transactions include deposits, loans, and other financial services related transactions. These transactions are made in the ordinary course of business, are made available on terms, including interest rates and collateral, consistent with those available to the general public under similar conditions at the time of the transactions, and do not present more than the normal risk of collectability or any unfavorable features. As of the date of this prospectus, none of these loans were categorized as nonaccrual, past due, restructured or potential problem loans.
Our directors, executive officers, and principal stockholders, along with their immediate family members and their affiliated organizations, and affiliates, had credit outstanding with the Company and the Bank of $8,186,462 and $17,007,875 as of March 31, 2024 and 2023, respectively. We expect to continue to enter into transactions in the ordinary course of business on similar terms with our directors and executive officers, as well as with their immediate family members and affiliates.
Statement of Policy Regarding Transactions with Related Persons
Transactions among the Company and the Bank are subject to a formal written policy and certain regulatory requirements and restrictions. These requirements and restrictions include Sections 23A and 23B of the Federal Reserve Act (which govern certain transactions between banks and their affiliates) and the Federal Reserves Regulation O (which governs certain loans by banks to the executive officers, directors, and principal stockholders). Under our Code of Conduct, all individuals associated with the Company and the Bank, including directors, officers, and employees, must promptly notify the Chief Executive Officer of the Company or the Bank, the Governance and Nominating Committee of the Company or the Governance Committee of the Bank, as applicable, of any business relationship or proposed transaction the Company or the Bank may have with any entity in which the individual or a related party has a direct or indirect interest or may derive a benefit. This
144
Table of Contents
requirement generally excludes any interest that exists solely as a result of ownership of less than 1% of any class of the outstanding equity securities of a publicly traded bank or bank holding company. The Banks Loan & Credit Policy governs loans to the Banks officers and employees.
In addition, our Board will adopt a written policy governing the review, approval or ratification of transactions between the Company or the Bank and any related party in which the amount involved since the beginning of the last completed fiscal year will or may be expected to exceed $120,000 and in which one of our executive officers, directors, director nominees or stockholders beneficially owning more than 5% of any class of our outstanding common stock (or their immediate family members) has a direct or indirect material interest. The policy will call for the related person transactions to be reviewed and, if deemed appropriate, approved or ratified by the Audit Committee. In determining whether or not to approve or ratify a related person transaction, the Audit Committee will take into account, among other relevant factors, whether the related person transaction is in our best interests, whether it involves a conflict of interest, and the commercial reasonableness of the transaction. In the event a member of the Audit Committee is not disinterested with respect to the related person transaction under review, that member may not participate in the review, approval or ratification of that related person transaction.
Certain decisions and transactions are not subject to the related party transaction approval policy, including: (i) decisions on compensation or benefits relating to directors or executive officers; (ii) indebtedness to us in the ordinary course of business, on substantially the same terms, including interest rate and collateral, as those prevailing at the time for comparable loans with persons not related to us, and (iii) not presenting more than the normal risk of collectability or other unfavorable features.
Indemnification of Directors and Officers
Our Bylaws will provide that we must indemnify our directors and officers to the fullest extent authorized by the DGCL; provided, however, that no such indemnification shall be required with respect to any settlement or other non-adjudicated disposition of any threatened or pending action or proceeding unless we have given our prior consent to such settlement or other disposition. In addition, our Charter will provide that our directors and officers will not be liable for any breach of fiduciary duty to the fullest extent permitted by the DGCL.
There is no pending litigation or proceeding naming any of our directors or officers to which indemnification is being sought, and we are not aware of any pending or threatened litigation that may result in claims for indemnification by any director or officer.
145
Table of Contents
The following summary describes our capital stock and the material provisions of our Charter and Bylaws, which will become effective immediately prior to the completion of this offering, and of the DGCL. Because the following is only a summary, it does not contain all of the information that may be important to you. For a complete description, you should refer to our Charter and Bylaws, copies of which have been filed as exhibits to the registration statement of which this prospectus is a part.
General
Upon the filing and effectiveness of our Charter and the completion of this offering, our authorized capital stock will consist of:
| | 20,000,000 shares of Class A common stock, $0.01 par value per share; |
| | 10,000,000 shares of Class B common stock, $0.01 par value per share; and |
| | 10,000,000 shares of undesignated preferred stock, no par value per share. |
Common Stock
We will have two classes of authorized common stock: Class A common stock and Class B common stock. The rights of holders of Class A common stock and Class B common stock will be identical, other than as set forth below.
Voting Rights
Each holder of our Class A common stock is entitled to one vote per share and each holder of our Class B common stock is entitled to 10 votes per share. The holders of our Class A common stock and Class B common stock will generally vote together as a single class on all matters submitted to a vote of our stockholders, unless otherwise required by our Charter or Delaware law.
Our Charter will require a vote other than a vote of the holders of our Class A common stock and Class B common stock voting together as a single class in the following circumstances:
| | any merger (including any merger effected pursuant to Section 253 of the DGCL or Section 251(h) of the DGCL), consolidation or business combination of the Company with or into another entity, whether or not the Company is the surviving entity, in which any Founder (as defined in our Charter), or an affiliate thereof, is part of the purchaser group or is otherwise a counterparty to such merger, consolidation or business combination, will require the affirmative vote of the holders of a majority of the then-outstanding shares of Class A common stock, voting as a separate class; |
| | any amendment to our Charter that would adversely affect the rights or preferences of the Class A common stock or the Class B common stock will require the affirmative vote of the holders of a majority of the outstanding shares of the adversely affected class, voting together as a separate class; and |
| | any amendment to our Charter that would disproportionately benefit the Founders relative to stockholders other than the Founders will require the affirmative vote of the holders of a majority of voting power of the outstanding shares held by stockholders other than the Founders, voting together as a separate class. |
In addition, Delaware law could require holders of our Class A common stock or Class B common stock to vote separately as a single class in the following circumstances:
| | if we were to seek to amend our Charter to increase or decrease the par value of a class of our capital stock, then that class would be required to vote separately to approve the proposed amendment; and |
146
Table of Contents
| | if we were to seek to amend our Charter in a manner that alters or changes the powers, preferences, or special rights of a class of our capital stock in a manner that affected its holders adversely, then that class would be required to vote separately to approve the proposed amendment. |
Our Charter will not provide for cumulative voting for the election of directors.
Conversion Rights
Each outstanding share of Class B common stock will be convertible at any time at the option of the holder into one share of Class A common stock. In addition, each share of Class B common stock will convert automatically into one share of Class A common stock upon any transfer, whether or not for value, which occurs after the completion of this offering, except for certain exempt transfers described in our Charter. Once converted into Class A common stock, the Class B common stock will be retired and will not be reissued.
All of the outstanding shares of Class B common stock will convert automatically into shares of Class A common stock upon the first date on which the aggregate number of outstanding shares of Class B common stock ceases to represent at least 10% of the aggregate number of then-outstanding shares of our common stock. Once converted into Class A common stock, the Class B common stock will be retired and will not be reissued.
Economic Rights
Dividends or Property Distributions. Subject to applicable law and the rights, if any, of the holders of any outstanding series of preferred stock, the holders of our Class A common stock and Class B common stock will be entitled to receive such dividends and other distributions, in cash, stock of any entity or property of the company, when and as may be declared thereon by our Board from time to time out of assets or funds of the Company legally available therefor, and will be treated equally, identically and ratably on a per share basis in all such dividends and other distributions; except that, in the event a distribution is paid in the form of shares of Class A common stock or Class B common stock (or rights to acquire such shares), then holders of Class A common stock will receive shares of Class A common stock (or rights to acquire such shares, as the case may be), and holders of Class B common stock will receive shares of Class B common stock (or rights to acquire such shares, as the case may be), with holders of shares of Class A common stock and Class B common stock receiving, on a per share basis, an identical number of shares of Class A common stock or Class B common stock (or rights to acquire such shares, as the case may be).
Liquidation, Dissolution or Winding Up. In the event of our liquidation, dissolution or winding up (whether voluntary or involuntary), the holders of Class A common stock and Class B common stock will be treated equally, identically and ratably, on a per share basis, with respect to amounts paid upon such liquidation, dissolution or winding up.
Mergers, Consolidations, Conversions or Business Combinations. In any merger, consolidation, conversion or business combination of the Company with or into another entity, whether or not the Company is the surviving entity, the shares of the Class A common stock and the Class B common stock will be treated equally, identically and ratably, on a per share basis, with respect to any consideration into which such shares are converted or any consideration paid or otherwise distributed to stockholders of the Company except that, in any such merger, consolidation, conversion or business combination in which shares of capital stock are distributed, such shares may differ as to voting rights to the extent and only to the extent that the voting rights of the Class A common stock and Class B common stock differ as provided in the Charter.
Subdivisions, Combinations or Reclassifications. If we subdivide or combine in any manner outstanding shares of Class A common stock or Class B common stock, then the outstanding shares of the other class will be subdivided, combined, reclassified or otherwise changed in a manner that maintains the same proportionate equity ownership and voting power between the holders of the outstanding shares of Class A common stock and Class B common stock on the record date for such subdivision, combination, reclassification or similar change.
147
Table of Contents
No Preemptive or Similar Rights
Holders of shares of our common stock will not have preemptive, subscription, or redemption rights. There will be no redemption or sinking fund provisions applicable to our common stock.
Fully Paid and Non-assessable
All of our outstanding shares of Class A common stock and Class B common stock will be fully paid and non-assessable.
Preferred Stock
Under the terms of our Charter that will become effective prior to the completion of this offering, our Board is authorized to direct us to issue shares of preferred stock in one or more series without stockholder approval, unless otherwise required by our Charter, by law or by any stock exchange. Our Board has the discretion to determine the rights, preferences, privileges, and restrictions, including voting rights, dividend rights, conversion rights, redemption privileges, and liquidation preferences, of each series of preferred stock, except that the approval by a duly authorized committee of our Board consisting solely of independent and disinterested directors will be required for the issuance of any shares of preferred stock convertible into, or exchangeable for, shares of Class B common stock (or any other securities convertible into, or exchangeable for, Class B common stock).
Our Board may authorize the issuance of preferred stock with voting or conversion rights that could adversely affect the voting power or other rights of the holders of Class A common stock and Class B common stock. The issuance of preferred stock, while providing flexibility in connection with possible acquisitions and other corporate purposes, could, among other things, have the effect of delaying, deferring, or preventing a change in control of our company that may otherwise benefit holders of our Class A common stock and Class B common stock and may adversely affect the market price of the Class A common stock and the voting and other rights of the holders of Class A common stock and Class B common stock. We have no current plans to issue any shares of preferred stock.
Anti-Takeover Provisions
Certain provisions of Delaware law, our Charter and our Bylaws, which will become effective prior to the completion of this offering and which are summarized below, may have the effect of delaying, deferring or discouraging another person from acquiring control of us. They are also designed, in part, to encourage persons seeking to acquire control of us to negotiate first with our Board. We believe that the benefits of increased protection of our potential ability to negotiate with an unfriendly or unsolicited acquirer outweigh the disadvantages of discouraging a proposal to acquire us because negotiation of these proposals could result in an improvement of their terms.
Delaware Law
We are subject to Section 203 of the DGCL, which prohibits a Delaware corporation from engaging in any business combination with any interested stockholder for a period of three years after the date that such stockholder became an interested stockholder, with the following exceptions:
| | the business combination or transaction which resulted in the stockholder becoming an interested stockholder was approved by the Board prior to the time that the stockholder became an interested stockholder; |
| | upon consummation of the transaction which resulted in the stockholder becoming an interested stockholder, the interested stockholder owned at least 85% of the voting stock of the corporation |
148
Table of Contents
| outstanding at the time the transaction commenced, excluding shares owned by directors who are also officers of the corporation and shares owned by employee stock plans in which employee participants do not have the right to determine confidentially whether shares held subject to the plan will be tendered in a tender or exchange offer; or |
| | at or subsequent to the time the stockholder became an interested stockholder, the business combination was approved by the Board and authorized at an annual or special meeting of the stockholders, and not by written consent, by the affirmative vote of at least 66 2/3% of the outstanding voting stock which is not owned by the interested stockholder. |
In general, Section 203 defines a business combination to include mergers, asset sales, and other transactions resulting in financial benefit to a stockholder and an interested stockholder as a person who, together with affiliates and associates, owns, or within three years did own, 15% or more of the corporations outstanding voting stock. These provisions may have the effect of delaying, deferring, or preventing changes in control of our company.
Federal Banking Law
The ability of a third party to acquire our stock is also limited under applicable U.S. banking laws, including regulatory approval requirements. The BHC Act requires any bank holding company to obtain the approval of the Federal Reserve before acquiring, directly or indirectly, more than five percent (5%) of the voting power of our outstanding common stock. Any company (as defined in the BHC Act) other than a bank holding company is required to obtain the approval of the Federal Reserve before acquiring control of us. Control generally means (1) the ownership or control of twenty-five percent (25%) or more of a class of voting securities, (2) the ability to elect a majority of the directors or (3) the ability otherwise to exercise a controlling influence over management and policies. The interpretation of these control attributes is subject to interpretation by the Federal Reserve through regulation and practice. A person, other than an individual, that controls us for purposes of the BHC Act is subject to regulation and supervision as a bank holding company under the BHC Act. In addition, under the Change in Bank Control Act of 1978, as amended, and the OCCs regulations thereunder, any person, either individually or acting through or in concert with one or more persons, is required to provide notice (or rebut control) to the OCC prior to acquiring, directly or indirectly, 10% or more of the voting power of our outstanding common stock (or any other class of our voting securities).
Charter and Bylaws
As described below, our Charter and our Bylaws, which will become effective prior to the completion of this offering, will include a number of provisions that could deter hostile takeovers or delay or prevent changes in control of our Board or management team.
Dual-Class Stock
As described above in Common Stock Voting Rights, the dual class structure of our common stock has the effect of concentrating voting power with the holders of our Class B common stock, including the members of the Fitzgerald Family, which will limit or preclude your ability to influence corporate matters, including the election of our board of directors. See Summary Dual Class Structure and Reclassification.
Board of Directors Vacancies
Our Charter and Bylaws will authorize only our Board to fill vacant directorships, including newly created seats. In addition, the number of directors constituting our Board will be permitted to be set only by a resolution adopted by a majority vote of our entire Board. These provisions would prevent a stockholder from increasing the size of our Board and then gaining control of our Board by filling the resulting vacancies with its own nominees. This will make it more difficult to change the composition of our Board and will promote continuity of management.
149
Table of Contents
Stockholder Action; Special Meeting of Stockholders
Our Charter will provide that our stockholders may not take action by written consent, but may only take action at annual or special meetings of our stockholders. As a result, a holder controlling a majority of our capital stock would not be able to amend our Bylaws or remove directors without holding a meeting of our stockholders called in accordance with our Bylaws. Our Charter will further provide that, subject to compliance with the procedures set forth in our Bylaws, special meetings may be called by the Companys Secretary upon the written request of the record holders of at least fifteen percent (15%) or more of the total voting power of the then-outstanding shares of common stock. These provisions might delay the ability of our stockholders to force consideration of a proposal or for stockholders to take any action, including the removal of directors.
Advance Notice Requirements for Stockholder Proposals and Director Nominations
Our Bylaws will provide advance notice procedures for stockholders seeking to bring business before our annual meeting of stockholders or to nominate candidates for election as directors at our annual meeting of stockholders. Our Bylaws will also specify certain requirements regarding the form and content of a stockholders notice. These provisions might preclude our stockholders from bringing matters before our annual meeting of stockholders or from making nominations for directors at our annual meeting of stockholders if the proper procedures are not followed. We expect that these provisions may also discourage or deter a potential acquirer from conducting a solicitation of proxies to elect the acquirers own slate of directors or otherwise attempting to obtain control of our company.
No Cumulative Voting
The DGCL provides that stockholders are not entitled to cumulate votes in the election of directors unless a corporations certificate of incorporation provides otherwise. Our Charter will not provide for cumulative voting.
Amendment of Charter Provisions
As described above in Common Stock Voting Rights, certain amendments to our Charter will require approval other than a vote of the holders of our Class A common stock and Class B common stock voting together as a single class, including amendments to our Charter that would adversely affect the rights or preferences of the holders of the Class A common stock or Class B common stock and amendments that would disproportionately benefit the Founders relative to stockholders other than the Founders.
Issuance of Undesignated Preferred Stock
Our Board will have the authority, without further action by our stockholders, to issue up to 10,000,000 shares of undesignated preferred stock with rights and preferences, including voting rights, designated from time to time by our Board. The existence of authorized but unissued shares of preferred stock would enable our Board to render more difficult or to discourage an attempt to obtain control of us by means of a merger, tender offer, proxy contest, or other means.
Choice of Forum
Our Charter and Bylaws will provide that, unless we consent in writing to the selection of an alternative forum, the Court of Chancery of the State of Delaware will be the exclusive forum for the following types of actions or proceedings under Delaware statutory or common law: any derivative action or proceeding brought on our behalf; any action asserting a claim of breach of fiduciary duty owed by any of our directors, officers or stockholders to us or to our stockholders; any action asserting a claim against us arising pursuant to the DGCL, our Charter or our Bylaws (as either may be amended from time to time); or any action asserting a claim against us that is governed by the internal affairs doctrine. As a result, any action brought by any of our stockholders
150
Table of Contents
with regard to any of these matters will need to be filed in the Court of Chancery of the State of Delaware and cannot be filed in any other jurisdiction; provided that, the exclusive forum provision will not apply to suits brought to enforce any liability or duty created by the Exchange Act or any other claim for which the federal courts have exclusive jurisdiction; and provided further that, if and only if the Court of Chancery of the State of Delaware lacks jurisdiction over such action or proceeding, such action or proceeding may be brought in another state or federal court sitting in the State of Delaware. Our Charter and Bylaws will also provide that the federal district courts of the United States of America will be the exclusive forum for the resolution of any complaint asserting a cause or causes of action against us or any defendant arising under the Securities Act. Such provision is intended to benefit and may be enforced by us, our officers and directors, or our employees and agents, including the underwriters and any other professional or entity who has prepared or certified any part of this prospectus. Nothing in our Charter and Bylaws will preclude stockholders that assert claims under the Exchange Act from bringing such claims in state or federal court, subject to applicable law.
If any action the subject matter of which is within the scope described above is filed in a court other than a court located within the State of Delaware (any such action, a Foreign Action), in the name of any stockholder, such stockholder shall be deemed to have consented to the personal jurisdiction of the state and federal courts located within the State of Delaware in connection with any action brought in any such court to enforce the applicable provisions of our Charter and Bylaws and having service of process made upon such stockholder in any such action by service upon such stockholders counsel in the Foreign Action as agent for such stockholder. Although our Charter and Bylaws will contain the choice of forum provision described above, it is possible that a court could find that such a provision is inapplicable for a particular claim or action or that such provision is unenforceable.
This choice of forum provision may limit a stockholders ability to bring a claim in a judicial forum that it finds favorable for disputes with us or any of our directors, officers, other employees or stockholders, which may discourage lawsuits with respect to such claims or make such lawsuits more costly for stockholders, although our stockholders will not be deemed to have waived our compliance with federal securities laws and the rules and regulations thereunder.
Limitations on Liability and Indemnification Matters
Our Charter will limit the liability of our directors to the fullest extent permitted by the DGCL, and our Bylaws will provide that we will indemnify them to the fullest extent permitted by such law. Pursuant to our directors and officers liability insurance, our directors and executive officers will be insured against the cost of defense, settlement or payment of a judgment under certain circumstances. In addition, as permitted by Delaware law, our Charter will include provisions that eliminate the personal liability of our directors for monetary damages resulting from breaches of certain fiduciary duties as a director. The effect of this provision is to restrict our rights and the rights of our stockholders in derivative suits to recover monetary damages against a director for breach of fiduciary duties as a director.
Transfer Agent and Registrar
The transfer agent and registrar for our Class A common stock and Class B common stock will be Transfer Online, Inc.
Securities Exchange
We intend to apply to list our Class A common stock on the NYSE under the symbol CBNA.
151
Table of Contents
SHARES ELIGIBLE FOR FUTURE SALE
Prior to this offering, there has been no market for our Class A common stock. Future sales of substantial amounts of our Class A common stock in the public market, or the perception that such sales may occur, could adversely affect market prices prevailing from time to time. This may adversely affect the prevailing market price and our ability to raise equity capital in the future.
Upon completion of this offering, we will have shares of Class A common stock outstanding (or shares if the underwriters elect to exercise in full their option to purchase additional shares from us), all of which will be sold in this offering. These shares of Class A common stock will be freely transferable without restriction or further registration under the Securities Act, except for any shares purchased or held by our affiliates, as that term is defined in Rule 144 under the Securities Act.
Upon completion of this offering, we will have shares of Class B common stock outstanding. All of these shares will be restricted securities as defined in Rule 144 and may be sold in the public market only if registered under the Securities Act or if they qualify for an exemption from registration under Rule 144. Of these shares, shares of Class B common stock will be subject to a contractual 180-day lock-up period described below and will be available for sale in the public market only after 180 days from the date of this prospectus (subject to registration or an exemption from registration). The remaining shares of Class B common stock that are not subject to the contractual lockup, upon conversion to shares of Class A common stock, may be sold in the public market if they qualify for an exemption from registration under Rule 144. Our Charter will provide that each share of our Class B common stock is convertible at any time, at the option of the holder, into one share of Class A common stock. Shares of our Class A common stock issuable to our stockholders upon conversion of shares of Class B common stock would be considered restricted securities, as that term is defined under Rule 144.
Members of the Fitzgerald Family may divest their ownership interest in us over time, subject to market conditions and other considerations. Shares held by members of the Fitzgerald Family will be subject to the 180-day lock-up period.
Rule 144
In general, a person who has beneficially owned restricted shares of our Class A common stock for at least six months would be entitled to sell such securities; provided that, (1) such person is not deemed to have been one of our affiliates at the time of, or at any time during the 90 days preceding, the sale and (2) we are subject to the Exchange Act periodic reporting requirements for at least 90 days before the sale. A person who is not deemed to have been one of our affiliates at the time of, or at any time during the 90 days preceding, a sale and has beneficially owned restricted shares of our Class A common stock for at least one year would be entitled to sell such securities without regard to the current public information requirements of Rule 144.
We believe that all holders who receive Class B common stock in the Reclassification will be permitted to tack the holding period of their old common stock to their own holding periods with respect to their Class A common stock for purposes of establishing the requisite six-month or one-year holding period. As a result, following the Reclassification, a person who was not one of our affiliates at any time during the three months preceding a sale and not subject to the contractual lock-up will be entitled to sell any and all of the shares of Class A common stock they receive upon conversion of the Class B common stock they receive as a result of the Reclassification under Rule 144 without restriction.
Persons who have beneficially owned restricted shares of our Class A common stock for at least six months but who are our affiliates at the time of, or any time during the 90 days preceding, the sale would be subject to additional restrictions, by which such person would be entitled to sell within any three-month period only a number of securities that does not exceed the greater of the following:
| | one percent (1%) of the number of shares of our Class A common stock then outstanding, which will equal approximately shares immediately after this offering, assuming no exercise of the underwriters option to purchase additional shares; or |
152
Table of Contents
| | the average weekly trading volume of our Class A common stock during the four calendar weeks preceding the filing of a notice on Form 144 with respect to the sale; |
provided that, in each case, we are subject to the Exchange Act periodic reporting requirements for at least 90 days before the sale. Such sales both by affiliates and by non-affiliates must also comply with the manner of sale and notice provisions of Rule 144 to the extent applicable.
Lock-up Agreements
We, the members of the Fitzgerald Family, our directors and executive officers and holders of more than 4.5% of our common stock have agreed, subject to certain limited exceptions, not to offer, pledge, sell, contract to sell, sell any option or contract to purchase, purchase any option or contract to sell, grant any option, right or warrant for the sale of, otherwise dispose of or transfer any shares of our common stock or any securities convertible into or exchangeable or exercisable for Class A common stock for a period of 180 days after the date of this prospectus, without the prior written consent of Piper Sandler & Co. on behalf of the underwriters. See Underwriting. The underwriters do not have any present intention or arrangement to release any shares of our common stock subject to lock-up agreements prior to the expiration of the 180-day lock-up period.
153
Table of Contents
MATERIAL UNITED STATES TAX CONSEQUENCES TO NON-U.S. HOLDERS OF
COMMON STOCK
This section summarizes certain United States federal income tax consequences of the ownership and disposition of Class A common stock by a non-U.S. holder. You are a non-U.S. holder if you are, for United States federal income tax purposes:
| | a nonresident alien individual; |
| | a foreign corporation; or |
| | an estate or trust that in either case is not subject to United States federal income tax on a net income basis on income or gain from common stock. |
This section does not consider the specific facts and circumstances that may be relevant to a particular non-U.S. holder and does not address the treatment of a non-U.S. holder under the laws of any state, local or foreign taxing jurisdiction. This section is based on the tax laws of the United States, including the Internal Revenue Code of 1986, as amended (the Code), existing and proposed regulations, and administrative and judicial interpretations, all as currently in effect. These laws are subject to change, possibly on a retroactive basis. This summary does not address tax considerations applicable to investors that may be subject to special treatment under the U.S. federal income tax laws, such as:
| | banks, insurance companies or other financial institutions; |
| | tax-exempt or governmental organizations; |
| | tax-qualified retirement plans; |
| | qualified foreign pension funds (or any entities all of the interests of which are held by a qualified foreign pension fund) or any other person that is subject to special rules or exemptions under the Foreign Investment in Real Property Tax Act; |
| | dealers in securities or foreign currencies; |
| | persons whose functional currency is not the U.S. dollar; |
| | controlled foreign corporations, passive foreign investment companies, and corporations that accumulate earnings to avoid U.S. federal income tax; |
| | traders in securities that use the mark-to-market method of accounting for U.S. federal income tax purposes; |
| | persons subject to the alternative minimum tax; |
| | entities or arrangements treated as partnerships or other pass-through entities for U.S. federal income tax purposes or holders of interests therein; |
| | persons deemed to sell our Class A common stock under the constructive sale provisions of the Code; |
| | persons that acquired our Class A common stock through the exercise of employee stock options or otherwise as compensation or through a tax-qualified retirement plan; |
| | certain former citizens or long-term residents of the United States; and |
| | persons that hold our Class A common stock as part of a straddle, appreciated financial position, synthetic security, hedge, conversion transaction or other integrated investment or risk reduction transaction. |
If an entity or arrangement that is treated as a partnership for United States federal income tax purposes holds the Class A common stock, the United States federal income tax treatment of a partner will generally depend on the status of the partner and the tax treatment of the partnership. A partner in a partnership holding the Class A common stock should consult its tax advisor with regard to the United States federal income tax treatment of an investment in the Class A common stock.
You should consult a tax advisor regarding the United States federal tax consequences of acquiring, holding and disposing of Class A common stock in your particular circumstances, as well as any tax consequences that may arise under the laws of any state, local or foreign taxing jurisdiction.
154
Table of Contents
Dividends
If we make a distribution of cash or other property (other than certain distributions of our stock) in respect of our Class A common stock, the distribution generally will be treated as a dividend to the extent of our current or accumulated earnings and profits, as determined under United States federal income tax principles. Any portion of a distribution that exceeds our current and accumulated earnings and profits will generally be treated first as a tax-free return of capital, on a share-by-share basis, to the extent of your tax basis in our Class A common stock (and will reduce your basis in such Class A common stock), and, to the extent such portion exceeds your tax basis in our Class A common stock, the excess will be treated as gain from the taxable disposition of the Class A common stock, the tax treatment of which is discussed below under Gain on Disposition of Class A Common Stock.
Except as described below, distributions treated as dividends paid to you on Class A common stock are subject to withholding of United States federal income tax at a 30% rate or at a lower rate if you are eligible for the benefits of an income tax treaty that provides for a lower rate. Even if you are eligible for a lower treaty rate, the withholding agent will generally be required to withhold at a 30% rate (rather than the lower treaty rate) on dividend payments to you, unless you have furnished to the withholding agent:
| | a valid Internal Revenue Service (IRS) Form W-8 or an acceptable substitute form upon which you certify, under penalties of perjury, your status as a non-United States person and your entitlement to the lower treaty rate with respect to such payments; or |
| | in the case of payments made outside the United States to an offshore account (generally, an account maintained by you at an office or branch of a bank or other financial institution at any location outside the United States), other documentary evidence establishing your entitlement to the lower treaty rate in accordance with U.S. Treasury regulations. |
If you are eligible for a reduced rate of United States withholding tax under a tax treaty, you may obtain a refund of any amounts withheld in excess of that rate by filing a refund claim with the United States IRS.
If dividends paid to you are effectively connected with your conduct of a trade or business within the United States, and, if required by a tax treaty, the dividends are attributable to a permanent establishment that you maintain in the United States, withholding agents are generally not required to withhold tax from the dividends, provided that you have furnished to the withholding agent a valid IRS Form W-8ECI or an acceptable substitute form upon which you represent, under penalties of perjury, that:
| | you are a non-United States person; and |
| | the dividends are effectively connected with your conduct of a trade or business within the United States and are includible in your gross income. |
Effectively connected dividends are taxed at rates applicable to United States citizens, resident aliens and domestic United States corporations.
If you are a corporate non-U.S. holder, effectively connected dividends that you receive may, under certain circumstances, be subject to an additional branch profits tax at a 30% rate or at a lower rate if you are eligible for the benefits of an income tax treaty that provides for a lower rate.
Gain on Disposition of Class A Common Stock
You generally will not be subject to United States federal income tax on gain that you recognize on a disposition of Class A common stock unless:
| | the gain is effectively connected with your conduct of a trade or business in the United States, and the gain is attributable to a permanent establishment that you maintain in the United States, if that is required by an applicable income tax treaty as a condition for subjecting you to United States taxation on a net income basis; |
155
Table of Contents
| | you are an individual, you hold the Class A common stock as a capital asset, you are present in the United States for 183 or more days in the taxable year of the sale and certain other conditions exist; or |
| | we are or have been a United States real property holding corporation (as described below), at any time within the five-year period preceding the disposition or your holding period, whichever period is shorter, you are not eligible for a treaty exemption, and either (1) our Class A common stock is not regularly traded on an established securities market during the calendar year in which the sale or disposition occurs or (2) you owned or are deemed to have owned, at any time within the five-year period preceding the disposition or your holding period, whichever period is shorter, more than five percent (5%) of our Class A common stock. |
If the gain from the taxable disposition of shares of our Class A common stock is effectively connected with your conduct of a trade or business in the United States (and, if required by a tax treaty, the gain is attributable to a permanent establishment that you maintain in the United States), you will be subject to tax on the net gain derived from the sale at rates applicable to United States citizens, resident aliens and domestic United States corporations. If you are a corporate non-U.S. holder, effectively connected gains that you recognize may also, under certain circumstances, be subject to an additional branch profits tax at a 30% rate or at a lower rate if you are eligible for the benefits of an income tax treaty that provides for a lower rate. If you are an individual non-U.S. holder described in the second bullet point immediately above, you will be subject to a flat 30% tax (unless an applicable income tax treaty provides otherwise) on the gain derived from the sale, which may be offset by United States source capital losses, even though you are not considered a resident of the United States.
With respect to the third bullet point above, we will be a United States real property holding corporation at any time that the fair market value of our United States real property interests, as defined in the Code and applicable Treasury Regulations, equals or exceeds 50% of the aggregate fair market value of our worldwide real property interests and our other assets used or held for use in a trade or business (all as determined for the U.S. federal income tax purposes). We believe that we are not, and do not anticipate becoming in the foreseeable future, a United States real property holding corporation. Even if we were to become a United States real property holding corporation, gain arising from your sale or other taxable disposition of shares of our Class A common stock will not be subject to U.S. federal income tax if our Class A common stock is regularly traded, as defined by applicable Treasury Regulations, on an established securities market, and you owned, actually and constructively, five percent (5%) or less of our Class A common stock throughout the shorter of the five-year period ending on the date of the sale or other taxable disposition or your holding period.
FATCA Withholding
Pursuant to sections 1471 through 1474 of the Code, commonly known as the Foreign Account Tax Compliance Act (FATCA), a 30% withholding tax (FATCA withholding) may be imposed on certain payments to you or to certain foreign financial institutions, investment funds and other non-U.S. persons receiving payments on your behalf if you or such persons fail to comply with certain information reporting requirements. Payments of dividends that you receive in respect of Class A common stock could be affected by this withholding if you are subject to the FATCA information reporting requirements and fail to comply with
them or if you hold Class A common stock through a non-U.S. person (e.g., a foreign bank or broker) that fails to comply with these requirements (even if payments to you would not otherwise have been subject to FATCA withholding). You should consult your own tax advisors regarding the relevant U.S. law and other official guidance on FATCA withholding.
Backup Withholding and Information Reporting
We and other payors are required to report payments of dividends on Class A common stock on IRS Form 1042-S even if the payments are exempt from withholding. Dividends paid by us (or our paying agents) to you may also be subject to U.S. backup withholding. U.S. backup withholding generally will not apply if you provide a properly executed IRS Form W-8BEN, IRS Form W-8BEN-E, or IRS Form W-ECI, or otherwise
156
Table of Contents
establish an exemption. Notwithstanding the foregoing, backup withholding may apply if the payor has actual knowledge, or reason to know, that you are a U.S. person who is not an exempt recipient.
Payment of the proceeds from the sale of Class A common stock effected at a foreign office of a broker generally will not be subject to information reporting or backup withholding. However, a sale effected at a foreign office of a broker could be subject to information reporting in the same manner as a sale within the United States (and in certain cases may be subject to backup withholding as well) if (1) the broker has certain connections to the United States, (2) the proceeds or confirmation are sent to the United States or (3) the sale has certain other specified connections with the United States.
157
Table of Contents
We are offering the shares of our Class A common stock described in this prospectus in which we and Piper Sandler & Co., Raymond James & Associates, Inc. and Hovde Group, LLC, as the representatives of the underwriters named below, will enter into an underwriting agreement with respect to the shares of Class A common stock offered hereby. Subject to the terms and conditions contained in the underwriting agreement, each underwriter named below will agree, severally and not jointly, to purchase from us, and we will agree to sell to each underwriter, the number of shares of our Class A common stock as set forth opposite each underwriters name in the following table:
| Underwriter |
Number of Shares of Class A Common Stock |
|||
| Piper Sandler & Co. |
||||
| Raymond James & Associates, Inc. |
||||
| Hovde Group, LLC |
||||
|
|
|
|||
| Total |
||||
|
|
|
|||
Subject to the terms and conditions set forth in the underwriting agreement, the underwriters will be committed to purchase and pay for all such shares of our Class A common stock if any are purchased. However, the underwriters will not be obligated to take or pay for the shares of our Class A common stock covered by the underwriters option to purchase additional shares described below, unless and until such option is exercised. The underwriting agreement will provide that, if an underwriter defaults, the purchase commitments of the non-defaulting underwriters may be increased or the underwriting agreement may be terminated.
The shares of our Class A common stock will be offered by the underwriters, subject to prior sale, when, as and if issued to and accepted by them, subject to approval of certain legal matters by counsel for the underwriters and other conditions specified in the underwriting agreement. The underwriters will reserve the right to withdraw, cancel or modify this offer and to reject orders in whole or in part. The underwriting agreement will provide that the obligations of the underwriters may also be terminated upon the occurrence of the events specified in the underwriting agreement. The underwriting agreement will provide that the underwriters are obligated to purchase all the shares of Class A common stock in this offering if any are purchased, other than those shares covered by the underwriters option to purchase additional shares described below.
Purchase Option
We will grant to the underwriters an option, exercisable no later than 30 days after the date of this prospectus, to purchase up to additional shares of our Class A common stock at the public offering price less the underwriting discount set forth on the cover page of this prospectus. We will be obligated to sell these shares of Class A common stock to the underwriters to the extent the purchase option is exercised. The underwriters may exercise this option only to cover over-allotments, if any, made in connection with the sale of our Class A common stock offered by this prospectus.
Discounts and Expenses
The underwriters will propose to offer the shares of Class A common stock directly to the public at the offering price set forth on the cover page of this prospectus and to certain securities dealers at the public offering price less a concession not in excess of $ per share. After the public offering of the Class A common stock, the underwriters may change the offering price and other selling terms.
158
Table of Contents
The following table shows the per share and total underwriting discount that we will pay to the underwriters and the proceeds we will receive before expenses. These amounts are shown assuming both no exercise and full exercise of the underwriters option to purchase additional shares.
| Per Share |
Total Without Option |
Total With Option |
||||||||||
| Price to public |
||||||||||||
| Underwriting discount |
||||||||||||
|
|
|
|
|
|
|
|||||||
| Proceeds to us, before expenses |
||||||||||||
|
|
|
|
|
|
|
|||||||
We estimate that the total expenses of the offering, excluding underwriting discounts and commissions, will be approximately $ million. We will agree to reimburse the underwriters for certain reasonable and documented out-of-pocket expenses incurred by the underwriters on our behalf and in connection with this offering, including any applicable state securities filings, up to a maximum of $ . We will also agree to reimburse the underwriters for certain expenses relating to the clearance of this offering with the Financial Industry Regulatory Authority, not to exceed $ .
Lock-Up Agreements
We, members of the Fitzgerald Family, our directors and executive officers, and holders of more than 4.5% of our common stock have agreed, subject to certain exceptions for a period of 180 days after the date of this prospectus, not to sell, offer, agree to sell, contract to sell, hypothecate, pledge, grant any option to sell, make any short sale, or otherwise dispose of or hedge, directly or indirectly, any shares of our Class A common stock or securities convertible into, exchangeable or exercisable for any shares of our common stock or warrants or other rights to purchase shares of our Class A common stock or other similar securities without, in each case, the prior written consent of Piper Sandler & Co., as representative of the underwriters. These restrictions are expressly agreed to preclude us, and our executive officers and directors and certain other current stockholders, from engaging in any hedging or other transaction or arrangement that is designed to, or that reasonably could be expected to, lead to or result in a sale, disposition or transfer, in whole or in part, of any of the economic consequences of ownership of our Class A common stock, whether such transaction would be settled by delivery of Class A common stock or other securities, in cash or otherwise.
Pricing of the Offering
Prior to this offering, there has been no established public market for our Class A common stock. The initial public offering price was determined by negotiations among us and the representative of the underwriters. In addition to prevailing market conditions, among the factors to be considered in determining the initial public offering price of our Class A common stock were our historical performance, estimates of our business potential and our earnings prospects, an assessment of our management, and the consideration of the above factors in relation to market valuation of companies in related businesses. The estimated initial public offering price range set forth on the cover page of this prospectus is subject to change as a result of market conditions and other factors. An active trading market for the shares of our Class A common stock may not develop. It is also possible that the shares of our Class A common stock will not trade in the public market at or above the initial public offering price following the completion of this offering.
Exchange Listing
We expect our Class A common stock to be approved for listing on the NYSE under the symbol CBNA.
159
Table of Contents
Indemnification and Contribution
We have agreed to indemnify the underwriters against certain liabilities, including liabilities under the Securities Act. If we are unable to provide this indemnification, we will contribute to the payments the underwriters may be required to make in respect of those liabilities.
Price Stabilization, Short Positions and Penalty Bids
In connection with the offering, the underwriters may purchase and sell shares of our Class A common stock in the open market. These transactions may include short sales, stabilizing transactions, and purchases to cover positions created by short sales. Short sales involve the sale by the underwriters of a greater number of shares than they are required to purchase in the offering, and a short position represents the amount of such sales that have not been covered by subsequent purchases. A covered short position is a short position that is not greater than the amount of additional shares for which the underwriters option described above may be exercised. The underwriters may cover any covered short position by either exercising their option to purchase additional shares or purchasing shares in the open market. In determining the source of shares to cover the covered short position, the underwriters will consider, among other things, the price of shares available for purchase in the open market as compared to the price at which they may purchase additional shares pursuant to the option described above. Naked short sales are any short sales that create a short position greater than the amount of additional shares for which the option described above may be exercised. The underwriters must cover any such naked short position by purchasing shares in the open market. A naked short position is more likely to be created if the underwriters are concerned that there may be downward pressure on the price of our Class A common stock in the open market after pricing that could adversely affect investors who purchase in the offering. Stabilizing transactions consist of various bids for or purchases of our Class A common stock made by the underwriters in the open market prior to the closing of the offering.
The underwriters may also impose a penalty bid. This occurs when a particular underwriter repays to the underwriters a portion of the underwriting discount received by it because the representative has repurchased shares sold by or for the account of such underwriter in stabilizing or short covering transactions.
Purchases to cover a short position and stabilizing transactions, as well as other purchases by the underwriters for their own accounts, may have the effect of preventing or retarding a decline in the market price of our Class A common stock and, together with the imposition of the penalty bid, may stabilize, maintain, or otherwise affect the market price of our Class A common stock. As a result, the price of our Class A common stock may be higher than the price that otherwise might exist in the open market. The underwriters are not required to engage in these activities and may end any of these activities at any time. These transactions may be effected on the NYSE, in the over-the-counter market or otherwise.
Passive Market Making
In connection with this offering, the underwriters may engage in passive market making transactions in our Class A common stock on the NYSE in accordance with Rule 103 of Regulation M under the Exchange Act during a period before the commencement of offers or sales of our Class A common stock and extending through the completion of the distribution of this offering. A passive market maker must display its bid at a price not in excess of the highest independent bid of that security. However, if all independent bids are lowered below the passive market makers bid, that bid must then be lowered when specified purchase limits are exceeded. Passive market making may cause the price of our Class A common stock to be higher than the price that otherwise would exist in the open market in the absence of those transactions. The underwriters and dealers are not required to engage in passive market making and may end passive market making activities at any time.
Electronic Distribution
A prospectus in electronic format may be made available by e-mail or on the websites or through online services maintained by the underwriters or their affiliates. In those cases, prospective investors may view
160
Table of Contents
offering terms online and may be allowed to place orders online. The underwriters may agree with us to allocate a specific number of shares for sale to online brokerage account holders. Any such allocation for online distributions will be made by the underwriters on the same basis as other allocations. Other than the prospectus in electronic format, the information on the underwriters websites and any information contained on any other website maintained by the underwriters is not part of this prospectus, has not been approved and/or endorsed by the underwriters or us and should not be relied upon by investors.
Selling Restrictions
Other than in the United States, no action has been taken by us or the underwriters that would permit a public offering of the securities offered by this prospectus in any jurisdiction where action for that purpose is required. The securities offered by this prospectus may not be offered or sold, directly or indirectly, nor may this prospectus or any other offering material or advertisement in connection with the offer and sale of any such securities be distributed or published in any jurisdiction, except under circumstances that will result in compliance with the applicable rules and regulations of that jurisdiction. Persons into whose possession this prospectus comes are advised to inform themselves about and to observe any restrictions relating to the offering and the distribution of this prospectus. This prospectus does not constitute an offer to sell or a solicitation of an offer to buy any securities offered by this prospectus in any jurisdiction in which such an offer or a solicitation is unlawful.
Affiliations
The underwriters and their respective affiliates are full service financial institutions engaged in various activities, which may include securities trading, commercial and investment banking, financial advisory, investment management, investment advisory, investment research, principal investment, hedging, financing, loan referrals, valuation, and brokerage activities. From time to time, the underwriters and/or their respective affiliates have directly and indirectly engaged, and may in the future engage, in various financial advisory, investment banking loan referrals, and commercial banking services with us and our affiliates, for which they received or paid, or may receive or pay, customary compensation, fees, and expense reimbursement.
In the ordinary course of their various business activities, the underwriters and their respective affiliates may make or hold a broad array of investments and actively trade debt and equity securities (or related derivative securities) and financial instruments (including bank loans) for their own account and for the accounts of their clients, and those investment and securities activities may involve securities and/or instruments of ours. The underwriters and their respective affiliates may also make investment recommendations and/or publish or express independent research views in respect of those securities or instruments and may at any time hold, or recommend to clients that they acquire, long and/or short positions in those securities and instruments.
161
Table of Contents
VALIDITY OF CLASS A COMMON STOCK
The validity of the shares of our common stock offered hereby will be passed upon for us by Sullivan & Cromwell LLP, New York, New York. The validity of the shares of common stock offered hereby will be passed upon for the underwriters by Holland & Knight LLP.
The consolidated financial statements of Chain Bridge Bancorp, Inc., as of and for the years ended December 31, 2023 and 2022, included in this prospectus have been audited by Yount, Hyde & Barbour, P.C., an independent registered public accounting firm, as stated in their report appearing herein. Such consolidated financial statements have been included in reliance upon the report of such firm given upon their authority as experts in accounting and auditing.
WHERE YOU CAN FIND MORE INFORMATION
We have filed with the SEC a registration statement on Form S-1 under the Securities Act with respect to the shares of Class A common stock offered by this prospectus. This prospectus, filed as part of the registration statement, does not contain all of the information set forth in the registration statement and its exhibits and schedules, portions of which have been omitted as permitted by the rules and regulations of the SEC. For further information about us and shares of our common stock, we refer you to the registration statement and to its exhibits and schedules. Statements in this prospectus about the contents of any contract, agreement or other document are not necessarily complete and in each instance we refer you to the copy or form of such contract, agreement or document filed as an exhibit to the registration statement, each statement being qualified in all respects by such reference. You may inspect these reports and other information without charge at a website maintained by the SEC. The address of this site is http://www.sec.gov.
We maintain an internet website at http://www.chainbridgebank.com. The information on, or accessible from, our website is not part of this prospectus by reference or otherwise.
Upon completion of this offering, we will become subject to the informational requirements of the Exchange Act and will be required to file reports and other information with the SEC. You will be able to inspect copies of these materials without charge at the SECs website. We intend to make available to our common stockholders annual reports containing consolidated financial statements audited by an independent registered public accounting firm.
162
Table of Contents
| Unaudited Consolidated Financial Statements |
||||
| Consolidated Balance Sheet as of March 31, 2024 and December 31, 2023 |
F-2 | |||
| F-3 | ||||
| Consolidated Statement of Cash Flows for the three months ended March 31, 2024 and March 31, 2023 |
F-5 | |||
| F-6 | ||||
| F-7 | ||||
| Audited Consolidated Financial Statements |
||||
| F-22 | ||||
| Consolidated Balance Sheet as of December 31, 2023 and December 31, 2022 |
F-23 | |||
| F-24 | ||||
| Consolidated Statement of Cash Flows for the years ended December 31, 2023 and December 31, 2022 |
F-26 | |||
| F-27 | ||||
| F-28 | ||||
F-1
Table of Contents
Chain Bridge Bancorp, Inc. and Subsidiary
(Dollars in thousands, except per share data)
| March 31, 2024 |
December 31, 2023 |
|||||||
| (unaudited) | * | |||||||
| Assets |
||||||||
| Cash and due from banks |
$ | 6,134 | $ | 6,035 | ||||
| Interest-bearing deposits in other banks |
340,171 | 310,732 | ||||||
|
|
|
|
|
|||||
| Total cash and cash equivalents |
346,305 | 316,767 | ||||||
| Securities available for sale, at fair value |
254,880 | 258,114 | ||||||
| Securities held to maturity, at carrying value, net of allowance for credit losses of $359 and $348, respectively (fair value of $282,311 and $283,916, respectively) |
307,953 | 308,058 | ||||||
| Equity securities, at fair value |
504 | 505 | ||||||
| Restricted securities, at cost |
2,736 | 2,613 | ||||||
| Loans held for sale |
671 | | ||||||
| Loans, net of allowance for credit losses of $4,324 and $4,319, respectively |
300,943 | 299,825 | ||||||
| Premises and equipment, net of accumulated depreciation of $6,920 and $6,791, respectively |
9,789 | 9,858 | ||||||
| Accrued interest receivable |
4,974 | 4,354 | ||||||
| Other assets |
5,016 | 5,108 | ||||||
|
|
|
|
|
|||||
| Total assets |
$ | 1,233,771 | $ | 1,205,202 | ||||
|
|
|
|
|
|||||
| Liabilities and stockholders equity |
||||||||
| Liabilities |
||||||||
| Deposits: |
||||||||
| Noninterest-bearing |
$ | 833,359 | $ | 766,933 | ||||
| Savings, interest-bearing checking and money market accounts |
286,803 | 328,350 | ||||||
| Time, $250 and over |
9,140 | 9,385 | ||||||
| Other time |
6,453 | 7,357 | ||||||
|
|
|
|
|
|||||
| Total deposits |
1,135,755 | 1,112,025 | ||||||
| Short-term borrowings |
5,000 | 5,000 | ||||||
| Accrued interest payable |
76 | 61 | ||||||
| Accrued expenses and other liabilities |
5,339 | 4,679 | ||||||
|
|
|
|
|
|||||
| Total liabilities |
1,146,170 | 1,121,765 | ||||||
|
|
|
|
|
|||||
| Commitments and contingencies |
||||||||
| Stockholders equity |
||||||||
| Preferred stock |
||||||||
| No par value, 100,000 shares authorized, no shares issued and outstanding |
| | ||||||
| Common stock |
||||||||
| $1.00 par value, 200,000 shares authorized, 26,876 and 26,872 shares issued and outstanding, respectively |
27 | 27 | ||||||
| Additional paid-in capital |
38,295 | 38,283 | ||||||
| Retained earnings |
60,609 | 56,692 | ||||||
| Accumulated other comprehensive loss |
(11,330 | ) | (11,565 | ) | ||||
|
|
|
|
|
|||||
| Total stockholders equity |
87,601 | 83,437 | ||||||
|
|
|
|
|
|||||
| Total liabilities and stockholders equity |
$ | 1,233,771 | $ | 1,205,202 | ||||
|
|
|
|
|
|||||
* Derived from audited financial statements.
See Notes to Consolidated Financial Statements.
F-2
Table of Contents
Chain Bridge Bancorp, Inc. and Subsidiary
Consolidated Statements of Income
For the Three Months Ended March 31, 2024 and 2023
(Dollars in thousands, except per share data)
(unaudited)
| Three Months Ended March 31, |
||||||||
| 2024 | 2023 | |||||||
| Interest and dividend Income |
||||||||
| Interest and fees on loans |
$ | 3,280 | $ | 3,388 | ||||
| Interest and dividends on securities, taxable |
2,866 | 2,823 | ||||||
| Interest on securities, tax-exempt |
294 | 307 | ||||||
| Interest on interest-bearing deposits in banks |
3,259 | 825 | ||||||
|
|
|
|
|
|||||
| Total interest and dividend income |
9,699 | 7,343 | ||||||
|
|
|
|
|
|||||
| Interest expense |
||||||||
| Interest on deposits |
808 | 790 | ||||||
| Interest on short-term borrowings |
99 | 92 | ||||||
|
|
|
|
|
|||||
| Total interest expense |
907 | 882 | ||||||
|
|
|
|
|
|||||
| Net interest income |
8,792 | 6,461 | ||||||
| (Recapture of) provision for credit losses |
||||||||
| Provision for (recapture of) loan credit losses |
5 | (23 | ) | |||||
| (Recapture of) provision for securities credit losses |
(199 | ) | 798 | |||||
|
|
|
|
|
|||||
| Total (recapture of) provision for credit losses |
(194 | ) | 775 | |||||
|
|
|
|
|
|||||
| Net interest income after (recapture of) provision for credit losses |
8,986 | 5,686 | ||||||
|
|
|
|
|
|||||
| Noninterest income |
||||||||
| Deposit placement services income |
1,122 | 16 | ||||||
| Service charges on accounts |
311 | 200 | ||||||
| Trust and wealth management income |
187 | 112 | ||||||
| Loss on sale of securities |
| (84 | ) | |||||
| Other income |
28 | 39 | ||||||
|
|
|
|
|
|||||
| Total noninterest income |
1,648 | 283 | ||||||
|
|
|
|
|
|||||
| Noninterest expenses |
||||||||
| Salaries and employee benefits |
3,485 | 3,021 | ||||||
| Data processing and communication expenses |
595 | 546 | ||||||
| Professional services |
465 | 212 | ||||||
| Occupancy and equipment expenses |
275 | 224 | ||||||
| Virginia bank franchise tax |
203 | 188 | ||||||
| FDIC and regulatory assessments |
193 | 128 | ||||||
| Directors fees |
161 | 91 | ||||||
| Marketing and business development costs |
72 | 88 | ||||||
| Insurance expenses |
60 | 55 | ||||||
| Other operating expenses |
232 | 162 | ||||||
|
|
|
|
|
|||||
| Total noninterest expenses |
5,741 | 4,715 | ||||||
|
|
|
|
|
|||||
| Net income before taxes |
4,893 | 1,254 | ||||||
|
|
|
|
|
|||||
| Income tax expense |
976 | 206 | ||||||
|
|
|
|
|
|||||
| Net income |
$ | 3,917 | $ | 1,048 | ||||
|
|
|
|
|
|||||
| Earnings per common share, basic and diluted |
$ | 145.74 | $ | 39.01 | ||||
|
|
|
|
|
|||||
See Notes to Consolidated Financial Statements.
F-3
Table of Contents
Chain Bridge Bancorp, Inc. and Subsidiary
Consolidated Statements of Comprehensive Income
For the Three Months Ended March 31, 2024 and 2023
(Dollars in thousands)
(unaudited)
| Three Months Ended March 31, |
||||||||
| 2024 | 2023 | |||||||
| Net income |
$ | 3,917 | $ | 1,048 | ||||
| Other comprehensive income: |
||||||||
| Unrealized holding gains on securities available for sale, net of tax of $1 and $740, respectively |
5 | 2,786 | ||||||
| Amortization of unrealized holding losses on securities available for sale transferred to held to maturity, net of tax of $61 and $57, respectively |
230 | 215 | ||||||
| Reclassification adjustment for losses included in net income, net of taxes of $18 in 2023 |
| 66 | ||||||
|
|
|
|
|
|||||
| Other comprehensive income, net of tax |
235 | 3,067 | ||||||
|
|
|
|
|
|||||
| Comprehensive income |
$ | 4,152 | $ | 4,115 | ||||
|
|
|
|
|
|||||
See Notes to Consolidated Financial Statements.
F-4
Table of Contents
Chain Bridge Bancorp, Inc. and Subsidiary
Consolidated Statements of Cash Flows
For the Three Months Ended March 31, 2024 and 2023
(Dollars in thousands)
(unaudited)
| Three Months Ended March 31, |
||||||||
| 2024 | 2023 | |||||||
| Cash flows from operating activities |
||||||||
| Net income |
$ | 3,917 | $ | 1,048 | ||||
| Reconciliation of net income to net cash provided by operating activities: |
||||||||
| Depreciation and amortization of premises and equipment |
129 | 122 | ||||||
| Premium amortization and discount accretion on investment securities, net |
202 | 426 | ||||||
| Recapture of impairment loss on securities previously recognized in earnings |
(1 | ) | (1 | ) | ||||
| Fair value adjustment on equity security |
4 | (8 | ) | |||||
| Provision for (recapture of) loan credit losses |
5 | (23 | ) | |||||
| (Recapture of) provision for securities credit losses |
(199 | ) | 798 | |||||
| Loss on sale of securities |
| 84 | ||||||
| Origination of loans held for sale |
(671 | ) | | |||||
| Changes in assets and liabilities: |
||||||||
| Increase in accrued interest receivable and other asset |
(590 | ) | (320 | ) | ||||
| Increase (decrease) in accrued interest payable, accrued expenses and other liabilities |
675 | (403 | ) | |||||
|
|
|
|
|
|||||
| Net cash provided by operating activities |
3,471 | 1,723 | ||||||
|
|
|
|
|
|||||
| Cash flows from investing activities |
||||||||
| Securities available for sale: |
||||||||
| Purchases of securities |
(7,061 | ) | (2,943 | ) | ||||
| Proceeds from calls, maturities, paydowns and sales |
10,688 | 6,780 | ||||||
| Securities held to maturity: |
||||||||
| Proceeds from calls, maturities and paydowns |
7 | 228 | ||||||
| (Purchase) redemption of restricted securities, net |
(123 | ) | 94 | |||||
| Reinvestment of dividends on equity security |
(3 | ) | (3 | ) | ||||
| Net (increase) decrease in loans |
(1,123 | ) | 1,645 | |||||
| Purchases of premises and equipment |
(60 | ) | (4 | ) | ||||
|
|
|
|
|
|||||
| Net cash provided by investing activities |
2,325 | 5,797 | ||||||
|
|
|
|
|
|||||
| Cash flows from financing activities |
||||||||
| Net increase (decrease) in noninterest-bearing, savings, interest-bearing checking and money market deposits |
24,879 | (12,272 | ) | |||||
| Net (decrease) increase in time deposits |
(1,149 | ) | 27,271 | |||||
| Proceeds from stock issuance |
12 | | ||||||
|
|
|
|
|
|||||
| Net cash provided by financing activities |
23,742 | 14,999 | ||||||
|
|
|
|
|
|||||
| Net increase in cash and cash equivalents |
29,538 | 22,519 | ||||||
| Cash and cash equivalents, beginning of period |
316,767 | 98,663 | ||||||
|
|
|
|
|
|||||
| Cash and cash equivalents, end of period |
$ | 346,305 | $ | 121,182 | ||||
|
|
|
|
|
|||||
| Supplemental disclosures of cash flow information |
||||||||
| Cash payments for interest |
$ | 892 | $ | 853 | ||||
| Cash payments for taxes |
| | ||||||
| Supplemental disclosures of noncash investing activities |
||||||||
| Fair value adjustment for available for sale securities |
$ | 5 | $ | 3,611 | ||||
See Notes to Consolidated Financial Statements.
F-5
Table of Contents
Chain Bridge Bancorp, Inc. and Subsidiary
Consolidated Statements of Changes in Stockholders Equity
For the Three Months Ended March 31, 2024 and 2023
(Dollars in thousands)
(unaudited)
| Common Stock |
Additional Paid-In Capital |
Retained Earnings |
Accumulated Other Comprehensive Income (Loss) |
Total | ||||||||||||||||
| Balance at December 31, 2022 |
$ | 27 | $ | 38,283 | $ | 48,121 | $ | (17,648 | ) | $ | 68,783 | |||||||||
| Adjustment for adoption of ASC 326 |
| | (329 | ) | | (329 | ) | |||||||||||||
| Net income |
| | 1,048 | | 1,048 | |||||||||||||||
| Other comprehensive income |
| | | 3,067 | 3,067 | |||||||||||||||
|
|
|
|
|
|
|
|
|
|
|
|||||||||||
| Balance at March 31, 2023 |
$ | 27 | $ | 38,283 | $ | 48,840 | $ | (14,581 | ) | $ | 72,569 | |||||||||
|
|
|
|
|
|
|
|
|
|
|
|||||||||||
| Balance at December 31, 2023 |
$ | 27 | $ | 38,283 | $ | 56,692 | $ | (11,565 | ) | $ | 83,437 | |||||||||
| Net income |
| | 3,917 | | 3,917 | |||||||||||||||
| Other comprehensive income |
| | | 235 | 235 | |||||||||||||||
| Issuance of of common stock |
| 12 | | | 12 | |||||||||||||||
|
|
|
|
|
|
|
|
|
|
|
|||||||||||
| Balance at March 31, 2024 |
$ | 27 | $ | 38,295 | $ | 60,609 | $ | (11,330 | ) | $ | 87,601 | |||||||||
|
|
|
|
|
|
|
|
|
|
|
|||||||||||
See Notes to Consolidated Financial Statements.
F-6
Table of Contents
Chain Bridge Bancorp, Inc. and Subsidiary
Notes to Consolidated Financial Statements
(unaudited)
Note 1. Organization and Summary of Significant Accounting Policies
Organization and Nature of Operations
Chain Bridge Bancorp, Inc. (the Company) is a Delaware corporation and is the registered bank holding company for Chain Bridge Bank, National Association (the Bank). Both the Company and Bank have their headquarters and sole executive office in McLean, Virginia
The Bank operates a model that combines electronic banking channels with its physical banking headquarters in McLean, Virginia, allowing it to serve clients nationally.
The Bank provides a wide range of commercial and personal banking services, including deposit accounts, mortgage financing, various loan products, trust administration, wealth management, and asset custody. The core deposit products offered by the Bank include noninterest-bearing and interest-bearing checking accounts, along with savings accounts. The Banks lending portfolio is comprised primarily of mortgage-related loans, with consumer residential mortgages within the Washington, D.C. metropolitan area forming the majority of these.
Basis of Presentation
The accompanying unaudited interim consolidated financial statements have been prepared in accordance with accounting principles generally accepted in the United States of America (GAAP) for interim financial information. The statements do not include all of the information and footnotes required by GAAP for complete financial statements. In the opinion of the Companys management, all adjustments, consisting only of normal recurring adjustments, which are necessary for a fair presentation of the consolidated financial statements, have been included. These unaudited interim consolidated financial statements should be read in conjunction with the Companys audited consolidated financial statements for the year ended December 31, 2023 and the notes thereto.
The results of operations for the three months ended March 31, 2024 are not necessarily indicative of the results to be expected for any other interim period or for the full year.
Principles of Consolidation
The consolidated financial statements include the accounts of Chain Bridge Bancorp, Inc. and its wholly-owned subsidiary, Chain Bridge Bank, National Association. All significant intercompany balances and transactions have been eliminated in consolidation.
Reclassification
Certain amounts reported in prior years may be reclassified to conform to the current years presentation. None of those reclassifications were significant to stockholders equity or net income.
Significant Accounting Policies
The accounting and reporting policies of the Company are in accordance with GAAP and conform to general practices within the banking industry. The Companys significant accounting policies are described in the Note 1 of the Notes to the Consolidated Financial Statements included in the audited consolidated financial statements for the fiscal year ended December 31, 2023. There have been no significant changes to the application of significant accounting policies since December 31, 2023.
F-7
Table of Contents
In preparing financial statements in conformity with GAAP, management is required to make estimates and assumptions that affect the reported amounts of assets and liabilities as of the date of the balance sheet and reported amounts of revenues and expenses during the reporting period. Estimates are evaluated on an ongoing basis. Actual results could differ from those estimates. Material estimates that are particularly susceptible to significant change in the near term relate to the determination of the allowance for credit losses (ACL) on loans and held to maturity debt securities.
Recent Accounting Pronouncements
In December 2023, the Financial Accounting Standards Board (FASB) issued ASU 2023-09, Income Taxes (Topic 740): Improvements to Income Tax Disclosures. The amendments in this ASU require an entity to disclose specific categories in the rate reconciliation and provide additional information for reconciling items that meet a quantitative threshold, which is greater than five percent of the amount computed by multiplying pretax income by the entitys applicable statutory rate, on an annual basis. Additionally, the amendments in this ASU require an entity to disclose the amount of income taxes paid (net of refunds received) disaggregated by federal, state, and foreign taxes and the amount of income taxes paid (net of refunds received) disaggregated by individual jurisdictions that are equal to or greater than five percent of total income taxes paid (net of refunds received). Lastly, the amendments in this ASU require an entity to disclose income (or loss) from continuing operations before income tax expense (or benefit) disaggregated between domestic and foreign and income tax expense (or benefit) from continuing operations disaggregated by federal, state, and foreign. This ASU is effective for annual periods beginning after December 15, 2024. Early adoption is permitted. The amendments should be applied on a prospective basis; however, retrospective application is permitted. The Company does not expect the adoption of ASU 2023-09 to have a material impact on its (consolidated) financial statements.
Other accounting standards that have been issued by the FASB or other standard setting bodies are not currently expected to have material effect on the Companys financial position, results of operations or cash flows.
Note 2. Securities & Allowance for Securities Credit Losses
The Company invests in a variety of debt securities, principally obligations of the U.S. government and federal agencies, mortgage backed securities, state and municipal agencies, and corporations. As of March 31, 2024 and December 31, 2023, all debt securities were classified as held to maturity (HTM) or available for sale (AFS).
Management considers the appropriateness of the accounting treatment applied to the Companys debt securities portfolio on an ongoing basis. During a prior year, certain available for sale bonds were transferred to the held to maturity portfolio. Bonds selected for transfer included U.S. government and federal agencies, corporate bonds, and state and municipal bonds. The unrealized loss at the time of transfer is being amortized monthly over the remaining lives of the debt securities with an increase to the carrying value of the debt securities and a decrease to the related accumulated other comprehensive loss, which is included in the stockholders equity section of the consolidated balance sheets.
F-8
Table of Contents
The following tables summarize the amortized cost, gross unrealized gains and losses, fair value and allowance for credit losses of debt securities available for sale and debt securities held to maturity at March 31, 2024 and December 31, 2023 (dollars in thousands):
| March 31, 2024 | ||||||||||||||||||||
| Amortized Cost |
Gross Unrealized Gains |
Gross Unrealized (Losses) |
Fair Value | Allowance for Credit Losses |
||||||||||||||||
| Securities available for sale: |
||||||||||||||||||||
| U.S. government and federal agencies |
$ | 94,348 | $ | | $ | (2,756 | ) | $ | 91,592 | $ | | |||||||||
| Mortgage backed securities |
9,070 | | (674 | ) | 8,396 | | ||||||||||||||
| Corporate bonds |
56,458 | 1 | (1,668 | ) | 54,791 | | ||||||||||||||
| State and municipal securities |
105,037 | 7 | (4,943 | ) | 100,101 | | ||||||||||||||
|
|
|
|
|
|
|
|
|
|
|
|||||||||||
| Total securities available for sale |
$ | 264,913 | $ | 8 | $ | (10,041 | ) | $ | 254,880 | $ | | |||||||||
|
|
|
|
|
|
|
|
|
|
|
|||||||||||
| Securities held to maturity: |
||||||||||||||||||||
| U.S. government and federal agencies |
$ | 123,941 | $ | | $ | (11,051 | ) | $ | 112,890 | $ | | |||||||||
| Mortgage backed securities |
1,184 | | (37 | ) | 1,147 | | ||||||||||||||
| Corporate bonds |
59,562 | 30 | (3,127 | ) | 56,465 | (325 | ) | |||||||||||||
| State and municipal securities |
123,625 | | (11,816 | ) | 111,809 | (34 | ) | |||||||||||||
|
|
|
|
|
|
|
|
|
|
|
|||||||||||
| Total securities held to maturity |
$ | 308,312 | $ | 30 | $ | (26,031 | ) | $ | 282,311 | $ | (359 | ) | ||||||||
|
|
|
|
|
|
|
|
|
|
|
|||||||||||
| Total securities |
$ | 573,225 | $ | 38 | $ | (36,072 | ) | $ | 537,191 | $ | (359 | ) | ||||||||
|
|
|
|
|
|
|
|
|
|
|
|||||||||||
| December 31, 2023 | ||||||||||||||||||||
| Amortized Cost |
Gross Unrealized Gains |
Gross Unrealized (Losses) |
Fair Value | Allowance for Credit Losses |
||||||||||||||||
| Securities available for sale: |
||||||||||||||||||||
| U.S. government and federal agencies |
$ | 95,129 | $ | 32 | $ | (2,864 | ) | $ | 92,297 | $ | | |||||||||
| Mortgage backed securities |
9,247 | 11 | (609 | ) | 8,649 | | ||||||||||||||
| Corporate bonds |
57,304 | 5 | (1,837 | ) | 55,472 | | ||||||||||||||
| State and municipal securities |
106,472 | 34 | (4,810 | ) | 101,696 | | ||||||||||||||
|
|
|
|
|
|
|
|
|
|
|
|||||||||||
| Total securities available for sale |
$ | 268,152 | $ | 82 | $ | (10,120 | ) | $ | 258,114 | $ | | |||||||||
|
|
|
|
|
|
|
|
|
|
|
|||||||||||
| Securities held to maturity: |
||||||||||||||||||||
| U.S. government and federal agencies |
$ | 123,938 | $ | | $ | (10,069 | ) | $ | 113,869 | $ | | |||||||||
| Mortgage backed securities |
1,190 | | (17 | ) | 1,173 | | ||||||||||||||
| Corporate bonds |
59,629 | 59 | (3,027 | ) | 56,661 | (322 | ) | |||||||||||||
| State and municipal securities |
123,649 | 6 | (11,442 | ) | 112,213 | (26 | ) | |||||||||||||
|
|
|
|
|
|
|
|
|
|
|
|||||||||||
| Total securities held to maturity |
$ | 308,406 | $ | 65 | $ | (24,555 | ) | $ | 283,916 | $ | (348 | ) | ||||||||
|
|
|
|
|
|
|
|
|
|
|
|||||||||||
| Total securities |
$ | 576,558 | $ | 147 | $ | (34,675 | ) | $ | 542,030 | $ | (348 | ) | ||||||||
|
|
|
|
|
|
|
|
|
|
|
|||||||||||
There were no holdings of municipal or corporate debt that equaled or exceeded 10.0% of stockholders equity at March 31, 2024 and December 31, 2023.
There were no securities pledged to secure a line of credit with the Federal Reserve Bank of Richmond, Virginia at March 31, 2024 and December 31, 2023.
Proceeds from calls, maturities, paydowns and sales of debt securities available for sale totaled $10.7 million for the three months ending March 31, 2024 and $6.8 million for the three months ended March, 31 2023. Proceeds from calls, maturities, paydowns and sales of debt securities held to maturity totaled $7 thousand and $228 thousand for the three month periods ended March 31, 2024 and March 31, 2023, respectively.
F-9
Table of Contents
During the three months ended March 31, 2024, the Bank sold an AFS bond that was charged off during a prior year for $210 thousand. The proceeds were recorded as a recapture of credit loss. There were no other sales of debt securities during the three months ended March 31, 2024.
The proceeds, gross realized gains and losses from sales of debt securities during the three months ended March 31, 2023 were as follows (dollars in thousands):
| Three Months Ended March 31, 2023 | ||||||||
| Available for Sale | Held to Maturity | |||||||
| Proceeds from sales of securities |
$ | 145 | $ | | ||||
| Gross gains |
$ | | $ | | ||||
| Gross losses |
(84 | ) | | |||||
|
|
|
|
|
|||||
| Net losses on sale of a securities |
$ | (84 | ) | $ | | |||
|
|
|
|
|
|||||
| Income tax benefit attributable to realized net losses on sale of securities |
$ | 18 | $ | | ||||
|
|
|
|
|
|||||
The amortized cost and fair value of debt securities by contractual maturity at March 31, 2024 is as follows (dollars in thousands):
| Available for Sale | Held to Maturity | |||||||||||||||
| Amortized Cost |
Fair Value | Amortized Cost |
Fair Value | |||||||||||||
| Within one year |
$ | 109,545 | $ | 108,203 | $ | 8,893 | $ | 8,684 | ||||||||
| After one year through five years |
113,567 | 108,621 | 183,990 | 172,255 | ||||||||||||
| After five years through ten years |
36,179 | 32,963 | 111,079 | 97,709 | ||||||||||||
| Over ten years |
5,622 | 5,093 | 4,350 | 3,663 | ||||||||||||
|
|
|
|
|
|
|
|
|
|||||||||
| Total |
$ | 264,913 | $ | 254,880 | $ | 308,312 | $ | 282,311 | ||||||||
|
|
|
|
|
|
|
|
|
|||||||||
Expected maturities may differ from contractual maturities if borrowers have the right to call or repay obligations with or without prepayment penalties.
The following table shows the gross unrealized losses and fair value of the Companys AFS debt securities with unrealized losses aggregated by investment category and length of time that individual debt securities have been in a continuous unrealized loss position at March 31, 2024 and December 31, 2023 (dollars in thousands):
| March 31, 2024 | ||||||||||||||||||||||||
| Less Than Twelve Months |
Over Twelve Months | Total | ||||||||||||||||||||||
| Gross Unrealized Loss |
Fair Value |
Gross Unrealized Loss |
Fair Value | Gross Unrealized Loss |
Fair Value | |||||||||||||||||||
| Securities available for sale: |
||||||||||||||||||||||||
| U.S. government and federal agencies |
$ | (26 | ) | $ | 18,508 | $ | (2,730 | ) | $ | 71,548 | $ | (2,756 | ) | $ | 90,056 | |||||||||
| Mortgage backed securities |
| | (674 | ) | 8,362 | (674 | ) | 8,362 | ||||||||||||||||
| Corporate bonds |
(8 | ) | 2,456 | (1,660 | ) | 49,829 | (1,668 | ) | 52,285 | |||||||||||||||
| State and municipal securities |
(33 | ) | 8,752 | (4,910 | ) | 88,029 | (4,943 | ) | 96,781 | |||||||||||||||
|
|
|
|
|
|
|
|
|
|
|
|
|
|||||||||||||
| Total securities available for sale |
$ | (67 | ) | $ | 29,716 | $ | (9,974 | ) | $ | 217,768 | $ | (10,041 | ) | $ | 247,484 | |||||||||
|
|
|
|
|
|
|
|
|
|
|
|
|
|||||||||||||
F-10
Table of Contents
| December 31, 2023 | ||||||||||||||||||||||||
| Less Than Twelve Months |
Over Twelve Months | Total | ||||||||||||||||||||||
| Gross Unrealized Loss |
Fair Value | Gross Unrealized Loss |
Fair Value | Gross Unrealized Loss |
Fair Value | |||||||||||||||||||
| Securities available for sale: |
||||||||||||||||||||||||
| U.S. government and federal agencies |
$ | (16 | ) | $ | 5,860 | $ | (2,848 | ) | $ | 70,906 | $ | (2,864 | ) | $ | 76,766 | |||||||||
| Mortgage backed securities |
| | (609 | ) | 8,604 | (609 | ) | 8,604 | ||||||||||||||||
| Corporate bonds |
(3 | ) | 2,482 | (1,834 | ) | 51,987 | (1,837 | ) | 54,469 | |||||||||||||||
| State and municipal securities |
(31 | ) | 3,675 | (4,779 | ) | 89,828 | (4,810 | ) | 93,503 | |||||||||||||||
|
|
|
|
|
|
|
|
|
|
|
|
|
|||||||||||||
| Total securities available for sale |
$ | (50 | ) | $ | 12,017 | $ | (10,070 | ) | $ | 221,325 | $ | (10,120 | ) | $ | 233,342 | |||||||||
|
|
|
|
|
|
|
|
|
|
|
|
|
|||||||||||||
In the AFS portfolio, at March 31, 2024, 78 out of 79 debt securities of the U.S. government and federal agencies, 17 out of 21 mortgage backed securities, 112 out of 117 corporate bonds, and 293 out of 302 state and municipal securities were in an unrealized loss position. All of the Companys investment portfolio was evaluated under the monitoring process described in Note 1 of the audited consolidated financial statements for the year ended December 31, 2023, and all investments were deemed investment grade. All of the unrealized losses are attributed to changes in market interest rates, and are not a result of deterioration of creditworthiness among any of the issuers.
Of the total AFS and HTM portfolio, at March 31, 2024 and December 31, 2023, 894 and 880 debt securities had unrealized losses with aggregate impairment of 6.3% and 6.0%, respectively, of the Companys amortized cost basis. These unrealized losses related principally to interest rate movements and not the creditworthiness of the issuer. In analyzing an issuers financial condition, management considers whether the debt securities are issued by the federal government or its agencies, whether downgrades by bond rating agencies have occurred, and industry analysts reports. Credit loss allowances for the AFS and HTM portfolios are described in the following sections.
Allowance for Credit LossesAFS Securities
Management evaluates debt securities to determine whether the unrealized loss is due to credit-related factors or non-credit-related factors. This analysis occurs on at least a quarterly basis, and more frequently when economic or market concerns warrant such an evaluation. Consideration is given to the extent to which fair value is less than cost, the financial condition and near-term prospects of the issuer, and the intent and ability of the Company to retain its investment in the security for a period of time sufficient to allow for full recovery of its amortized cost. If the assessment reveals that a credit loss exists, the present value of the expected cash flows of the security is compared to the amortized cost basis of the security. If the present value of future cash flows expected to be collected is less than the amortized cost, an allowance for the credit loss is recorded. The loss is limited by the amount that the amortized cost exceeds fair value.
As of the reporting date, the Company did not intend to sell any of the AFS debt securities, did not expect to be required to sell these debt securities, and expected to recover the entire amortized cost basis of all of the debt securities.
The Company did not record an ACL on the AFS debt securities at March 31, 2024 and December 31, 2023. The Company has evaluated these debt securities for credit-related impairment at the reporting date and concluded that no impairment existed. In analyzing an issuers financial condition, management considers whether the debt securities are issued by the federal government or its agencies, whether downgrades by bond rating agencies have occurred, industry analysts reports, and correlations between fair value changes and interest rate changes among instruments that are not credit sensitive. All AFS debt securities were current with no debt securities past due or
F-11
Table of Contents
on non-accrual as of March 31, 2024 and December 31, 2023. The Company considers the unrealized losses on the debt securities as of March 31, 2024 and December 31, 2023 to be related to fluctuations in market conditions, primarily interest rates, and is not reflective of deterioration in credit.
The table below presents a rollforward by major security type of the allowance for credit losses on AFS debt securities for the three months ended March 31, 2024 and 2023 (dollars in thousands):
| March 31, 2024 | ||||||||||||||||||||
| U.S. government and federal agencies |
Mortgage backed securities |
Corporate bonds |
State and municipal securities |
Total AFS securities |
||||||||||||||||
| Allowance for credit losses: |
||||||||||||||||||||
| Beginning balance, December 31, 2023 |
$ | | $ | | $ | | $ | | $ | | ||||||||||
| Provision for (recapture of) credit losses |
| | (210 | ) | | (210 | ) | |||||||||||||
| Write offs charged against the allowance |
| | | | | |||||||||||||||
| Recoveries of amounts previously written off |
| | 210 | | 210 | |||||||||||||||
|
|
|
|
|
|
|
|
|
|
|
|||||||||||
| Ending balance, March 31, 2024 |
$ | | $ | | $ | | $ | | $ | | ||||||||||
|
|
|
|
|
|
|
|
|
|
|
|||||||||||
At March 31, 2024, there was no allowance for credit losses on AFS debt securities recorded. During the three months ended March 31, 2024, the Bank received proceeds totaling $210 thousand for a bond that was fully charged off during 2023, and recorded a recovery of credit loss.
| March 31, 2023 | ||||||||||||||||||||
| U.S. government and federal agencies |
Mortgage backed securities |
Corporate bonds |
State and municipal securities |
Total AFS securities |
||||||||||||||||
| Allowance for credit losses: |
||||||||||||||||||||
| Beginning balance, December 31, 2022 |
$ | | $ | | $ | | $ | | $ | | ||||||||||
| Impact of adopting ASC 326 |
| | | | | |||||||||||||||
| Provision for credit losses |
| | 785 | | 785 | |||||||||||||||
| Write offs charged against the allowance |
| | (785 | ) | | (785 | ) | |||||||||||||
| Recoveries of amounts previously written off |
| | | | | |||||||||||||||
|
|
|
|
|
|
|
|
|
|
|
|||||||||||
| Ending balance, March 31, 2023 |
$ | | $ | | $ | | $ | | $ | | ||||||||||
|
|
|
|
|
|
|
|
|
|
|
|||||||||||
At March 31, 2023, there was no allowance for credit losses on AFS debt securities recorded. The ACL provision recorded for the AFS portfolio during 2023 pertained to a holding from a single corporate issuer whose business was ultimately closed by a regulatory authority. The bond, initially classified as HTM, was transferred to the AFS portfolio based on the unlikely collectability of the unsecured bond and significant documented credit deterioration. A portion of the bond was subsequently sold at a loss, and the remaining unsold portion was written off entirely.
Credit Quality Indicators and Allowance for Credit LossesHTM Securities
The Company evaluates the credit risk of its HTM debt securities on at least a quarterly basis. The Company estimates expected credit losses on HTM debt securities using an instrument-level process described in Note 1 of the audited consolidated financial statements for the year ended December 31, 2023. The primary indicators of credit quality for the Companys HTM portfolio are security type, time remaining to maturity, and credit rating. Credit ratings may be influenced by a number of factors included obligor cash flows, geography, seniority and others. The HTM portfolio includes debt securities issued by the U.S. Treasury and agencies of the federal government, and mortgage-backed securities issued by government agencies. These types of investments carry implicit or explicit backing of the U.S. Treasury, and therefore are deemed to carry no credit risk for purposes of the ACL evaluation.
F-12
Table of Contents
The following table presents the amortized cost of HTM debt securities as of March 31, 2024 and December 31, 2023 by security type and credit rating (dollars in thousands):
| March 31, 2024 | ||||||||||||||||||||
| U.S. government and federal agency |
Agency mortgage backed securities |
Corporate bonds |
State and municipal securities |
Total HTM securities |
||||||||||||||||
| AAA / AA / A |
$ | 123,941 | $ | 1,184 | $ | 19,035 | $ | 123,143 | $ | 267,303 | ||||||||||
| BBB / BB / B |
| | 40,527 | 482 | 41,009 | |||||||||||||||
|
|
|
|
|
|
|
|
|
|
|
|||||||||||
| Total |
$ | 123,941 | $ | 1,184 | $ | 59,562 | $ | 123,625 | $ | 308,312 | ||||||||||
|
|
|
|
|
|
|
|
|
|
|
|||||||||||
| December 31, 2023 | ||||||||||||||||||||
| U.S. government and federal agency |
Agency mortgage backed securities |
Corporate bonds |
State and municipal securities |
Total HTM securities |
||||||||||||||||
| AAA / AA / A |
$ | 123,938 | $ | 1,190 | $ | 20,091 | $ | 123,168 | $ | 268,387 | ||||||||||
| BBB / BB / B |
| | 39,538 | 481 | 40,019 | |||||||||||||||
|
|
|
|
|
|
|
|
|
|
|
|||||||||||
| Total |
$ | 123,938 | $ | 1,190 | $ | 59,629 | $ | 123,649 | $ | 308,406 | ||||||||||
|
|
|
|
|
|
|
|
|
|
|
|||||||||||
The following table summarizes the change in the allowance for credit losses on held to maturity debt securities for the three months ended March 31, 2024 and 2023 (dollars in thousands):
| March 31, 2024 | ||||||||||||||||||||
| U.S. government and federal agency |
Agency mortgage backed securities |
Corporate bonds |
State and municipal securities |
Total HTM securities |
||||||||||||||||
| Allowance for credit losses: |
||||||||||||||||||||
| Beginning balance, December 31, 2023 |
$ | | $ | | $ | 322 | $ | 26 | $ | 348 | ||||||||||
| Provision for credit losses |
| | 3 | 8 | 11 | |||||||||||||||
| Write offs charged against the allowance |
| | | | | |||||||||||||||
| Recoveries of amounts previously written off |
| | | | | |||||||||||||||
|
|
|
|
|
|
|
|
|
|
|
|||||||||||
| Ending balance, March 31, 2024 |
$ | | $ | | $ | 325 | $ | 34 | $ | 359 | ||||||||||
|
|
|
|
|
|
|
|
|
|
|
|||||||||||
| March 31, 2023 | ||||||||||||||||||||
| U.S. government and federal agencies |
Mortgage backed securities |
Corporate bonds |
State and municipal securities |
Total HTM securities |
||||||||||||||||
| Allowance for credit losses: |
||||||||||||||||||||
| Beginning balance, December 31, 2022 |
$ | | $ | | $ | | $ | | $ | | ||||||||||
| Impact of adopting ASC 326 |
| | 325 | 4 | 329 | |||||||||||||||
| Provision for credit losses |
| | 13 | | 13 | |||||||||||||||
| Write offs charged against the allowance |
| | | | | |||||||||||||||
| Recoveries of amounts previously written off |
| | | | | |||||||||||||||
|
|
|
|
|
|
|
|
|
|
|
|||||||||||
| Ending balance, March 31, 2023 |
$ | | $ | | $ | 338 | $ | 4 | $ | 342 | ||||||||||
|
|
|
|
|
|
|
|
|
|
|
|||||||||||
At March 31, 2024, the Company had no HTM debt securities that were 30 days or more past due as to principal and interest payments. The Company had no debt securities held to maturity classified as non-accrual as of March 31, 2024.
F-13
Table of Contents
Equity Securities
The Company reported a fair value loss of $4 thousand and a fair value gain of $8 thousand in its equity security holding during the three month periods ended March 31, 2024 and 2023, respectively. The gain and loss were reflected in the other income component of noninterest income on the consolidated statements of income.
Note 3. Loans and Allowance for Loan Credit Losses
A summary of the composition of the loan portfolio at March 31, 2024 and December 31, 2023 (dollars in thousands):
| March 31, 2024 | December 31, 2023 | |||||||
| Commercial real estate |
$ | 59,527 | $ | 60,138 | ||||
| Commercial |
11,795 | 12,438 | ||||||
| Residential real estate closed-end |
213,015 | 210,358 | ||||||
| Other consumer loans |
20,930 | 21,210 | ||||||
|
|
|
|
|
|||||
| 305,267 | 304,144 | |||||||
| Less allowance for credit losses |
(4,324 | ) | (4,319 | ) | ||||
|
|
|
|
|
|||||
| Loans, net |
$ | 300,943 | $ | 299,825 | ||||
|
|
|
|
|
|||||
Overdrafts totaling $770 thousand and $10 thousand at March 31, 2024 and December 31, 2023, respectively, were reclassified from deposits to loans.
The totals above include deferred costs (net of deferred fees) of $480 thousand at March 31, 2024 and $466 thousand at December 31, 2023.
The following table presents the activity in the allowance for credit losses by portfolio segment for the three months ended March 31, 2024 and 2023 (dollars in thousands):
| Commercial Real Estate |
Commercial | Residential Real Estate Closed-End |
Other Consumer Loans |
Total | ||||||||||||||||
| Allowance for credit losses: |
||||||||||||||||||||
| Beginning balance, December 31, 2023 |
$ | 1,233 | $ | 189 | $ | 2,668 | $ | 229 | $ | 4,319 | ||||||||||
| Provision for (recapture of) credit losses |
(16 | ) | (12 | ) | 13 | 20 | 5 | |||||||||||||
| Loans charged-off |
| | | | | |||||||||||||||
| Recoveries collected |
| | | | | |||||||||||||||
|
|
|
|
|
|
|
|
|
|
|
|||||||||||
| Ending balance, March 31, 2024 |
$ | 1,217 | $ | 177 | $ | 2,681 | $ | 249 | $ | 4,324 | ||||||||||
|
|
|
|
|
|
|
|
|
|
|
|||||||||||
| Allowance for credit losses: |
||||||||||||||||||||
| Beginning balance, December 31, 2022 |
$ | 905 | $ | 573 | $ | 2,650 | $ | 354 | $ | 4,482 | ||||||||||
| Impact of adopting ASC 326 |
130 | 19 | (16 | ) | (133 | ) | | |||||||||||||
| Provision for (recapture of) credit losses |
104 | (305 | ) | 202 | (24 | ) | (23 | ) | ||||||||||||
| Loans charged-off |
| | | | | |||||||||||||||
| Recoveries collected |
| | | | | |||||||||||||||
|
|
|
|
|
|
|
|
|
|
|
|||||||||||
| Ending balance, March 31, 2023 |
$ | 1,139 | $ | 287 | $ | 2,836 | $ | 197 | $ | 4,459 | ||||||||||
|
|
|
|
|
|
|
|
|
|
|
|||||||||||
There were no nonaccrual loans, loans 90 days past due and still accruing, or past due for 30 or more days as of March 31, 2024 and December 31, 2023.
F-14
Table of Contents
The Company categorizes loans into risk categories based on relevant information about the ability of borrowers to service their debt such as: current financial information, historical payment experience, credit documentation, public information and current economic trends, among other factors. The Companys loan risk grading system and ongoing monitoring process is discussed in Note 1 of the audited consolidated financial statements for the year ended December 31, 2023. The following table presents the outstanding balance of the loan portfolio, by year of origination, loan classification, and credit quality, as of March 31, 2024 and December 31, 2023 (dollars in thousands):
| March 31, 2024 | Term Loans by Year of Origination | Revolving Loans |
Revolving to Term Loans |
Total | ||||||||||||||||||||||||||||||||
| 2024 | 2023 | 2022 | 2021 | 2020 | Prior | |||||||||||||||||||||||||||||||
| Commercial real estate |
||||||||||||||||||||||||||||||||||||
| Pass |
$ | | $ | 1,348 | $ | 5,500 | $ | 9,207 | $ | 3,649 | $ | 27,891 | $ | | $ | 10,014 | $ | 57,609 | ||||||||||||||||||
| Special Mention |
| | | | | 1,555 | | | 1,555 | |||||||||||||||||||||||||||
| Substandard |
| | | | | 363 | | | 363 | |||||||||||||||||||||||||||
| Doubtful |
| | | | | | | | | |||||||||||||||||||||||||||
| Loss |
| | | | | | | | | |||||||||||||||||||||||||||
|
|
|
|
|
|
|
|
|
|
|
|
|
|
|
|
|
|
|
|||||||||||||||||||
| Total |
$ | | $ | 1,348 | $ | 5,500 | $ | 9,207 | $ | 3,649 | $ | 29,809 | $ | | $ | 10,014 | $ | 59,527 | ||||||||||||||||||
|
|
|
|
|
|
|
|
|
|
|
|
|
|
|
|
|
|
|
|||||||||||||||||||
| Current period gross charge-offs |
$ | | $ | | $ | | $ | | $ | | $ | | $ | | $ | | $ | | ||||||||||||||||||
|
|
|
|
|
|
|
|
|
|
|
|
|
|
|
|
|
|
|
|||||||||||||||||||
| Commercial |
||||||||||||||||||||||||||||||||||||
| Pass |
$ | 150 | $ | | $ | 568 | $ | 13 | $ | 29 | $ | 1,532 | $ | 9,503 | $ | | $ | 11,795 | ||||||||||||||||||
| Special Mention |
| | | | | | | | | |||||||||||||||||||||||||||
| Substandard |
| | | | | | | | | |||||||||||||||||||||||||||
| Doubtful |
| | | | | | | | | |||||||||||||||||||||||||||
| Loss |
| | | | | | | | | |||||||||||||||||||||||||||
|
|
|
|
|
|
|
|
|
|
|
|
|
|
|
|
|
|
|
|||||||||||||||||||
| Total |
$ | 150 | $ | | $ | 568 | $ | 13 | $ | 29 | $ | 1,532 | $ | 9,503 | $ | | $ | 11,795 | ||||||||||||||||||
|
|
|
|
|
|
|
|
|
|
|
|
|
|
|
|
|
|
|
|||||||||||||||||||
| Current period gross charge-offs |
$ | | $ | | $ | | $ | | $ | | $ | | $ | | $ | | $ | | ||||||||||||||||||
|
|
|
|
|
|
|
|
|
|
|
|
|
|
|
|
|
|
|
|||||||||||||||||||
| Residential real estate closed-end |
||||||||||||||||||||||||||||||||||||
| Pass |
$ | 7,629 | $ | 19,796 | $ | 45,596 | $ | 45,042 | $ | 24,837 | $ | 69,875 | $ | | $ | | $ | 212,775 | ||||||||||||||||||
| Special Mention |
| | | | | | | | | |||||||||||||||||||||||||||
| Substandard |
| | | | | 240 | | | 240 | |||||||||||||||||||||||||||
| Doubtful |
| | | | | | | | | |||||||||||||||||||||||||||
| Loss |
| | | | | | | | | |||||||||||||||||||||||||||
|
|
|
|
|
|
|
|
|
|
|
|
|
|
|
|
|
|
|
|||||||||||||||||||
| Total |
$ | 7,629 | $ | 19,796 | $ | 45,596 | $ | 45,042 | $ | 24,837 | $ | 70,115 | $ | | $ | | $ | 213,015 | ||||||||||||||||||
|
|
|
|
|
|
|
|
|
|
|
|
|
|
|
|
|
|
|
|||||||||||||||||||
| Current period gross charge-offs |
$ | | $ | | $ | | $ | | $ | | $ | | $ | | $ | | $ | | ||||||||||||||||||
|
|
|
|
|
|
|
|
|
|
|
|
|
|
|
|
|
|
|
|||||||||||||||||||
| Other consumer loans |
||||||||||||||||||||||||||||||||||||
| Pass |
$ | | $ | | $ | 25 | $ | | $ | | $ | | $ | 17,288 | $ | 3,617 | $ | 20,930 | ||||||||||||||||||
| Special Mention |
| | | | | | | | | |||||||||||||||||||||||||||
| Substandard |
| | | | | | | | | |||||||||||||||||||||||||||
| Doubtful |
| | | | | | | | | |||||||||||||||||||||||||||
| Loss |
| | | | | | | | | |||||||||||||||||||||||||||
|
|
|
|
|
|
|
|
|
|
|
|
|
|
|
|
|
|
|
|||||||||||||||||||
| Total |
$ | | $ | | $ | 25 | $ | | $ | | $ | | $ | 17,288 | $ | 3,617 | $ | 20,930 | ||||||||||||||||||
|
|
|
|
|
|
|
|
|
|
|
|
|
|
|
|
|
|
|
|||||||||||||||||||
| Current period gross charge-offs |
$ | | $ | | $ | | $ | | $ | | $ | | $ | | $ | | $ | | ||||||||||||||||||
|
|
|
|
|
|
|
|
|
|
|
|
|
|
|
|
|
|
|
|||||||||||||||||||
F-15
Table of Contents
| March 31, 2023 | Term Loans by Year of Origination | Revolving Loans |
Revolving to Term Loans |
Total | ||||||||||||||||||||||||||||||||
| 2023 | 2022 | 2021 | 2020 | 2019 | Prior | |||||||||||||||||||||||||||||||
| Commercial real estate |
||||||||||||||||||||||||||||||||||||
| Pass |
$ | 849 | $ | 5,521 | $ | 9,327 | $ | 3,713 | $ | 8,015 | $ | 21,875 | $ | | $ | 8,895 | $ | 58,195 | ||||||||||||||||||
| Special Mention |
| | | | | 1,570 | | | 1,570 | |||||||||||||||||||||||||||
| Substandard |
| | | | | 373 | | | 373 | |||||||||||||||||||||||||||
| Doubtful |
| | | | | | | | | |||||||||||||||||||||||||||
| Loss |
| | | | | | | | | |||||||||||||||||||||||||||
|
|
|
|
|
|
|
|
|
|
|
|
|
|
|
|
|
|
|
|||||||||||||||||||
| Total |
$ | 849 | $ | 5,521 | $ | 9,327 | $ | 3,713 | $ | 8,015 | $ | 23,818 | $ | | $ | 8,895 | $ | 60,138 | ||||||||||||||||||
|
|
|
|
|
|
|
|
|
|
|
|
|
|
|
|
|
|
|
|||||||||||||||||||
| Current period gross charge-offs |
$ | | $ | | $ | | $ | | $ | | $ | | $ | | $ | | $ | | ||||||||||||||||||
|
|
|
|
|
|
|
|
|
|
|
|
|
|
|
|
|
|
|
|||||||||||||||||||
| Commercial |
||||||||||||||||||||||||||||||||||||
| Pass |
$ | | $ | 573 | $ | 14 | $ | 42 | $ | 1,352 | $ | 309 | $ | 10,148 | $ | | $ | 12,438 | ||||||||||||||||||
| Special Mention |
| | | | | | | | | |||||||||||||||||||||||||||
| Substandard |
| | | | | | | | | |||||||||||||||||||||||||||
| Doubtful |
| | | | | | | | | |||||||||||||||||||||||||||
| Loss |
| | | | | | | | | |||||||||||||||||||||||||||
|
|
|
|
|
|
|
|
|
|
|
|
|
|
|
|
|
|
|
|||||||||||||||||||
| Total |
$ | | $ | 573 | $ | 14 | $ | 42 | $ | 1,352 | $ | 309 | $ | 10,148 | $ | | $ | 12,438 | ||||||||||||||||||
|
|
|
|
|
|
|
|
|
|
|
|
|
|
|
|
|
|
|
|||||||||||||||||||
| Current period gross charge-offs |
$ | | $ | | $ | | $ | | $ | | $ | | $ | | $ | | $ | | ||||||||||||||||||
|
|
|
|
|
|
|
|
|
|
|
|
|
|
|
|
|
|
|
|||||||||||||||||||
| Residential real estate closed end |
||||||||||||||||||||||||||||||||||||
| Pass |
$ | 20,230 | $ | 45,920 | $ | 45,528 | $ | 25,150 | $ | 18,035 | $ | 55,253 | $ | | $ | | $ | 210,116 | ||||||||||||||||||
| Special Mention |
| | | | | | | | | |||||||||||||||||||||||||||
| Substandard |
| | | | | 242 | | | 242 | |||||||||||||||||||||||||||
| Doubtful |
| | | | | | | | | |||||||||||||||||||||||||||
| Loss |
| | | | | | | | | |||||||||||||||||||||||||||
|
|
|
|
|
|
|
|
|
|
|
|
|
|
|
|
|
|
|
|||||||||||||||||||
| Total |
$ | 20,230 | $ | 45,920 | $ | 45,528 | $ | 25,150 | $ | 18,035 | $ | 55,495 | $ | | $ | | $ | 210,358 | ||||||||||||||||||
|
|
|
|
|
|
|
|
|
|
|
|
|
|
|
|
|
|
|
|||||||||||||||||||
| Current period gross charge-offs |
$ | | $ | | $ | | $ | | $ | | $ | | $ | | $ | | $ | | ||||||||||||||||||
|
|
|
|
|
|
|
|
|
|
|
|
|
|
|
|
|
|
|
|||||||||||||||||||
| Other consumer loans |
||||||||||||||||||||||||||||||||||||
| Pass |
$ | | $ | | $ | 32 | $ | | $ | | $ | | $ | 17,703 | $ | 3,475 | $ | 21,210 | ||||||||||||||||||
| Special Mention |
| | | | | | | | | |||||||||||||||||||||||||||
| Substandard |
| | | | | | | | | |||||||||||||||||||||||||||
| Doubtful |
| | | | | | | | | |||||||||||||||||||||||||||
| Loss |
| | | | | | | | | |||||||||||||||||||||||||||
|
|
|
|
|
|
|
|
|
|
|
|
|
|
|
|
|
|
|
|||||||||||||||||||
| Total |
$ | | $ | | $ | 32 | $ | | $ | | $ | | $ | 17,703 | $ | 3,475 | $ | 21,210 | ||||||||||||||||||
|
|
|
|
|
|
|
|
|
|
|
|
|
|
|
|
|
|
|
|||||||||||||||||||
| Current period gross charge-offs |
$ | | $ | | $ | | $ | | $ | | $ | | $ | | $ | | $ | | ||||||||||||||||||
|
|
|
|
|
|
|
|
|
|
|
|
|
|
|
|
|
|
|
|||||||||||||||||||
Collateral Dependent Loans
FASB ASC Topic 326 describes a collateral-dependent asset as a financial asset for which the repayment is expected to be provided substantially through the operation or sale of the collateral when the borrower, based on managements assessment, is experiencing financial difficulty as of the reporting date. Whether the underlying collateral is expected to be a substantial source of repayment for an asset depends on the availability, reliability, and capacity of sources other than the collateral to repay the debt. Collateral-dependent loans are individually evaluated for expected credit losses as of the reporting date, and they are removed from their respective pools of collectively evaluated assets. Expected credit losses for these types of assets are based on the fair value of the collateral at the measurement date, adjusted for estimated selling costs. There were no collateral-dependent loans that were individually evaluated for purposes of determining the allowance for credit loss under FASB ASC Topic 326 as of March 31, 2024 and December 31, 2023.
F-16
Table of Contents
Modifications to Borrowers Experiencing Financial Difficulty
Occasionally, the Company modifies loans to borrowers in financial distress by providing principal forgiveness, term extension, and other-than-insignificant payment delay or interest rate reduction. When principal forgiveness is provided, the amount of forgiveness is charged-off against the allowance for credit losses. During the periods reported, there were no loan modifications provided to borrowers exhibiting financial distress. During the three months ended March 31, 2024 and 2023, there were no payment defaults from loans which had been modified due to the borrower experiencing financial difficulty during the twelve months preceding the modification.
Related Party Loan Transactions
Officers, directors and their affiliates had credit outstanding of $6.9 million as of March 31, 2024 and December 31, 2023, with the Company. These transactions occurred in the ordinary course of business on substantially the same terms as those prevailing at the time for comparable transactions with unrelated persons.
Note 4. Deposits
The Bank held no deposits classified as brokered as of March 31, 2024 and December 31, 2023. To achieve full FDIC insurance, some of the Banks depositors have enrolled in the Intrafi Cash Service® (ICS®) program offered by the Bank through the Intrafi network. When accounts are enrolled in this service, the Bank must elect, for each account, whether it will receive a reciprocal deposit balance or sell the deposit balance. At March 31, 2024 and December 31, 2023, the Bank held $99.3 million and $177.3 million, respectively, of reciprocal deposits through ICS® on its consolidated balance sheets. Accounts that are sold to the network are excluded from the Companys consolidated balance sheets. The Company receives fee income for sold accounts, which is included in deposit placement services income on the consolidated statements of income.
FDIC deposit insurance covers $250 thousand per depositor, per FDIC-insured bank, for each account ownership category. The Company estimates uninsured deposits held at the Bank as of March 31, 2024 are $744.6 million, which is 65.6% of total deposits. The Company estimates uninsured deposits as of December 31, 2023 are $648.0 million, which is 58.3% of total deposits.
There was one client with an individual deposit balance exceeding 5.0% of total deposits as of March 31, 2024. The total deposit balance related to this client as of March 31, 2024 was $64.8 million or 5.7% of total deposits. There were no clients whose individual deposit balances exceeded 5.0% of total deposits as of December 31, 2023.
Note 5. Fair Value Measurements
Determination of Fair Value
Fair value is defined as the exchange price that would be received for an asset or paid to transfer a liability (an exit price) in the principal or most advantageous market for the asset or liability in an orderly transaction between market participants on the measurement date. The fair value measurements and disclosure topic specifies a hierarchy of valuation techniques based on whether the inputs to these valuation techniques are observable or unobservable. Observable inputs reflect market data obtained from independent sources, while unobservable inputs reflect the Companys market assumptions. U.S. GAAP requires that valuation techniques maximize the use of observable inputs and minimize the use of unobservable inputs.
Fair Value Hierarchy
U.S. GAAP establishes a fair value hierarchy which categorizes the valuation inputs into three broad levels. Based on the underlying inputs, each fair value measurement in its entirety is reported in one of the three levels. These levels are:
Level 1Valuation is based on quoted prices in active markets for identical assets and liabilities that the reporting entity has the ability to access at the measurement date. Level 1 assets and liabilities generally
F-17
Table of Contents
include debt and equity securities that are traded in an active exchange market. Valuations are obtained from readily available pricing sources for market transactions involving identical assets or liabilities.
Level 2Valuation is based on inputs other than quoted prices included within Level 1 that are observable for the asset or liability, either directly or indirectly. The valuation may be based on quoted prices for similar assets or liabilities; quoted prices in markets that are not active; or other inputs that are observable or can be corroborated by observable market data for substantially the full term of the asset or liability.
Level 3Valuation is based on unobservable inputs that are supported by little or no market activity and that are significant to the fair value of the assets or liabilities. Level 3 assets and liabilities include financial instruments whose value is determined using pricing models, discounted cash flow methodologies, or similar techniques, as well as instruments for which determination of fair value requires significant management judgment or estimation.
An asset or liabilitys categorization within the valuation hierarchy is based upon the lowest level of input that is significant to the fair value measurement.
Assets and Liabilities Measured at Fair Value on a Recurring Basis
The following describes the valuation techniques used by the Company to measure certain financial assets and liabilities recorded at fair value on a recurring basis in the financial statements:
Securities Available for Sale & Equity Securities
Debt securities available for sale and equity securities are recorded at fair value on a recurring basis. Fair value measurement is based upon quoted market prices, when available (Level 1). If quoted market prices are not available, fair values are measured utilizing independent valuation techniques of identical or similar securities for which significant assumptions are derived primarily from or corroborated by observable market data (Level 2). If the inputs used to provide the evaluation for certain securities are unobservable and/or there is little, if any, market activity then the security would fall to the lowest level of the hierarchy (Level 3).
The Companys investment portfolio is valued using fair value measurements that are considered to be Level 1 or Level 2, but may also use Level 3 measurements if required by the composition of the portfolio. The Bank has contracted with a securities portfolio accounting service provider for valuation of its securities portfolio. Most security types are priced using the securities accounting providers internally developed pricing software which appraises securities from an online real-time database. Subscription pricing services such as ICE Data Services and Bloomberg Valuation Services may be used to supplement the internal pricing system for security types where the underlying collateral, cash flow projections or trade data is not readily available. If Level 1 or Level 2 inputs are not available, the software may rely upon a discounted cash flow analysis based on the net present value of a securitys projected cash flow to arrive at fair market value. Valuations for direct obligations of the U.S. Treasury, exchange listed stock and preferred stock are obtained from on-line real-time databases.
The securities accounting service provider utilizes proprietary valuation matrices for valuing all municipal securities. The initial curves for determining the price, movement, and yield relationships within the municipal matrices are derived from industry benchmark curves or sourced from a municipal trading desk. The securities are further broken down according to issuer, credit support, state of issuance and rating to incorporate additional spreads to the industry benchmark curves.
F-18
Table of Contents
The following table presents the balances of financial assets measured at fair value on a recurring basis (dollars in thousands):
| Balances | Fair Value Measurements Using | |||||||||||||||
| Financial Assets |
Level 1 | Level 2 | Level 3 | |||||||||||||
| As of March 31, 2024: |
||||||||||||||||
| Available for sale securities: |
||||||||||||||||
| U.S. government and federal agencies |
$ | 91,592 | $ | 79,617 | $ | 11,975 | $ | | ||||||||
| Mortgage backed securities |
8,396 | | 8,396 | | ||||||||||||
| Corporate bonds |
54,791 | 483 | 54,308 | | ||||||||||||
| State and municipal securities |
100,101 | | 100,101 | | ||||||||||||
|
|
|
|
|
|
|
|
|
|||||||||
| Total available for sale securities |
$ | 254,880 | $ | 80,100 | $ | 174,780 | $ | | ||||||||
| Mutual and exchange-traded funds |
504 | 504 | | | ||||||||||||
|
|
|
|
|
|
|
|
|
|||||||||
| Total |
$ | 255,384 | $ | 80,604 | $ | 174,780 | $ | | ||||||||
|
|
|
|
|
|
|
|
|
|||||||||
| As of December 31, 2023: |
||||||||||||||||
| Available for sale securities: |
||||||||||||||||
| U.S. government and federal agencies |
$ | 92,297 | $ | 78,817 | $ | 13,480 | $ | | ||||||||
| Mortgage backed securities |
8,649 | | 8,649 | | ||||||||||||
| Corporate bonds |
55,472 | 475 | 54,997 | | ||||||||||||
| State and municipal securities |
101,696 | | 101,696 | | ||||||||||||
|
|
|
|
|
|
|
|
|
|||||||||
| Total available for sale securities |
$ | 258,114 | $ | 79,292 | $ | 178,822 | $ | | ||||||||
| Mutual and exchange-traded funds |
505 | 505 | | | ||||||||||||
|
|
|
|
|
|
|
|
|
|||||||||
| Total |
$ | 258,619 | $ | 79,797 | $ | 178,822 | $ | | ||||||||
|
|
|
|
|
|
|
|
|
|||||||||
Assets Measured at Fair Value on a Non-recurring Basis
Certain assets are measured at fair value on a nonrecurring basis in accordance with generally accepted accounting principles. Adjustments to the fair value of these assets usually result from the application of lower-of-cost-or-market accounting or write-downs of individual assets.
Collateral Dependent Loans
Upon the adoption of CECL, individually evaluated loans are analyzed to determine whether they are collateral dependent. Any individually evaluated loans, which are deemed to be collateral dependent, with an allocation to the ACL are measured at fair value on a non-recurring basis. Any fair value adjustments are recorded in the period incurred as provision for credit losses on the consolidated statements of income.
The measurement of loss associated with collateral dependent loans can be based on either the observable market price of the loan or fair value of the collateral. Fair value is measured based on the value of the collateral securing the loans. Collateral may be in the form of real estate or business assets including equipment, inventory, and accounts receivable. The vast majority of the collateral is real estate. The value of real estate collateral is determined utilizing a market valuation approach based on an appraisal conducted by an independent, licensed appraiser outside of the Company using observable market data (Level 2). However, if the collateral is a house or building in the process of construction or if an appraisal of the real estate property using an income approach or is over two years old, then the fair value is considered Level 3. The value of business equipment is based upon an outside appraisal if deemed significant, or the net book value on the applicable businesss financial statements if not considered significant using observable market data. Likewise, values for inventory and accounts receivables collateral are based on financial statement balances or aging reports (Level 3). Any fair value adjustments are recorded in the period incurred as a provision for loan credit losses on the consolidated statements of income. There were no collateral dependent loans with a recorded reserve as of March 31, 2024 and December 31, 2023.
F-19
Table of Contents
Other Real Estate Owned
Other real estate owned (OREO) is measured at fair value less costs to sell. Valuation of OREO is determined using current appraisals from independent parties, a Level 2 input. If current appraisals cannot be obtained, or if declines in value are identified after a recent appraisal is received, appraisal values may be discounted, resulting in a Level 3 estimate. If the Company markets the property with a realtor, estimated selling costs reduce the fair value, resulting in a valuation based on Level 3 inputs. Fair value adjustments are recorded in the period incurred and expensed against current earnings. The Bank held no OREO at March 31, 2024 and December 31, 2023.
There were no assets measured at fair value on a nonrecurring basis at March 31, 2024 and December 31, 2023.
Fair Value of Financial Instruments
The following tables present the carrying value and estimated fair value including the level within the fair value hierarchy of the Companys financial instruments as of March 31, 2024 and December 31, 2023 (dollars in thousands):
| Carrying Amount |
Fair Value Measurements Using | Total Fair Value |
||||||||||||||||||
| Level 1 | Level 2 | Level 3 | ||||||||||||||||||
| As of March 31, 2024: |
||||||||||||||||||||
| Financial assets: |
||||||||||||||||||||
| Cash and due from banks |
$ | 346,305 | $ | 346,305 | $ | | $ | | $ | 346,305 | ||||||||||
| Securities available for sale |
254,880 | 80,100 | 174,780 | | 254,880 | |||||||||||||||
| Securities held to maturity |
307,953 | 105,874 | 176,436 | | 282,310 | |||||||||||||||
| Equity securities |
504 | 504 | | | 504 | |||||||||||||||
| Restricted securities |
2,736 | | 2,736 | | 2,736 | |||||||||||||||
| Loans, net |
300,943 | | | 279,351 | 279,351 | |||||||||||||||
| Accrued Interest Receivable |
4,974 | | 4,974 | | 4,974 | |||||||||||||||
| Financial liabilities: |
||||||||||||||||||||
| Demand and savings deposits |
$ | 1,120,162 | $ | | $ | 833,359 | $ | 262,044 | $ | 1,095,403 | ||||||||||
| Time deposits |
15,593 | | | 15,466 | 15,466 | |||||||||||||||
| Short term borrowings |
5,000 | | 5,000 | | 5,000 | |||||||||||||||
| Accrued interest payable |
76 | | 76 | | 76 | |||||||||||||||
| As of December 31, 2023: |
||||||||||||||||||||
| Financial assets: |
||||||||||||||||||||
| Cash and due from banks |
$ | 316,767 | $ | 316,767 | $ | | $ | | $ | 316,767 | ||||||||||
| Securities available for sale |
258,114 | 79,292 | 178,822 | | 258,114 | |||||||||||||||
| Securities held to maturity |
308,058 | 106,837 | 177,079 | | 283,916 | |||||||||||||||
| Equity securities |
505 | 505 | | | 505 | |||||||||||||||
| Restricted securities |
2,613 | | 2,613 | | 2,613 | |||||||||||||||
| Loans, net |
299,825 | | | 280,352 | 280,352 | |||||||||||||||
| Accrued Interest Receivable |
4,354 | | 4,354 | | 4,354 | |||||||||||||||
| Financial liabilities: |
||||||||||||||||||||
| Demand and savings deposits |
$ | 1,095,283 | $ | | $ | 766,933 | $ | 299,765 | $ | 1,066,698 | ||||||||||
| Time deposits |
16,742 | | | 16,600 | 16,600 | |||||||||||||||
| Short term borrowings |
5,000 | | 5,000 | | 5,000 | |||||||||||||||
| Accrued interest payable |
61 | | 61 | | 61 | |||||||||||||||
F-20
Table of Contents
Note 6. Accumulated Other Comprehensive Income (Loss)
The following table presents the changes in each component in accumulated other comprehensive income (loss), net of tax for the years ended March 31, 2024 and 2023 (dollars in thousands):
| Unrealized Gain (Loss) on Available for Sale Securities |
Unrealized Gain (Loss) on Securities Transferred from Available for Sale to Held to Maturity |
Accumulated Other Comprehensive Income (Loss) |
||||||||||
| Balance at December 31, 2022 |
$ | (13,135 | ) | $ | (4,513 | ) | $ | (17,648 | ) | |||
| Unrealized holding gains, net of tax of $758 |
2,786 | | 2,786 | |||||||||
| Amortization of unrealized holding losses, net of tax of $57 |
| 215 | 215 | |||||||||
| Reclassification adjustment, net of tax of $18 |
66 | | 66 | |||||||||
|
|
|
|
|
|
|
|||||||
| Balance at March 31, 2023 |
$ | (10,283 | ) | $ | (4,298 | ) | $ | (14,581 | ) | |||
|
|
|
|
|
|
|
|||||||
| Balance at December 31, 2023 |
$ | (7,931 | ) | $ | (3,634 | ) | $ | (11,565 | ) | |||
| Unrealized holding gains, net of tax of $1 |
5 | | 5 | |||||||||
| Amortization of unrealized holding losses, net of tax of $61 |
| 230 | 230 | |||||||||
|
|
|
|
|
|
|
|||||||
| Balance at March 31, 2024 |
$ | (7,926 | ) | $ | (3,404 | ) | $ | (11,330 | ) | |||
|
|
|
|
|
|
|
|||||||
No amounts were reclassified out of accumulated other comprehensive income for the period ending March 31, 2024.
The following table presents the amounts reclassified out of accumulated other comprehensive income (loss), net of tax for the period ending March 31, 2023 (dollars in thousands):
| March 31, 2023 |
Line Item in the Consolidated |
|||||
| Securities available for sale |
||||||
| Net securities loss reclassified into earnings |
$ | (84 | ) | Net losses on sales of available for sale securities | ||
| Related income tax benefit expense |
18 | Income tax expense | ||||
|
|
|
|||||
| Total reclassifications into net income |
$ | (66 | ) | Net of tax |
||
|
|
|
|||||
F-21
Table of Contents

Report of Independent Registered Public Accounting Firm
To the Stockholders and the Board of Directors of Chain Bridge Bancorp, Inc.
Opinion on the Financial Statements
We have audited the accompanying consolidated balance sheets of Chain Bridge Bancorp, Inc. and its subsidiary (the Company) as of December 31, 2023 and 2022, the related consolidated statements of income, comprehensive income (loss), changes in stockholders equity, and cash flows for each of the years then ended, and the related notes to the consolidated financial statements (collectively, the financial statements). In our opinion, the financial statements present fairly, in all material respects, the financial position of the Company as of December 31, 2023 and 2022, and the results of its operations and its cash flows for the years then ended, in conformity with accounting principles generally accepted in the United States of America.
Adoption of New Accounting Standard
As discussed in Notes 1, 2 and 3 to the financial statements, the Company changed its method of accounting for credit losses in 2023 due to the adoption of Accounting Standards Update 2016-13, Financial Instruments Credit Losses (Topic 326), Measurement of Credit Losses on Financial Instruments, including all related amendments.
Basis for Opinion
These financial statements are the responsibility of the Companys management. Our responsibility is to express an opinion on the Companys financial statements based on our audits. We are a public accounting firm registered with the Public Company Accounting Oversight Board (United States) (PCAOB) and are required to be independent with respect to the Company in accordance with U.S. federal securities laws and the applicable rules and regulations of the Securities and Exchange Commission and the PCAOB.
We conducted our audits in accordance with the standards of the PCAOB. Those standards require that we plan and perform the audit to obtain reasonable assurance about whether the financial statements are free of material misstatement, whether due to error or fraud. The Company is not required to have, nor were we engaged to perform, an audit of its internal control over financial reporting. As part of our audits we are required to obtain an understanding of internal control over financial reporting but not for the purpose of expressing an opinion on the effectiveness of the Companys internal control over financial reporting. Accordingly, we express no such opinion.
Our audits included performing procedures to assess the risks of material misstatement of the financial statements, whether due to error or fraud, and performing procedures that respond to those risks. Such procedures included examining, on a test basis, evidence regarding the amounts and disclosures in the financial statements. Our audits also included evaluating the accounting principles used and significant estimates made by management, as well as evaluating the overall presentation of the financial statements. We believe that our audits provide a reasonable basis for our opinion.
/s/ Yount, Hyde & Barbour, P.C.
We have served as the Companys auditor since 2007.
Winchester, Virginia
March 22, 2024
F-22
Table of Contents
Chain Bridge Bancorp, Inc. and Subsidiary
(Dollars in thousands, except share and per share data)
| December 31, | ||||||||
| 2023 | 2022 | |||||||
| Assets |
||||||||
| Cash and due from banks |
$ | 6,035 | $ | 6,773 | ||||
| Interest-bearing deposits in other banks |
310,732 | 91,890 | ||||||
|
|
|
|
|
|||||
| Total cash and cash equivalents |
316,767 | 98,663 | ||||||
| Securities available for sale, at fair value |
258,114 | 279,596 | ||||||
| Securities held to maturity, at carrying value, net of allowance for credit losses of $348 in 2023 and $0 in 2022 (fair value of $283,916 in 2023 and $278,884 in 2022) |
308,058 | 312,567 | ||||||
| Equity securities, at fair value |
505 | 486 | ||||||
| Restricted securities, at cost |
2,613 | 2,501 | ||||||
| Loans, net of allowance for credit losses of $4,319 in 2023 and $4,482 in 2022 |
299,825 | 315,711 | ||||||
| Premises and equipment, net of accumulated depreciation of $6,791 in 2023 and $6,300 in 2022 |
9,858 | 10,080 | ||||||
| Accrued interest receivable |
4,354 | 4,313 | ||||||
| Other assets |
5,108 | 6,767 | ||||||
|
|
|
|
|
|||||
| Total assets |
$ | 1,205,202 | $ | 1,030,684 | ||||
|
|
|
|
|
|||||
| Liabilities and Stockholders Equity |
||||||||
| Liabilities |
||||||||
| Deposits: |
||||||||
| Noninterest-bearing |
$ | 766,933 | $ | 666,493 | ||||
| Savings, interest-bearing checking and money market accounts |
328,350 | 273,888 | ||||||
| Time, $250 and over |
9,385 | 5,374 | ||||||
| Other time |
7,357 | 7,199 | ||||||
|
|
|
|
|
|||||
| Total deposits |
1,112,025 | 952,954 | ||||||
| Short-term borrowings |
5,000 | 5,000 | ||||||
| Accrued interest payable |
61 | 20 | ||||||
| Accrued expenses and other liabilities |
4,679 | 3,927 | ||||||
|
|
|
|
|
|||||
| Total liabilities |
1,121,765 | 961,901 | ||||||
|
|
|
|
|
|||||
| Stockholders Equity |
||||||||
| Preferred stock |
| | ||||||
| Common stock |
27 | 27 | ||||||
| Additional paid-in capital |
38,283 | 38,283 | ||||||
| Retained earnings |
56,692 | 48,121 | ||||||
| Accumulated other comprehensive loss |
(11,565 | ) | (17,648 | ) | ||||
|
|
|
|
|
|||||
| Total stockholders equity |
83,437 | 68,783 | ||||||
|
|
|
|
|
|||||
| Total liabilities and stockholders equity |
$ | 1,205,202 | $ | 1,030,684 | ||||
|
|
|
|
|
|||||
See Notes to Consolidated Financial Statements.
F-23
Table of Contents
Chain Bridge Bancorp, Inc. and Subsidiary
Consolidated Statements of Income
For the Years Ended December 31, 2023 and 2022
(Dollars in thousands, except per share data)
| 2023 | 2022 | |||||||
| Interest and Dividend Income |
||||||||
| Interest and fees on loans |
$ | 13,402 | $ | 11,311 | ||||
| Interest and dividends on securities, taxable |
11,112 | 9,190 | ||||||
| Interest on securities, tax-exempt |
1,219 | 1,294 | ||||||
| Interest on interest-bearing deposits in banks |
6,056 | 5,589 | ||||||
|
|
|
|
|
|||||
| Total interest and dividend income |
31,789 | 27,384 | ||||||
|
|
|
|
|
|||||
| Interest Expense |
||||||||
| Interest on deposits |
3,664 | 1,082 | ||||||
| Interest on short-term borrowings |
382 | 201 | ||||||
|
|
|
|
|
|||||
| Total interest expense |
4,046 | 1,283 | ||||||
|
|
|
|
|
|||||
| Net Interest Income |
27,743 | 26,101 | ||||||
| (Recapture of) Provision for Credit Losses |
||||||||
| (Recapture of) provision for loan credit losses |
(163 | ) | 822 | |||||
| Provision for securities credit losses |
804 | | ||||||
|
|
|
|
|
|||||
| Total provision for credit losses |
641 | 822 | ||||||
|
|
|
|
|
|||||
| Net interest income after provision for credit losses |
27,102 | 25,279 | ||||||
|
|
|
|
|
|||||
| Noninterest Income |
||||||||
| Deposit placement services income |
1,974 | 1,543 | ||||||
| Service charges on accounts |
918 | 1,154 | ||||||
| Trust and wealth management income |
565 | 335 | ||||||
| Gain on sale of mortgage loans |
12 | 18 | ||||||
| Loss on sale of securities |
(389 | ) | | |||||
| Other income |
201 | 60 | ||||||
|
|
|
|
|
|||||
| Total noninterest income |
3,281 | 3,110 | ||||||
|
|
|
|
|
|||||
| Noninterest Expenses |
||||||||
| Salaries and employee benefits |
12,359 | 11,173 | ||||||
| Data processing and communication expenses |
2,276 | 1,965 | ||||||
| Occupancy and equipment expenses |
936 | 932 | ||||||
| Professional services |
909 | 1,367 | ||||||
| Virginia bank franchise tax |
739 | 627 | ||||||
| FDIC and regulatory assessments |
585 | 848 | ||||||
| Directors fees |
367 | 371 | ||||||
| Marketing and business development costs |
239 | 189 | ||||||
| Insurance expenses |
225 | 126 | ||||||
| Other operating expenses |
842 | 628 | ||||||
|
|
|
|
|
|||||
| Total noninterest expenses |
19,477 | 18,226 | ||||||
|
|
|
|
|
|||||
| Net income before taxes |
10,906 | 10,163 | ||||||
|
|
|
|
|
|||||
| Income Tax Expense |
2,075 | 1,882 | ||||||
|
|
|
|
|
|||||
| Net Income |
$ | 8,831 | $ | 8,281 | ||||
|
|
|
|
|
|||||
| Earnings per common share, basic and diluted |
$ | 328.64 | $ | 324.26 | ||||
|
|
|
|
|
|||||
See Notes to Consolidated Financial Statements.
F-24
Table of Contents
Chain Bridge Bancorp, Inc. and Subsidiary
Consolidated Statements of Comprehensive Income (Loss)
For the Years Ended December 31, 2023 and 2022
(Dollars in thousands)
| 2023 | 2022 | |||||||
| Net income |
$ | 8,831 | $ | 8,281 | ||||
| Other comprehensive income (loss): |
||||||||
| Unrealized holding gains (losses) on securities available for sale, net of tax of $1,302 in 2023 and ($3,983) in 2022 |
4,897 | (14,985 | ) | |||||
| Unrealized holding losses on securities available for sale transferred to held to maturity, net of tax of ($1,398) in 2022 |
| (5,257 | ) | |||||
| Amortization of unrealized holding losses on securities available for sale transferred to held to maturity, net of tax of $234 in 2023 and $198 in 2022 |
879 | 744 | ||||||
| Reclassification adjustment for losses included in net income, net of taxes of $82 in 2023 |
307 | | ||||||
|
|
|
|
|
|||||
| Other comprehensive income (loss), net of tax |
6,083 | (19,498 | ) | |||||
|
|
|
|
|
|||||
| Comprehensive income (loss) |
$ | 14,914 | $ | (11,217 | ) | |||
|
|
|
|
|
|||||
See Notes to Consolidated Financial Statements.
F-25
Table of Contents
Chain Bridge Bancorp, Inc. and Subsidiary
Consolidated Statements of Cash Flows
For the Years Ended December 31, 2023 and 2022
(Dollars in thousands)
| 2023 | 2022 | |||||||
| Cash Flows from Operating Activities |
||||||||
| Net income |
$ | 8,831 | $ | 8,281 | ||||
| Reconciliation of net income to net cash provided by operating activities: |
||||||||
| Depreciation and amortization of premises and equipment |
491 | 501 | ||||||
| Premium amortization and discount accretion on investment securities, net |
1,616 | 2,708 | ||||||
| Recapture of impairment loss on securities previously recognized in earnings |
(13 | ) | (7 | ) | ||||
| Fair value adjustment on equity security |
(7 | ) | 63 | |||||
| (Recapture of) provision for loan credit losses |
(163 | ) | 822 | |||||
| Provision for securities credit losses |
804 | | ||||||
| Loss on sale of securities |
389 | | ||||||
| Gain on sale of mortgage loans |
(12 | ) | (18 | ) | ||||
| Origination of loans held for sale |
(1,305 | ) | (1,577 | ) | ||||
| Proceeds from sale of loans |
1,317 | 1,595 | ||||||
| Deferred income tax benefit |
(99 | ) | (169 | ) | ||||
| Changes in assets and liabilities: |
||||||||
| Decrease in accrued interest receivable and other asset |
170 | 3,977 | ||||||
| Increase in accrued interest payable, accrued expenses and other liabilities |
793 | 1,166 | ||||||
|
|
|
|
|
|||||
| Net cash provided by operating activities |
12,812 | 17,342 | ||||||
|
|
|
|
|
|||||
| Cash Flows from Investing Activities |
||||||||
| Securities available for sale: |
||||||||
| Purchases of securities |
(23,138 | ) | (471,544 | ) | ||||
| Proceeds from calls, maturities, paydowns and sales |
50,750 | 674,773 | ||||||
| Securities held to maturity: |
||||||||
| Purchases of securities |
(263 | ) | (32,033 | ) | ||||
| Proceeds from calls, maturities, paydowns and sales |
3,216 | 504 | ||||||
| Purchase of restricted securities, net |
(112 | ) | (468 | ) | ||||
| Reinvestment of dividends on equity security |
(12 | ) | (8 | ) | ||||
| Net decrease (increase) in loans |
16,049 | (36,273 | ) | |||||
| Purchases of premises and equipment |
(269 | ) | (88 | ) | ||||
|
|
|
|
|
|||||
| Net cash provided by investing activities |
46,221 | 134,863 | ||||||
|
|
|
|
|
|||||
| Cash Flows from Financing Activities |
||||||||
| Net increase (decrease) in non-interest bearing, savings, interest-bearing checking and money market deposits |
154,902 | (187,623 | ) | |||||
| Net increase (decrease) in time deposits |
4,169 | (296 | ) | |||||
| Proceeds from stock issuance |
| 10,500 | ||||||
|
|
|
|
|
|||||
| Net cash provided by (used in) financing activities |
159,071 | (177,419 | ) | |||||
|
|
|
|
|
|||||
| Net increase (decrease) in cash and cash equivalents |
218,104 | (25,214 | ) | |||||
| Cash and cash equivalents, beginning of period |
98,663 | 123,877 | ||||||
|
|
|
|
|
|||||
| Cash and cash equivalents, end of period |
$ | 316,767 | $ | 98,663 | ||||
|
|
|
|
|
|||||
| Supplemental Disclosures of Cash Flow Information |
||||||||
| Cash payments for interest |
$ | 4,005 | $ | 1,269 | ||||
| Cash payments for taxes |
2,047 | 1,670 | ||||||
| Supplemental Disclosures of Noncash Investing Activities |
||||||||
| Fair value adjustment for available for sale securities |
$ | 6,587 | $ | (18,967 | ) | |||
| Fair value adjustment for available for sale securities transferred to held to maturity |
| (6,655 | ) | |||||
| Transfer of available for sale securities to held to maturity, at fair value |
| 281,502 | ||||||
See Notes to Consolidated Financial Statements.
F-26
Table of Contents
Chain Bridge Bancorp, Inc. and Subsidiary
Consolidated Statements of Changes in Stockholders Equity
For the Years Ended December 31, 2023 and 2022
(Dollars in thousands)
| Common Stock |
Additional Paid-In Capital |
Retained Earnings |
Accumulated Other Comprehensive Income (Loss) |
Total | ||||||||||||||||
| Balance at December 31, 2021 |
$ | 23 | $ | 27,787 | $ | 39,840 | $ | 1,850 | $ | 69,500 | ||||||||||
| Net income |
| | 8,281 | | 8,281 | |||||||||||||||
| Other comprehensive loss |
| | | (19,498 | ) | (19,498 | ) | |||||||||||||
| Issuance of common stock |
4 | 10,496 | | | 10,500 | |||||||||||||||
|
|
|
|
|
|
|
|
|
|
|
|||||||||||
| Balance at December 31, 2022 |
$ | 27 | $ | 38,283 | $ | 48,121 | $ | (17,648 | ) | $ | 68,783 | |||||||||
|
|
|
|
|
|
|
|
|
|
|
|||||||||||
| Cumulative change in accounting principle (Note 1) |
| | (260 | ) | | (260 | ) | |||||||||||||
| Net income |
| | 8,831 | | 8,831 | |||||||||||||||
| Other comprehensive income |
| | | 6,083 | 6,083 | |||||||||||||||
|
|
|
|
|
|
|
|
|
|
|
|||||||||||
| Balance at December 31, 2023 |
$ | 27 | $ | 38,283 | $ | 56,692 | $ | (11,565 | ) | $ | 83,437 | |||||||||
|
|
|
|
|
|
|
|
|
|
|
|||||||||||
See Notes to Consolidated Financial Statements.
F-27
Table of Contents
Chain Bridge Bancorp, Inc. and Subsidiary
Notes to Consolidated Financial Statements
Note 1. Organization and Summary of Significant Accounting Policies
Organization and Nature of Operations
Chain Bridge Bancorp, Inc. (the Company) was incorporated on May 26, 2006, in the Commonwealth of Virginia. On September 30, 2022, the Company underwent a statutory conversion to a Delaware corporation, pursuant to Section 265 of the Delaware General Corporation Law. This conversion effected a change in the Companys state of incorporation while maintaining its continuous existence as a legal entity. The Company is the registered bank holding company for Chain Bridge Bank, National Association (the Bank). The Company falls under the comprehensive supervision and regulatory oversight of the Board of Governors of the Federal Reserve System (the FRB), as mandated by the Bank Holding Company Act of 1956 (12 U.S.C. § 1841 et seq.). Both the Company and Bank have their headquarters and sole executive office in McLean, Virginia
The Bank, a national banking association, was chartered under the National Bank Act (12 U.S.C. §§ 21-216d) and commenced its operations on August 6, 2007, after receiving its charter from the Office of the Comptroller of the Currency (the OCC). The Bank is authorized to engage in the full range of traditional banking activities permissible for national banks under federal law. On March 5, 2020, the OCC granted the Bank separate authorization to perform fiduciary activities, pursuant to 12 U.S.C. § 92a and 12 CFR Part 9, under Charter No. 24755 and OCC Control No. 2020-NE-Fiduciary-313106. The Bank initiated these activities on September 18, 2020. These fiduciary activities include, but are not limited to, acting as trustee, executor, administrator, registrar of stocks and bonds, and guardian of estates.
The primary regulator of the Bank is the OCC, which oversees the Banks operational, risk management, and compliance functions, as well as its fiduciary activities. This oversight includes evaluating the Banks adherence to capital adequacy standards, asset quality, liquidity management, internal controls, and compliance with federal banking statutes and consumer protection laws. The OCC also evaluates the Banks governance practices against the Comptrollers Handbook and relevant laws and regulations.
Additionally, the Federal Deposit Insurance Corporation (the FDIC) provides secondary regulatory oversight of the Bank, an FDIC-insured institution under 12 U.S.C. § 1811 et seq., focusing on insurance standards, risk management practices, and regulatory compliance.
The Bank operates a model that combines electronic banking channels with its physical banking headquarters in McLean, Virginia, allowing it to serve clients nationally.
The Bank provides a wide range of commercial and personal banking services, including deposit accounts, mortgage financing, various loan products, trust administration, wealth management, and asset custody. The core deposit products offered by the Bank include non-interest-bearing and interest-bearing checking accounts, along with savings accounts. The Banks deposit base is largely comprised of funds from commercial entities, specifically federal political organizations, trade associations, non-profit organizations, and business enterprises. Notably, deposits received from federal political committees exhibit significant seasonality, aligning with the cycle of federal election campaigns. The Banks lending portfolio is comprised primarily of mortgage-related loans, with consumer residential mortgages within the Washington, D.C. metropolitan area forming the majority of these.
As of December 31, 2023, the Company has authorized capital stock consisting of 100,000 preferred shares with no par value, none of which have been issued, and 200,000 common shares with a par value of $1.00 per share, of which 26,872 shares have been issued. The Companys common stock remains privately held, with 269 stockholders of record as of the same date.
F-28
Table of Contents
Adoption of New Accounting Standards
On January 1, 2023, the Company adopted ASU 2016-13, Financial InstrumentsCredit Losses (Topic 326): Measurement of Credit Losses on Financial Instruments (ASC 326), as amended, which replaced the incurred loss allowance methodology with an expected loss methodology that is referred to as the current expected credit loss (CECL) methodology. The CECL methodology requires an estimate of credit losses for the remaining estimated life of the financial asset using historical experience, current conditions, and reasonable and supportable forecasts. CECL generally applies to financial assets measured at amortized cost, including loan receivables and held to maturity debt securities, as well as some off-balance sheet credit exposures, such as unfunded commitments to extend credit. Financial assets measured at amortized cost are presented as the net amount expected to be collected.
In addition, CECL made changes to the accounting for available for sale debt securities. One such change is to require credit losses to be presented as an allowance rather than as a write-down on available for sale debt securities if management does not intend to sell, and does not believe that it is more likely than not they will be required to sell, the debt securities.
The Company adopted ASC 326 and all related subsequent amendments thereto effective January 1, 2023, using the modified retrospective approach for all financial assets measured at amortized cost and off-balance sheet credit exposures. The adoption of the CECL standard did not require a material cumulative-effect adjustment to the existing allowance for credit losses for loans or unfunded commitments, and no initial retained earnings adjustment was recorded. As a result of the adoption, the Company recorded an allowance for credit losses for held to maturity securities of $329 thousand, which is presented as a reduction to held to maturity securities outstanding. The adjustment, net of deferred taxes, decreased retained earnings in the amount of $260 thousand. Results for reporting periods beginning after January 1, 2023, are presented under ASU 2016-13, while prior period amounts continue to be reported in accordance with the incurred loss model under the previously applicable Generally Accepted Accounting Principles (GAAP).
The Company adopted ASC 326 using the prospective transition approach for debt securities for which other-than-temporary impairment had been recognized prior to January 1, 2023. As of December 31, 2022, the Company did not have any other-than-temporarily impaired investment securities. The Company did not record an allowance for credit loss for available for sale securities upon adoption.
The Company elected not to measure an allowance for credit losses for accrued interest receivable and instead elected to reverse interest income on loans or securities that are placed on non-accrual status, which generally occurs when the instrument is 90 days past due, or earlier if the Company believes the collection of interest is doubtful. The Company has concluded that this policy results in the timely reversal of uncollectible interest.
On January 1, 2023, the Company adopted ASU 2022-02, Financial InstrumentsCredit Losses (Topic 326), Troubled Debt Restructurings and Vintage Disclosures. ASU 2022-02 addresses areas identified by the Financial Accounting Standards Board (FASB) as part of its post-implementation review of the ASU 2016-13. The amendments eliminate the accounting guidance for troubled debt restructurings (TDRs) by creditors that have adopted the CECL model and enhance the disclosure requirements for certain loan refinancings and restructurings by creditors when a borrower is experiencing financial difficulty. In addition, the amendments require that the Company disclose current-period gross write-offs for financing receivables and net investment in leases by year of origination in the vintage disclosures. The Company adopted the standard prospectively, and it did not have a material impact on the financial statements.
Significant Accounting Policies
The accounting and reporting policies of the Company are in accordance with accounting principles generally accepted in the United States of America and conform to general practices within the banking industry. The more significant of these policies are summarized below.
F-29
Table of Contents
Principles of Consolidation
The consolidated financial statements include the accounts of Chain Bridge Bancorp, Inc. and its wholly-owned subsidiary, Chain Bridge Bank, N.A. All significant intercompany balances and transactions have been eliminated in consolidation.
Use of Estimates
In preparing financial statements in conformity with accounting principles generally accepted in the United States of America, management is required to make estimates and assumptions that affect the reported amounts of assets and liabilities as of the date of the balance sheet and reported amounts of revenues and expenses during the reporting period. Actual results could differ from those estimates. Material estimates that are particularly susceptible to significant change in the near term relate to the determination of the allowance for credit losses on loans and held to maturity securities.
Reclassification
Certain amounts reported in prior years may be reclassified to conform to the current years presentation. None of those reclassifications were significant to stockholders equity or net income.
Cash and Cash Equivalents
For purposes of the consolidated statement of cash flows, cash and cash equivalents include cash on hand and amounts due from banks and federal funds sold. Generally, federal funds are purchased and sold for one-day periods.
Cash Concentrations and Restrictions
The Bank maintains cash accounts in several correspondent banks. The total amount by which cash on deposit in those banks and federal funds sold exceeded the federally insured limits at December 31, 2023 and 2022 was $657 thousand and $546 thousand, respectively.
The Bank may be required to maintain average balances with the Federal Reserve Bank. On March 26, 2020, The Federal Reserve reduced the reserve requirement to zero for thousands of depository institutions to support lending to households and businesses. Accordingly, the Bank had no minimum reserve requirement at December 31, 2023 and 2022.
Securities
The Bank invests in debt securities issued by entities across various sectors. Under 12 CFR Part 1, banks are required to invest only in securities that are considered investment grade. A security is deemed investment grade when the issuer has an adequate capacity to meet its financial commitments under the security for the projected life of the asset or exposure. An issuer is considered to have an adequate capacity to meet financial commitments if the risk of default by the obligor is low and the full and timely repayment of principal and interest is expected. The Bank has policies and procedures that are designed to promote compliance with these requirements, which include conducting pre-purchase and ongoing credit monitoring activities for its investments in debt securities.
To determine whether a prospective or currently held obligation meets investment grade criteria, the Bank obtains financial statements of the issuer, analyzes the issuers ability to repay, and, when available, considers current ratings opinions of outside sources. The extent of the assessment of a securitys qualification as investment grade will depend on the security itself, and the Bank maintains a structured policy setting forth the
F-30
Table of Contents
requirements for pre-purchase and ongoing assessments by security type and rating status. All new municipal, corporate and non-agency structured bond purchases undergo a customized analysis by the investment department prior to purchase. Thereafter, corporate bonds, non-agency structured assets, and non-rated municipal bonds undergo an annual assessment by the investment department to assess the issuers ability to meet current and prospective debt payment obligations. Rated municipal securities are reviewed by external parties on an ongoing basis. The results of such reviews will contain data to enable the Bank to assess the issuers credit quality without sole reliance upon third-party credit ratings and may include data related to the issuers financial condition, debt obligations, and other factors. Further diligence is performed by the investment department when the external review identifies problematic issuers. By these practices, the Bank incorporates third-party credit ratings within broader security reviews. It utilizes several approaches to its security assessments and avoids sole reliance on third-party credit ratings.
Debt securities that the Company has the intent and ability to hold to maturity are classified as held to maturity and recorded at amortized cost. Trading securities are recorded at fair value with changes in fair value included in earnings. Debt securities not classified as held to maturity or trading, are classified as available for sale and recorded at fair value, with unrealized gains and losses excluded from earnings and reported in other comprehensive income (loss). Purchase premiums and discounts are recognized in interest income using the interest method over the terms of the debt securities. Gains and losses on the sale of debt securities are recorded on the trade date and are determined using the specific identification method.
Transfers of debt securities into the held to maturity classification from the available for sale classification are made at fair value on the date of transfer. The unrealized holding gain or loss on the date of the transfer is reported in accumulated other comprehensive income (loss) and in the carrying value of the held to maturity securities. Such amounts are amortized over the remaining contractual lives of the securities. The net impact to income from the amortization and accretion of the unrealized loss at date of transfer is zero.
Equity securities with readily determinable fair values are carried at fair value, with changes in fair value reported in net income. Any equity securities without readily determinable fair values are carried at cost, minus impairment, if any, plus or minus changes resulting from observable price changes in orderly transactions for identical or similar investments. Restricted equity securities are carried at cost and are periodically evaluated for impairment based on the ultimate recovery of par value. The entirety of any impairment on equity securities is recognized in earnings.
The Bank maintains an investment in the capital stock of two correspondent banks: CBB Financial Corp. of Midlothian, Virginia and Pacific Coast Bankers Bancshares of Walnut Creek, California. The Bank maintains a required investment in the capital stock of the Federal Reserve Bank of Richmond, Virginia, and the Federal Home Loan Bank of Atlanta, Georgia. The Banks investment in these correspondent stocks is recorded at cost based on the redemption provisions of these entities and is included in restricted securities on the consolidated balance sheets.
Allowance for Credit LossesHeld to Maturity Securities
Management measures expected credit losses on held to maturity (HTM) debt securities on a collective basis by major security type. Accrued interest receivable on HTM debt securities totaled $1.6 million at December 31, 2023 and is excluded from the estimate of credit losses.
The estimate of expected credit losses considers the Companys historical credit loss information that is adjusted for current conditions and reasonable and supportable forecasts.
Management classifies the HTM portfolio into the following major security types: U.S. government and federal agencies, agency mortgage backed securities, corporate bonds, and state and municipal securities. Securities issued by the U.S. Treasury or government agencies are not considered to be credit sensitive as they are explicitly
F-31
Table of Contents
or implicitly guaranteed by the U.S. government, and result in expectations of zero credit loss. Accordingly, managements analysis of credit loss considers only the corporate and municipal segments.
In addition to performing an analysis over the Companys own historical bond credit losses, the Company utilizes a methodology involving a probability of default and loss given default calculation to establish the expected credit loss for credit sensitive HTM debt securities. This methodology uses historical loss data from the investment rating agencies sourced from the public domain to produce cumulative default and recovery rates over time. The cumulative default rates applied to the municipal and corporate bond portfolios are stratified by time remaining to maturity and credit rating. This quantitative analysis may be adjusted as needed, based on documented qualitative factors and reasonable and supportable forecasts.
Upon initial adoption of ASC 326 on January 1, 2023, the Company recognized the cumulative-effect adjustment for the changes in the allowance for credit losses (ACL) relating to the HTM debt securities portfolio in retained earnings. The adjustment, net of tax, decreased retained earnings in the amount of $260 thousand.
Allowance for Credit LossesAvailable for Sale Securities
For available for sale (AFS) debt securities in an unrealized loss position, the Company first assesses whether it intends to sell, or it is more likely than not that it will be required to sell, the security before recovery of its amortized cost basis. If either of the criteria regarding intent or requirement to sell is met, the securitys amortized costs basis is written down to fair value through income. For AFS debt securities that do not meet the aforementioned criteria, the Company evaluates whether the decline in fair value has resulted from credit losses or other factors. In making this assessment, management considers the extent to which fair value is less than amortized cost, any changes to the rating of the security by a rating agency, and adverse conditions specifically related to the security, among other factors. If this assessment indicates that a credit loss exists, the present value of cash flows expected to be collected from the security are compared to the amortized costs basis of the security. If the present value of cash flows expected to be collected is less than the amortized cost basis, a credit loss exists, and an ACL is recorded for the credit loss, limited by the amount that the fair value is less than the amortized cost basis. Any impairment that has not been recorded through an ACL is recognized in other comprehensive income (loss).
Changes in the ACL are recorded as credit loss provision (or reversal). Losses are charged against the allowance when management believes the uncollectibility of an AFS security is confirmed or when either of the criteria regarding intent or requirement to sell is met. At December 31, 2023, there was no allowance related to the AFS security portfolio.
Accrued interest receivable on AFS debt securities totaled $1.6 million at December 31, 2023 and is excluded from the estimate of credit losses.
Loans Held for Sale
Loans held for sale are carried at the lower of cost or fair value, determined in the aggregate. Fair value considers commitment agreements with investors and prevailing market prices. Loans originated by the Banks mortgage banking division and held for sale to outside investors are made on a pre-sold basis with servicing rights released. Gains and losses on sales of mortgage loans are recognized based on the difference between the selling price and the carrying value of the related mortgage loans sold.
Loans
The Bank grants mortgage, commercial, and consumer loans to clients. A substantial portion of the loan portfolio is primarily represented by residential and commercial loans throughout the Washington, D.C. metropolitan area. The ability of the Banks debtors to honor their contracts is dependent upon the real estate and general economic conditions in this area.
F-32
Table of Contents
Loans that the Company has the intent and ability to hold for the foreseeable future or until maturity or pay-off generally are reported at their outstanding unpaid principal balances adjusted for the allowance for credit losses and any deferred fees or costs on originated loans. Interest income is accrued on the unpaid principal balance. Loan origination and commitment fees and certain direct costs are deferred and the net amount is amortized as an adjustment of the related loan yield.
The accrual of interest on mortgage and commercial loans is discontinued at the time the loan becomes 90 days delinquent unless the credit is well-secured and in process of collection. Management may place loans on non-accrual status prior to 90 days of delinquency if management believes interest is uncollectible. Non-performing or uncollectible loans are placed either in nonaccrual status pending further collection efforts or charged off if collection of principal or interest is considered doubtful.
All interest accrued but not collected for loans that are placed on nonaccrual or charged off is reversed against interest income. The interest on loans in nonaccrual status is accounted for on the cash basis or cost recovery method until qualifying for return to accrual. Loans are returned to accrual status when all the principal and interest amounts contractually due are brought current and future payments are reasonably assured.
Risk grading and ongoing credit monitoring of the loan portfolio
During managements review of the adequacy of the allowance for credit losses, particular risk characteristics associated with a segment of the loan portfolio are also considered. These characteristics are detailed below:
| | Commercial and industrial loans that are not secured by real estate or other marketable collateral carry risks associated with the continued and successful operation of a business. The repayment of these loans heavily depends on the profitability and cash flows from the business. Additional risks related to an industry or key person may impact the ability for the business to operate profitably or continue operations. |
| | Commercial real estate mortgages carry risks associated with the tenancy of the property, and the repayment of these loans depends on the net operating income from the property. Additional risk relates to the value of collateral where depreciation occurs, and the appraisal lacks precision. |
| | Residential real estate mortgage loans carry risks associated with the income and continued creditworthiness of the borrower and changes in the value of the collateral. |
| | Other consumer loans carry risks associated with the continued income and creditworthiness of the borrower and the value of the collateral, which may depreciate more rapidly than other assets. In addition, these loans may be unsecured. Consumer loans are more likely than real estate loans to be immediately affected in an adverse manner by job loss, divorce, illness, or personal bankruptcy. |
All loans, regardless of type, are assigned a loan risk classification grade during the underwriting process. The Company categorizes commercial loans into risk categories based on relevant information about the ability of the borrowers to service their debt such as: current financial information, historical payment experience, credit documentation, public information and current economic trends, among other factors. Consumer loans are provided a risk rating based on the type of loan. This risk classification grade is an important component that triggers the addition of a loan to the watch list report. The primary tool used in managing and controlling problem loans is a watch list report, which is a listing of all loans or commitments that are considered problem loans. The report is controlled by the Chief Credit Officer and presented to the Board monthly. It is a primary responsibility of each loan officer to manage the credit risk within their loan portfolio. As such, they are expected to be proactive rather than reactive when considering the need to add a loan to the watch list report. Occurrence of any of the following criteria is a basis for adding a loan (other than consumer and residential mortgage loans) to the watch list report:
| | Loans classified as substandard, doubtful or loss by bank examiners, external loan review, the Chief Credit Officer or the Chief Executive Officer based upon financial trends of the business. |
| | Loans on nonaccrual status. |
F-33
Table of Contents
| | Loans more than 30 days delinquent. |
| | Loans renewed or extended without the capacity to repay the principal. |
| | Loans selected by management, in its judgement, due to unexpected changes or events which could have a potentially adverse effect on the borrowers ability to repay. |
The following guidance is generally used by loan officers in detecting problem loans. The existence of one or more of these scenarios might also cause a loan officer to evaluate whether the loan risk classification grade assigned at origination should be modified:
| | Financial Statement AnalysisAs client financial statements are received, they are analyzed for any significant changes in the financial position or operating results. |
| | Delayed Financial StatementsIf the Bank is having problems getting financial statements from a client, a problem may be developing. |
| | Delinquent Principal or InterestDelinquencies are often the first indication of a problem. The Banks policy is to carefully review each loan as soon as it becomes past due. |
| | Delinquent Real Estate TaxesDelinquent property taxes are often a sign a borrower is experiencing cash flow issues. The Bank monitors real estate property tax payments using third-party services. The Banks policy is to carefully review delinquent tax notices as they are made available. |
| | OverdraftsIf a borrowers deposit account is overdrawn on a consistent basis this is an indication of an income or cash flow problem. |
| | Lack of CooperationIt is in the borrowers best interest to cooperate with the Bank. We suspect a problem if the client becomes uncooperative. |
| | OtherThe following are additional warning signs which could mean a problem loan situation is developing: illness or death of a principal or key employee; family difficulties; unexpected renewals or unanticipated new borrowing; a too high or too low inventory level in comparison to industry standards; irresponsible behavior on the part of a borrower; or trade payables begin to increase abnormally and cancellation of insurance. |
In addition to a loan officer identifying the need to re-evaluate a loans current risk classification grade based upon the detection of potential issues with the loan or the borrower, the Bank performs both internal and external loan reviews for a large portion of the portfolio. The external loan review function independently evaluates the Banks underwriting and ongoing portfolio monitoring, which includes the confirmation of the grade or alternatively the recommendation to change the risk classification grade. The Banks internal loan review process monitors the performance of commercial borrowers using a risk-based approach and includes the confirmation of the grade or alternatively the recommendation to change the risk classification grade. Characteristics of the Banks risk classification grades are as follows:
| | PassPass rated loans are to persons or business entities with an acceptable financial condition, appropriate collateral margins, appropriate cash flow to service the existing loan, and an appropriate leverage ratio. The borrower has paid all obligations as agreed, and it is expected that this type of payment history will continue. Acceptable personal guarantors support the loan as needed. |
| | Special MentionSpecial Mention loans have potential weaknesses that deserve managements close attention. If left uncorrected, these potential weaknesses may result in deterioration of the repayment prospects for the asset or in the Banks credit position at some future date. Special mention assets are not adversely classified and do not expose the Bank to sufficient risk to warrant adverse classification. |
| | SubstandardSubstandard assets are inadequately protected by the current sound worth and paying capacity of the borrower or of the collateral pledged, if any. Assets so classified must have a well-defined weakness, or weaknesses, that jeopardize the liquidation of the debt. They are characterized by the distinct possibility that some loss will be sustained if the deficiencies are not corrected. |
| | DoubtfulDoubtful assets have all the weaknesses inherent in assets classified substandard with the added characteristic that the weaknesses make collection or liquidation in full, on the basis of currently existing facts, conditions, and values, highly questionable and improbable. |
F-34
Table of Contents
| | LossLoans in this category are considered uncollectible and of such little value that their continuance as bankable assets is not warranted. |
Allowance for Credit LossesLoans
The allowance for credit losses (ACL) represents an amount which, in managements judgment, is adequate to absorb the lifetime expected credit losses that may be sustained on outstanding loans at the balance sheet date. The estimate for expected credit losses is based on an evaluation of the size and current risk characteristics of the loan portfolio, past events, current conditions, reasonable and supportable forecasts of future economic conditions, and prepayment experience as related to credit contractual term information. The ACL is measured and recorded upon the initial recognition of a financial asset. The ACL is reduced by charge-offs, net of recoveries of previous losses, and is increased (or decreased) by a provision for (or recovery of) credit losses, which is recorded in the consolidated statements of income. Management estimates the allowance balance using information, from internal and external sources, relating to past events, current conditions, and reasonable and supportable forecasts. Historical credit loss experience provides the basis for the estimation of expected credit losses. Adjustments to historical loss information are made for differences in current loan-specific risk characteristics such as differences in underwriting standards, portfolio mix, delinquency level, or term, as well as for changes in environmental conditions, such as changes in unemployment rates, property values, or other relevant factors. Expected credit losses are estimated over the contractual term of the loans, adjusted for expected prepayments when appropriate. The contractual term excludes expected extensions, renewals, and modifications.
The ACL is measured on a collective (pool) basis when similar risk characteristics exist. Under the CECL methodology, management uses the weighted average remaining maturity (WARM) method to calculate quantitative allowances for all collectively evaluated loan categories. Management generally segments loans based on their federal call codes in order to aggregate loans with similar risk characteristics.
To adjust the Banks loss rates over a reasonable and supportable forecast period of one year, management collects and analyzes one or a combination of loss drivers which may include unemployment rates, home price indices, interest rates, gross domestic product, or other macroeconomic indicators as appropriate. Following the one year reasonable and supportable forecast period, expected losses immediately revert to rates that are based on the historical information baseline, plus or minus qualitative adjustments.
To further adjust the allowance for credit losses for expected losses not already included within the quantitative component of the calculation, the Bank may consider the following qualitative adjustment factors: levels of and trends in delinquencies and individually evaluated loans; level of and trends in charge-off and recovery activity; trends in volume and terms of loans; effect of changes in risk selection and underwriting standards, and other changes in lending policies, procedures and practices; effect of changes in experience, ability and depth of lending management and other staff; national and local economic trends and conditions; industry conditions and other external factors; effects of changes in credit concentrations; and changes in the quality of the Banks loan review system and loan grading.
If a loan does not share risk characteristics with a pool of other loans, expected credit losses are then measured on the individual loan basis. When a loans expected credit loss is measured individually, it is excluded from any collective assessment. Management will individually evaluate the expected credit loss for any loans that are collateral dependent, are graded substandard or doubtful, or are otherwise determined to have risk characteristics that are dissimilar to the established loan pools. The individual evaluation will consider collateral value, an observable market price, or the present value of future cash flows. If the measured value of the loan using one of these methods is less than the carrying value of the loan, a specific reserve is applied to the loan in the amount of the difference.
When management determines that foreclosure is probable, or when the borrower is experiencing financial difficulty at the reporting date, and repayment is expected to be provided substantially through the operation or sale of the collateral, the loan is considered collateral-dependent. These loans do not share common risk
F-35
Table of Contents
characteristics with other loans and are not included in any collective evaluation for determining an ACL. Under CECL, the Company has adopted the practical expedient to the ACL for collateral-dependent loans, which allows the Bank to record an ACL based on the fair value of the collateral rather than by estimating expected losses over the life of the loan. Under the practical expedient, the ACL is calculated on an individual loan basis based on the shortfall between the value of the loans collateral, which is adjusted for liquidation costs and discounts, and its amortized cost. If the fair value of the collateral exceeds the amortized cost, no allowance is required.
Allowance for Credit LossesOff-Balance Sheet Credit
The Company estimates expected credit losses over the contractual period in which the Company is exposed to credit risk via a contractual obligation to extend credit, unless that obligation is unconditionally cancellable by the Company. The allowance for credit losses on off-balance sheet credit exposures is included in accrued expenses and other liabilities on the consolidated balance sheets and adjusted through credit loss provision (or recovery). The estimate includes consideration of the likelihood that funding will occur and an estimate of expected credit losses on commitments expected to be funded over their estimated lives. The Company applies the loan segmentation practices and CECL methodology utilized for the loan portfolio to its unfunded commitments.
Modifications to Borrowers Experiencing Financial Difficulty
On January 1, 2023, the Company adopted ASU 2022-02, Financial InstrumentsCredit Losses (Topic 326), Troubled Debt Restructurings and Vintage Disclosures. Prior to the adoption of ASU 2022-02, in situations where a borrower is experiencing financial difficulty, management grants a concession that it would not otherwise consider and the modification results in a more than insignificant change in contractual cash flows, the related loan would be classified as a TDR. With the adoption of ASU 2022-02 on January 1, 2023, the TDR accounting model was eliminated.
Beginning in 2023, in situations where a borrower is experiencing financial difficulty, management grants a concession to the borrower that it would not otherwise consider, and the modification results in a more than insignificant change in contractual cash flows, the related loan is subject to specific disclosure requirements. Management strives to identify borrowers in financial difficulty early and work with them to modify their loans to more affordable terms before their loans reach nonaccrual status. These modified terms may include rate reductions, principal forgiveness, payment forbearance and other actions intended to minimize the economic loss and to avoid foreclosure or repossession of the collateral. The Bank did not extend any modifications to borrowers experiencing financial difficulty that had a more than insignificant change in the contractual cash flows of a loan during the period ending December 31, 2023. The Bank had no TDRs as of December 31, 2022.
Premises and Equipment
Land is carried at cost. Premises and equipment are stated at cost less accumulated depreciation. Depreciation is computed using the straight-line method over the assets estimated useful lives. The estimated useful lives range from 3 to 8 years for furniture, fixtures and equipment, 10 years for improvements, and 40 years for buildings.
Foreclosed Properties
Assets acquired through, or in lieu of, loan foreclosure are held for sale. Foreclosed assets are initially recorded at fair market value at the date of foreclosure less estimated selling costs, thus establishing a new cost basis. Subsequent to foreclosure, valuations of the assets are periodically performed by management. Adjustments are made to the lower of the carrying amount or fair market value of the assets less selling costs. Revenue and expenses from operations and valuation changes are included in non-interest expense. The Bank had no foreclosed assets during the years ending December 31, 2023 and 2022.
F-36
Table of Contents
Rate Lock Commitments
The Bank enters into commitments to originate mortgage loans whereby the interest rate on the loan is determined prior to funding (rate lock commitments). Rate lock commitments on mortgage loans that are intended to be sold are considered to be derivatives. The period of time between issuance of a loan commitment and closing and sale of the loan generally ranges from 30 to 120 days. The Bank protects itself from changes in interest rates through the use of best-efforts forward delivery commitments, whereby the Bank commits to sell a loan at the time the borrower commits to an interest rate with the intent that the buyer has assumed interest rate risk on the loan. As a result, the Bank is not exposed to losses and will not realize significant gains related to its rate lock commitments due to changes in interest rates. The correlation between the rate lock commitments and the best-efforts contracts is very high due to their similarity.
The fair value of rate lock commitments and best-efforts contracts is not readily ascertainable with precision because rate lock commitments and best-efforts contracts are not actively traded in stand-alone markets. Management considers any gain or loss associated with rate lock commitments during the years ending December 31, 2023 or 2022 to be immaterial.
Income Taxes
Deferred income tax assets and liabilities are determined using the asset and liability (or balance sheet) method. Under this method, the net deferred tax asset or liability is determined based upon the tax effects of the temporary differences between the book and tax bases of the various balance sheet assets and liabilities and give current recognition to changes in tax rates and laws. Deferred tax assets are recognized for deductible temporary differences, operating loss carryforwards, and tax credit carryforwards. Deferred tax liabilities are recognized for taxable temporary differences. Temporary differences are the differences between the reported amounts of assets and liabilities and their tax bases.
When tax returns are filed, it is highly certain that some positions taken would be sustained upon examination by the taxing authorities, while others are subject to uncertainty about the merits of the position taken or the amount of the position that would be ultimately sustained. The benefit of a tax position is recognized in the financial statements in the period during which, based on all available evidence, management believes it is more likely than not that the position will be sustained upon examination, including the resolution of appeals or litigation processes, if any. Tax positions taken are not offset or aggregated with other positions. Tax positions that meet the more-likely-than-not recognition threshold are measured as the largest amount of tax benefit that is more than 50 percent likely of being realized upon settlement with the applicable taxing authority. The portion of the benefits associated with tax positions taken that exceeds the amount measured as described above is reflected as a liability for unrecognized tax benefits in the accompanying balance sheets along with any associated interest and penalties that would be payable to the taxing authorities upon examination. Interest and penalties associated with unrecognized tax benefits are classified as additional income taxes in the consolidated statements of income. The Company did not record a liability for unrecognized tax benefits at December 31, 2023 or 2022.
Transfers of Financial Assets
Transfers of financial assets are accounted for as sales when control over the assets has been relinquished. Control over financial assets is deemed to be surrendered when the assets have been isolated from the Company, the transferee obtains the rights (free of conditions that constrain it from taking advantage of that right) to pledge or exchange the transferred assets, and the Company does not maintain effective control over the transferred assets through an agreement to repurchase them before their maturity.
Private Placement
In the first quarter of 2022, the Companys Board of Directors authorized a private placement offering, under Rule 506(b) of the Securities and Exchange Commissions Regulation D, to raise additional common equity
F-37
Table of Contents
capital. The Offering included an option to accept subscriptions up to 3,500 shares at a price of $3,000.00 per share. The 3,500 shares sold for a total of $10.5 million by the subscription deadline of April 27, 2022.
Earnings Per Share
Basic earnings per share represents income available to common stockholders divided by the weighted average number of common shares outstanding during the period. Diluted earnings per share reflects additional common shares that would have been outstanding if dilutive potential common shares had been issued, as well as any adjustment to income that would result from the assumed issuance. There were no potentially dilutive shares as of December 31, 2023 and 2022. For the years ended December 31, 2023 and 2022, respectively, the weighted average number of shares outstanding for calculating both basic and diluted earnings per share was 26,872 and 25,539, respectively.
Advertising Costs
The Companys policy is to charge the production costs of advertising to expense as incurred. The Bank expensed $33 thousand and $30 thousand for advertising costs for the years ended December 31, 2023 and 2022, respectively.
Comprehensive Loss
Accounting principles generally require that recognized revenue, expenses, gains and losses be included in net income. Although certain changes in assets and liabilities, such as unrealized gains and losses on available for sale securities, are reported as a separate component of the stockholders equity section of the consolidated balance sheets, such items, along with net income, are components of comprehensive income (loss). For the years ended December 31, 2023 and 2022, the Companys other comprehensive income (loss) relates to changes in unrealized gains and losses on available for sale securities and the unrealized losses on securities transferred from available for sale to held to maturity, net of tax. Items reclassified out of accumulated other comprehensive income (loss) to net income relate to the amortization on securities transferred from available for sale to held to maturity as well the sale of securities in 2023.
Fair Value Measurements
The Company uses fair value measurements to record fair value adjustments to certain assets and liabilities and to determine fair value disclosures. In accordance with the Fair Value Measurements and Disclosures Topic of the Financial Accounting Standards Boards Accounting Standards Codification, the fair value of a financial instrument is the price that would be received to sell an asset or paid to transfer a liability (an exit price) in the principal or most advantageous market for the asset or liability in an orderly transaction between market participants at the measurement date. Fair value is best determined based upon quoted market prices. However, in many instances, there are not quoted market prices for the Companys various financial instruments.
In cases where quoted market prices are not available, fair values are based on estimates using present value or other valuation techniques. Those techniques are significantly affected by the assumptions used, including the discount rate and estimates of future cash flows. Accordingly, the fair value estimates may not be realized in an immediate settlement of the instrument.
If there has been a significant decrease in volume and level of activity for the asset or liability, a change in valuation technique or the use of multiple valuation techniques may be appropriate. In such instances, determining the price at which willing market participants would transact at the measurement date under current market conditions depends on the facts and circumstances and requires the use of significant judgment. The fair value is a reasonable point within the range that is most representative of fair value under current market conditions.
F-38
Table of Contents
Loss Contingencies
Certain conditions may exist as of the date the financial statements are issued, which may result in a loss to the Company, but which will only be resolved when one or more future events occur or fail to occur. The Companys management and its legal counsel assess such contingent liabilities, and such assessment inherently involves an exercise of judgment. In assessing loss contingencies related to legal proceedings that are pending against the Company or unasserted claims that may result in such proceedings, the Companys legal counsel evaluates the perceived merits of any legal proceedings or unasserted claims as well as the perceived merits of the amount of relief sought or expected to be sought therein.
If the assessment of a contingency indicates that it is probable that a material loss has been incurred and the amount of the liability can be estimated, then the estimated liability would be accrued in the Companys consolidated financial statements. If the assessment indicates that a potentially material loss contingency is not probable, but is reasonably possible, or is probable but cannot be estimated, then the nature of the contingent liability, together with an estimate of the range of possible loss if determinable and material, would be disclosed.
Loss contingencies considered remote are generally not disclosed unless they involve guarantees, in which case the nature of the guarantee would be disclosed.
Litigation
On June 12, 2020, Blue Flame Medical LLC (Blue Flame) filed a lawsuit against the Bank, its Chief Executive Officer John J. Brough, and its President David M. Evinger in the United States District Court for the Eastern District of Virginia. The lawsuit alleged that the Bank improperly returned a wire transfer in the amount of $456.9 million and remained obligated to pay that sum to Blue Flame. The wire transfer, sent by the State of California on March 26, 2020, was intended as a down payment for the purchase of 100 million N95 masks. The Bank returned the wire transfer in response to a cancellation request received from JPMorgan Chase Bank, N.A. (JPMorgan), the bank acting on behalf of the State of California.
On September 23, 2021, after having previously dismissed other claims, the United States District Court for the Eastern District of Virginia entered judgements in favor of the Bank both on the remaining claims asserted by Blue Flame and on the Banks third-party indemnification complaint against JPMorgan. Blue Flame and JPMorgan appealed the District Courts judgements to the United States Court of Appeals for the Fourth Circuit, which subsequently affirmed the District Courts rulings on March 20, 2023. While JPMorgan elected not to pursue further appeals, Blue Flame filed a petition for a writ of certiorari with the United States Supreme Court. On October 2, 2023, the Supreme Court denied Blue Flames petition for a writ of certiorari, leaving undisturbed the decisions of the lower courts in favor of the Bank.
Following the exhaustion of all appellate review, the Bank and JPMorgan executed a settlement agreement dated November 29, 2023, resolving their outstanding indemnification disputes.
Management is not aware of any other litigation, claims or legal actions during 2023, and does not believe there are now any such matters that will have a material effect on the financial statements.
Revenue Recognition
Accounting Standards Codification Topic 606 (ASC 606), Revenue from Contracts with Customers, creates a single framework for recognizing revenue from contracts with customers that fall within its scope and revises when it is appropriate to recognize gains or losses from the transfer of nonfinancial assets such as other real estate. The majority of the Companys revenues come from interest income and other sources, including loans and securities that are outside the scope of ASC 606. The Companys services that fall within the scope of ASC 606 are presented in non-interest income in the consolidated statements of income and are recognized as revenue when the Company satisfies its obligation to the customer.
F-39
Table of Contents
ASC 606 is applicable to noninterest revenue streams such as service charges on deposit accounts, other service charges and fees, and credit and debit card fees. The primary noninterest revenue streams within the scope of ASC 606 are discussed below.
Service Charges on Accounts
Service charges on accounts consist primarily of income from three areas. The Company earns income from account analysis, monthly service charges, and from overdraft, nonsufficient funds, and other deposit account related services as well as income from transaction-based services such as wire transfers and debit card fee income.
The Companys performance obligation for account analysis and monthly service charges is generally satisfied, and the related revenue recognized, over the period in which the service is provided. Payment for account analysis and service charges on deposit accounts is primarily received immediately or in the following month through a direct charge to clients accounts. Nonsufficient funds and other deposit account related service charges are transaction-based, and therefore, the Companys performance obligation is satisfied, and related revenue recognized, at a point in time.
Other account related service charges include transaction-based charges for wire transfers, safety deposit box rentals, lockbox, and other services. Safe deposit box rentals are charged to the client on an annual basis and income is recognized upon receipt of payment. The Company has determined that since rentals and renewals occur fairly consistently over time, revenue is recognized on a basis consistent with the duration of the performance obligation. The Companys performance obligations for wire transfer and other service charges are largely satisfied, and the related revenue recognized, upon completion of the service. Payment is typically received immediately or in the following month.
Debit card income is primarily comprised of interchange fee income. Interchange fees are earned whenever debit cards issued by the Company are processed through card payment networks. The Companys performance obligation for interchange fee income is largely satisfied, and related revenue recognized, when the services are rendered or upon completion. Payment is received immediately or in the following month. During the year ending December 31, 2023 and 2022, credit card income arose from the Banks agency agreement with the First National Bank of Omaha. The Bank terminated this agreement as of September 30, 2023. Prior to the termination of this agreement, the Bank referred clients to this credit card provider and, in return, received a percentage of the profits earned on the referred accounts. Income was recorded on a quarterly basis as payments were received.
Trust and Wealth Management Income
Trust and wealth management income represents monthly service charges due from clients for managing and administering the clients assets. Wealth management and trust services include investment management and advisory services, custody of assets, trust services and similar fiduciary activities, and financial planning services. Revenue is recognized when the performance obligation is completed each month. Income for financial planning services is recorded when payment is received, usually in stages throughout the contract.
Note 2. Securities & Allowance for Securities Credit Losses
The Company invests in a variety of debt securities, principally obligations of the U.S. government and federal agencies, mortgage backed securities, state and municipal agencies, and corporations. As of December 31, 2023 and 2022, all debt securities were classified as held to maturity or available for sale.
F-40
Table of Contents
Management considers the appropriateness of the accounting treatment applied to the Companys securities portfolio on an ongoing basis. During 2022, given the rapid increase in interest rates, the resulting effects of unrealized bond losses on stockholders equity, and to better reflect managements intention to hold certain securities until maturity, the Company transferred AFS securities with a book value of $288.2 million and an associated unrealized loss of $6.7 million to the HTM classification at the fair value of $281.5 million. The securities selected for transfer included U.S. government and federal agencies, corporate bonds, and state and municipal bonds. The unrealized loss is being amortized monthly over the remaining lives of the securities with an increase to the carrying value of the securities and a decrease to the related accumulated other comprehensive loss, which is included in the stockholders equity section of the consolidated balance sheets.
The following table summarizes the amortized cost, gross unrealized gains and losses, fair value and allowance for credit losses of securities available for sale and securities held to maturity at December 31, 2023 (dollars in thousands):
| December 31, 2023 | ||||||||||||||||||||
| Amortized Cost |
Gross Unrealized Gains |
Gross Unrealized (Losses) |
Fair Value | Allowance for Credit Losses |
||||||||||||||||
| Securities available for sale: |
||||||||||||||||||||
| U.S. government and federal agencies |
$ | 95,129 | $ | 32 | $ | (2,864 | ) | $ | 92,297 | $ | | |||||||||
| Mortgage backed securities |
9,247 | 11 | (609 | ) | 8,649 | | ||||||||||||||
| Corporate bonds |
57,304 | 5 | (1,837 | ) | 55,472 | | ||||||||||||||
| State and municipal securities |
106,472 | 34 | (4,810 | ) | 101,696 | | ||||||||||||||
|
|
|
|
|
|
|
|
|
|
|
|||||||||||
| Total securities available for sale |
$ | 268,152 | $ | 82 | $ | (10,120 | ) | $ | 258,114 | $ | | |||||||||
|
|
|
|
|
|
|
|
|
|
|
|||||||||||
| Securities held to maturity: |
||||||||||||||||||||
| U.S. government and federal agencies |
$ | 123,938 | $ | | $ | (10,069 | ) | $ | 113,869 | $ | | |||||||||
| Mortgage backed securities |
1,190 | | (17 | ) | 1,173 | | ||||||||||||||
| Corporate bonds |
59,629 | 59 | (3,027 | ) | 56,661 | (322 | ) | |||||||||||||
| State and municipal securities |
123,649 | 6 | (11,442 | ) | 112,213 | (26 | ) | |||||||||||||
|
|
|
|
|
|
|
|
|
|
|
|||||||||||
| Total securities held to maturity |
$ | 308,406 | $ | 65 | $ | (24,555 | ) | $ | 283,916 | $ | (348 | ) | ||||||||
|
|
|
|
|
|
|
|
|
|
|
|||||||||||
| Total securities |
$ | 576,558 | $ | 147 | $ | (34,675 | ) | $ | 542,030 | $ | (348 | ) | ||||||||
|
|
|
|
|
|
|
|
|
|
|
|||||||||||
F-41
Table of Contents
The following tables summarizes the amortized cost, gross unrealized gains and losses, and fair value of securities available for sale and securities held to maturity at December 31, 2022 (dollars in thousands):
| December 31, 2022 | ||||||||||||||||
| Amortized Cost |
Gross Unrealized Gains |
Gross Unrealized (Losses) |
Fair Value | |||||||||||||
| Securities available for sale: |
||||||||||||||||
| U.S. government and federal agencies |
$ | 104,414 | $ | | $ | (5,012 | ) | $ | 99,402 | |||||||
| Mortgage backed securities |
11,489 | 1 | (859 | ) | 10,631 | |||||||||||
| Corporate bonds |
65,856 | 2 | (3,226 | ) | 62,632 | |||||||||||
| State and municipal securities |
114,462 | 52 | (7,583 | ) | 106,931 | |||||||||||
|
|
|
|
|
|
|
|
|
|||||||||
| Total securities available for sale |
$ | 296,221 | $ | 55 | $ | (16,680 | ) | $ | 279,596 | |||||||
|
|
|
|
|
|
|
|
|
|||||||||
| Securities held to maturity: |
||||||||||||||||
| U.S. government and federal agencies |
$ | 125,427 | $ | | $ | (12,696 | ) | $ | 112,731 | |||||||
| Mortgage backed securities |
1,220 | | (26 | ) | 1,194 | |||||||||||
| Corporate bonds |
62,440 | 25 | (4,787 | ) | 57,678 | |||||||||||
| State and municipal securities |
123,480 | | (16,199 | ) | 107,281 | |||||||||||
|
|
|
|
|
|
|
|
|
|||||||||
| Total securities held to maturity |
$ | 312,567 | $ | 25 | $ | (33,708 | ) | $ | 278,884 | |||||||
|
|
|
|
|
|
|
|
|
|||||||||
| Total securities |
$ | 608,788 | $ | 80 | $ | (50,388 | ) | $ | 558,480 | |||||||
|
|
|
|
|
|
|
|
|
|||||||||
There were no holdings of municipal or corporate debt that equaled or exceeded 10.0% of stockholders equity at December 31, 2023 and 2022.
The Company reported a fair value gain of $7 thousand and a fair value loss of $63 thousand in its equity security holding during 2023 and 2022, respectively. The gain and loss were reflected in the other income component of noninterest income on the consolidated statements of income.
Securities with a carrying value of $10.9 million were pledged to secure a line of credit with the Federal Reserve Bank of Richmond, Virginia at December 31, 2022. There were no securities pledged at December 31, 2023.
Proceeds from calls, maturities, paydowns and sales of securities available for sale totaled $50.8 million and $674.8 million for 2023 and 2022, respectively. Proceeds from calls, maturities, paydowns and sales of securities held to maturity totaled $3.2 million and $504 thousand for 2023 and 2022, respectively.
The proceeds, gross realized gains and losses from sales of securities during 2023 were as follows (dollars in thousands):
| Available for Sale | Held to Maturity | |||||||
| Proceeds from sales of securities |
$ | 3,041 | $ | 512 | ||||
| Gross gains |
$ | | $ | | ||||
| Gross losses |
(340 | ) | (49 | ) | ||||
|
|
|
|
|
|||||
| Net losses on sale of a securities |
$ | (340 | ) | $ | (49 | ) | ||
|
|
|
|
|
|||||
| Income tax benefit attributable to realized net losses on sale of securities |
$ | 71 | $ | 10 | ||||
|
|
|
|
|
|||||
Management classifies bonds as HTM only when the Company has the ability and intent to hold the bond to maturity, and certain sales or transfers of HTM bonds could call into question managements ability or intent to hold the remaining HTM bond portfolio to maturity, thereby tainting the entire portfolio. However, there are
F-42
Table of Contents
limited situations, including evidence of deterioration in the issuers creditworthiness, in which the Company could sell an HTM bond without tainting the remaining HTM portfolio. During 2023, the Company sold one HTM bond due to significant documented deterioration of the issuers creditworthiness evidenced by the downgrading of the issuers public credit rating, mass litigation and increased regulatory concerns. Under these circumstances, the sale did not taint the HTM portfolio.
There were no sales of securities in 2022.
The amortized cost and fair value of debt securities by contractual maturity at December 31, 2023 is as follows (dollars in thousands):
| Available for Sale | Held to Maturity | |||||||||||||||
| Amortized Cost |
Fair Value | Amortized Cost |
Fair Value | |||||||||||||
| Within one year |
$ | 98,751 | $ | 97,304 | $ | 3,896 | $ | 3,802 | ||||||||
| After one year through five years |
125,038 | 120,120 | 182,100 | 171,691 | ||||||||||||
| After five years through ten years |
38,668 | 35,442 | 118,043 | 104,677 | ||||||||||||
| Over ten years |
5,695 | 5,248 | 4,367 | 3,746 | ||||||||||||
|
|
|
|
|
|
|
|
|
|||||||||
| Total |
$ | 268,152 | $ | 258,114 | $ | 308,406 | $ | 283,916 | ||||||||
|
|
|
|
|
|
|
|
|
|||||||||
Expected maturities may differ from contractual maturities if borrowers have the right to call or repay obligations with or without prepayment penalties.
The following table shows the gross unrealized losses and fair value of the Companys AFS securities with unrealized losses aggregated by investment category and length of time that individual securities have been in a continuous unrealized loss position at December 31, 2023 (dollars in thousands):
| December 31, 2023 | ||||||||||||||||||||||||
| Less Than Twelve Months | Over Twelve Months | Total | ||||||||||||||||||||||
| Gross Unrealized Loss |
Fair Value | Gross Unrealized Loss |
Fair Value | Gross Unrealized Loss |
Fair Value | |||||||||||||||||||
| Securities available for sale: |
||||||||||||||||||||||||
| U.S. government and federal agencies |
$ | (16 | ) | $ | 5,860 | $ | (2,848 | ) | $ | 70,906 | $ | (2,864 | ) | $ | 76,766 | |||||||||
| Mortgage backed securities |
| | (609 | ) | 8,604 | (609 | ) | 8,604 | ||||||||||||||||
| Corporate bonds |
(3 | ) | 2,482 | (1,834 | ) | 51,987 | (1,837 | ) | 54,469 | |||||||||||||||
| State and municipal securities |
(31 | ) | 3,675 | (4,779 | ) | 89,828 | (4,810 | ) | 93,503 | |||||||||||||||
|
|
|
|
|
|
|
|
|
|
|
|
|
|||||||||||||
| Total securities available for sale |
$ | (50 | ) | $ | 12,017 | $ | (10,070 | ) | $ | 221,325 | $ | (10,120 | ) | $ | 233,342 | |||||||||
|
|
|
|
|
|
|
|
|
|
|
|
|
|||||||||||||
F-43
Table of Contents
The following table shows the gross unrealized losses and fair value of the Companys securities with unrealized losses aggregated by investment category and length of time that individual securities have been in a continuous unrealized loss position at December 31, 2022 (dollars in thousands):
| December 31, 2022 | ||||||||||||||||||||||||
| Less Than Twelve Months |
Over Twelve Months | Total | ||||||||||||||||||||||
| Gross Unrealized Losses |
Fair Value | Gross Unrealized Losses |
Fair Value | Gross Unrealized Loss |
Fair Value | |||||||||||||||||||
| Securities available for sale: |
||||||||||||||||||||||||
| U.S. government and federal agencies |
$ | (1,213 | ) | $ | 55,004 | $ | (3,799 | ) | $ | 44,398 | $ | (5,012 | ) | $ | 99,402 | |||||||||
| Mortgage backed securities |
(858 | ) | 10,528 | (1 | ) | 66 | (859 | ) | 10,594 | |||||||||||||||
| Corporate bonds |
(1,249 | ) | 41,303 | (1,977 | ) | 19,849 | (3,226 | ) | 61,152 | |||||||||||||||
| State and municipal securities |
(4,280 | ) | 83,288 | (3,303 | ) | 22,127 | (7,583 | ) | 105,415 | |||||||||||||||
|
|
|
|
|
|
|
|
|
|
|
|
|
|||||||||||||
| Total securities available for sale |
$ | (7,600 | ) | $ | 190,123 | $ | (9,080 | ) | $ | 86,440 | $ | (16,680 | ) | $ | 276,563 | |||||||||
|
|
|
|
|
|
|
|
|
|
|
|
|
|||||||||||||
| Securities held to maturity: |
||||||||||||||||||||||||
| U.S. government and federal agencies |
$ | (2,276 | ) | $ | 27,780 | $ | (10,420 | ) | $ | 84,951 | $ | (12,696 | ) | $ | 112,731 | |||||||||
| Mortgage backed securities |
(26 | ) | 1,194 | | | (26 | ) | 1,194 | ||||||||||||||||
| Corporate bonds |
(1,142 | ) | 15,390 | (3,645 | ) | 39,876 | (4,787 | ) | 55,266 | |||||||||||||||
| State and municipal securities |
(4,407 | ) | 43,778 | (11,792 | ) | 63,503 | (16,199 | ) | 107,281 | |||||||||||||||
|
|
|
|
|
|
|
|
|
|
|
|
|
|||||||||||||
| Total securities held to maturity |
$ | (7,851 | ) | $ | 88,142 | $ | (25,857 | ) | $ | 188,330 | $ | (33,708 | ) | $ | 276,472 | |||||||||
|
|
|
|
|
|
|
|
|
|
|
|
|
|||||||||||||
| Total securities |
$ | (15,451 | ) | $ | 278,265 | $ | (34,937 | ) | $ | 274,770 | $ | (50,388 | ) | $ | 553,035 | |||||||||
|
|
|
|
|
|
|
|
|
|
|
|
|
|||||||||||||
In the AFS portfolio, at December 31, 2023, 71 out of 79 securities of the U.S. government and federal agencies, 17 out of 21 mortgage backed securities, 119 out of 120 corporate bonds, and 284 out of 304 state and municipal securities were in an unrealized loss position. All of the Companys investment portfolio was evaluated under the monitoring process described in Note 1, and all investments were deemed investment grade. All of the unrealized losses are attributed to changes in market interest rates, and are not a result of deterioration of creditworthiness among any of the issuers.
Of the total portfolio, at December 31, 2023 and 2022, 880 and 963 debt securities had unrealized losses with aggregate impairment of 6.0% and 8.3%, respectively, of the Banks amortized cost basis. These unrealized losses related principally to interest rate movements and not the creditworthiness of the issuer. In analyzing an issuers financial condition, management considers whether the securities are issued by the federal government or its agencies, whether downgrades by bond rating agencies have occurred, and industry analysts reports. Credit loss allowances for the AFS and HTM portfolios are described in the following sections.
Allowance for Credit LossesAFS Securities
Management evaluates securities to determine whether the unrealized loss is due to credit-related factors or non-credit-related factors. This analysis occurs on at least a quarterly basis, and more frequently when economic or market concerns warrant such an evaluation. Consideration is given to the extent to which fair value is less than cost, the financial condition and near-term prospects of the issuer, and the intent and ability of the Company to retain its investment in the security for a period of time sufficient to allow for full recovery of its amortized cost. If the assessment reveals that a credit loss exists, the present value of the expected cash flows of the security is compared to the amortized cost basis of the security. If the present value of future cash flows expected to be collected is less than the amortized cost, an allowance for the credit loss is recorded. The loss is limited by the amount that the amortized cost exceeds fair value. Prior to implementation of the CECL standard, unrealized losses caused by a credit event required the direct write-down of the security through the other-than-temporary impairment approach.
F-44
Table of Contents
As of the reporting date, the Company did not intend to sell any of the AFS securities, did not expect to be required to sell these securities, and expected to recover the entire amortized cost basis of all of the securities.
The Company did not record an ACL on the AFS securities at December 31, 2023. The Company has evaluated these securities for credit-related impairment at the reporting date and concluded that no impairment existed. In analyzing an issuers financial condition, management considers whether the securities are issued by the federal government or its agencies, whether downgrades by bond rating agencies have occurred, industry analysts reports, and correlations between fair value changes and interest rate changes among instruments that are not credit sensitive. The Company considers the unrealized losses on the securities as of December 31, 2023 to be related to fluctuations in market conditions, primarily interest rates, and is not reflective of deterioration in credit.
The table below presents a rollforward by major security type for the year ended December 31, 2023 of the allowance for credit losses on AFS debt securities held at period end (dollars in thousands):
| December 31, 2023 | ||||||||||||||||||||
| U.S. government and federal agency |
Agency mortgage backed securities |
Corporate bonds |
State and municipal securities |
Total AFS securities |
||||||||||||||||
| Allowance for credit losses: |
||||||||||||||||||||
| Beginning balance, December 31, 2022 |
$ | | $ | | $ | | $ | | $ | | ||||||||||
| Impact of adopting ASC 326 |
| | | | | |||||||||||||||
| Additions for securities for which no previous expected credit losses were recognized |
| | 785 | | 785 | |||||||||||||||
| Write offs charged against the allowance |
| | (785 | ) | | (785 | ) | |||||||||||||
| Recoveries of amounts previously written off |
| | | | | |||||||||||||||
|
|
|
|
|
|
|
|
|
|
|
|||||||||||
| Ending balance, December 31, 2023 |
$ | | $ | | $ | | $ | | $ | | ||||||||||
|
|
|
|
|
|
|
|
|
|
|
|||||||||||
The ACL recorded for the AFS portfolio during 2023 pertained to a holding from a single corporate issuer whose business was ultimately closed by a regulatory authority. The bond, initially classified as HTM, was transferred to the AFS portfolio based on the unlikely collectability of the unsecured bond and significant documented credit deterioration. A portion of the bond was subsequently sold at a loss, and the remaining unsold portion was written off entirely.
In years prior to the adoption of the CECL allowance methodology on January 1, 2023, the Bank recognized other than temporary impairment (OTTI) from bonds classified as available for sale. The Bank recorded subsequent OTTI recoveries totaling $13 thousand and $7 thousand, in 2023 and 2022, respectively, as other income on the consolidated statements of income.
Credit Quality Indicators and Allowance for Credit LossesHTM Securities
The Company evaluates the credit risk of its HTM securities on at least a quarterly basis. The Company estimates expected credit losses on HTM debt securities using an instrument-level process described in Note 1. The primary indicators of credit quality for the Companys HTM portfolio are security type, time remaining to maturity, and credit rating. Credit ratings may be influenced by a number of factors included obligor cash flows, geography, seniority and others. The HTM portfolio includes bonds issued by the U.S. Treasury and agencies of the federal government, and mortgage-backed securities issued by government agencies. These types of investments carry implicit or explicit backing of the U.S. Treasury, and therefore are deemed to carry no credit risk for purposes of the ACL evaluation.
F-45
Table of Contents
The following table presents the amortized cost of HTM securities as of December 31, 2023 by security type and credit rating (dollars in thousands):
| December 31, 2023 | ||||||||||||||||||||
| U.S. government and federal agency |
Agency mortgage backed securities |
Corporate bonds |
State and municipal securities |
Total HTM securities |
||||||||||||||||
| AAA / AA / A |
$ | 123,938 | $ | 1,190 | $ | 20,091 | $ | 123,168 | $ | 268,387 | ||||||||||
| BBB / BB / B |
| | 39,538 | 481 | 40,019 | |||||||||||||||
| Not ratedAgency |
| | | | | |||||||||||||||
| Not ratedNon-Agency |
| | | | | |||||||||||||||
|
|
|
|
|
|
|
|
|
|
|
|||||||||||
| Total |
$ | 123,938 | $ | 1,190 | $ | 59,629 | $ | 123,649 | $ | 308,406 | ||||||||||
|
|
|
|
|
|
|
|
|
|
|
|||||||||||
The following table summarizes the change in the allowance for credit losses on held to maturity securities during 2023 (dollars in thousands):
| December 31, 2023 | ||||||||||||||||||||
| U.S. government and federal agency |
Agency mortgage backed securities |
Corporate bonds |
State and municipal securities |
Total HTM securities |
||||||||||||||||
| Allowance for credit losses: |
||||||||||||||||||||
| Beginning balance, December 31, 2022 |
$ | | $ | | $ | | $ | | $ | | ||||||||||
| Impact of adopting ASC 326 |
| | 303 | 26 | 329 | |||||||||||||||
| Credit loss provision |
| | 19 | | 19 | |||||||||||||||
| Securities charged-off |
| | | | | |||||||||||||||
| Recoveries of amounts previously written off |
| | | | | |||||||||||||||
|
|
|
|
|
|
|
|
|
|
|
|||||||||||
| Ending balance, December 31, 2023 |
$ | | $ | | $ | 322 | $ | 26 | $ | 348 | ||||||||||
|
|
|
|
|
|
|
|
|
|
|
|||||||||||
At December 31, 2023, the Company had no HTM securities that were 30 days or more past due as to principal and interest payments. The Company had no securities held to maturity classified as non-accrual as of December 31, 2023.
Note 3. Loans and Allowance for Loan Credit Losses
A summary of the balances of loans are as follows (dollars in thousands):
| December 31, | ||||||||
| 2023 | 2022 | |||||||
| Commercial real estate |
$ | 60,138 | $ | 62,258 | ||||
| Commercial |
12,438 | 31,814 | ||||||
| Residential real estate closed-end |
210,358 | 202,972 | ||||||
| Other consumer loans |
21,210 | 23,149 | ||||||
|
|
|
|
|
|||||
| $ | 304,144 | $ | 320,193 | |||||
| Less allowance for credit losses |
(4,319 | ) | (4,482 | ) | ||||
|
|
|
|
|
|||||
| Loans, net |
$ | 299,825 | $ | 315,711 | ||||
|
|
|
|
|
|||||
Overdrafts totaling $10 thousand and $9 thousand at December 31, 2023 and 2022, respectively, were reclassified from deposits to loans.
F-46
Table of Contents
The totals above include deferred costs (net of deferred fees) of $466 thousand at December 31, 2023 and $334 thousand at December 31, 2022.
The Bank participated as a lender in the U.S. Small Business Administrations (SBA) Paycheck Protection Program (PPP) to support local small businesses and non-profit organizations. The Banks remaining PPP loan portfolio closed during 2022 as a result of pay downs or SBA foregiveness granted in the amount of $21.3 million. The Bank recorded the remaining loan origination fee income (net of origination costs) of $457 thousand during 2022. With the payoff of the PPP loan portfolio, the loan loss reserve attributable to the PPP program was no longer recorded at December 31, 2022.
On January 1, 2023, the Company adopted the Current Expected Credit Loss methodology as required under FASB ASC Topic 326. The measurement of expected credit losses under the CECL methodology is applicable to financial assets measured at amortized cost, including loan receivables. For further discussion about the Companys accounting policies, refer to Note 1Organization and Summary of Significant Accounting Policies. All information presented as of December 31, 2023 is in accordance with ASC 326, and prior periods are in accordance with the previously applicable standard.
Under the CECL methodology, management uses the weighted average remaining maturity method to calculate quantitative allowances for all collectively evaluated loan categories. Management generally segments loans based on their federal call codes in order to aggregate loans with similar risk characteristics.
If a loan does not share risk characteristics with a pool of other loans, expected credit losses are then measured on the individual loan basis. When a loans expected credit loss is measured individually, it is excluded from any collective assessment. Management will individually evaluate the expected credit loss for any loans that are collateral dependent, are graded substandard or doubtful, or are otherwise determined to have risk characteristics that are dissimilar to the established loan pools. The individual evaluation will consider collateral value, an observable market price, or the present value of future cash flows. If the measured value of the loan using one of these methods is less than the carrying value of the loan, a specific reserve is applied to the loan in the amount of the difference.
Management then considers whether further adjustments to historical loss information are needed to reflect the extent to which current conditions and reasonable and supportable forecasts differ from the conditions that existed during the historical loss period. Adjustments to historical loss information may be quantitative or qualitative in nature and reflect changes to relevant data such as changes in unemployment rates, delinquency, or other factors associated with the financial assets. The qualitative risk factor adjustments applied by management are substantially similar to those contemplated under the legacy framework and are described in Note 1.
The following table presents the activity in the allowance for credit losses, including the adoption of CECL, by portfolio segment for the year ended December 31, 2023 (dollars in thousands):
| December 31, 2023 | ||||||||||||||||||||
| Commercial Real Estate |
Commercial | Residential Real Estate Closed-End |
Other Consumer Loans |
Total | ||||||||||||||||
| Allowance for credit losses: |
||||||||||||||||||||
| Beginning balance |
$ | 905 | $ | 573 | $ | 2,650 | $ | 354 | $ | 4,482 | ||||||||||
| Impact of adopting ASC 326 |
130 | 19 | (16 | ) | (133 | ) | | |||||||||||||
| Credit loss provision (recapture) |
198 | (403 | ) | 34 | 8 | (163 | ) | |||||||||||||
| Loans charged-off |
| | | | | |||||||||||||||
| Recoveries collected |
| | | | | |||||||||||||||
|
|
|
|
|
|
|
|
|
|
|
|||||||||||
| Ending allowance balance |
$ | 1,233 | $ | 189 | $ | 2,668 | $ | 229 | $ | 4,319 | ||||||||||
|
|
|
|
|
|
|
|
|
|
|
|||||||||||
F-47
Table of Contents
The information in the table below is not required for periods after the adoption of CECL. It summarizes the activity in the allowance for loan losses and the recorded investment in loans and impairment method by portfolio segment as of December 31, 2022 (dollars in thousands):
| December 31, 2022 | ||||||||||||||||||||
| Commercial Real Estate |
Commercial |
Residential Real Estate Closed-End |
Other Consumer Loans |
Total | ||||||||||||||||
| Allowance for loan losses: |
||||||||||||||||||||
| Beginning of year |
$ | 875 | $ | 208 | $ | 2,284 | $ | 293 | $ | 3,660 | ||||||||||
| Provision |
30 | 365 | 366 | 61 | 822 | |||||||||||||||
| Charge-offs |
| | | | | |||||||||||||||
| Recoveries of charge-offs |
| | | | | |||||||||||||||
|
|
|
|
|
|
|
|
|
|
|
|||||||||||
| End of year |
$ | 905 | $ | 573 | $ | 2,650 | $ | 354 | $ | 4,482 | ||||||||||
|
|
|
|
|
|
|
|
|
|
|
|||||||||||
| Reserves: |
||||||||||||||||||||
| Specific |
$ | | $ | | $ | | $ | | $ | | ||||||||||
| General |
905 | 573 | 2,650 | 354 | 4,482 | |||||||||||||||
|
|
|
|
|
|
|
|
|
|
|
|||||||||||
| Total reserves |
$ | 905 | $ | 573 | $ | 2,650 | $ | 354 | $ | 4,482 | ||||||||||
|
|
|
|
|
|
|
|
|
|
|
|||||||||||
| Loans evaluated for impairment: |
||||||||||||||||||||
| Individually |
$ | | $ | | $ | | $ | | $ | | ||||||||||
| Collectively |
62,258 | 31,814 | 202,972 | 23,149 | 320,193 | |||||||||||||||
|
|
|
|
|
|
|
|
|
|
|
|||||||||||
| Total Loans |
$ | 62,258 | $ | 31,814 | $ | 202,972 | $ | 23,149 | $ | 320,193 | ||||||||||
|
|
|
|
|
|
|
|
|
|
|
|||||||||||
Prior to the adoption of CECL, loans were considered impaired when, based on current information and events as of the measurement date, it was probable that the Company would be unable to collect all amounts due in accordance with the contractual terms of the loan agreements. There were no impaired loans as of December 31, 2022.
There were no nonaccrual loans, loans 90 days past due and still accruing, or past due for 30 or more days at December 31, 2023 and 2022.
The Company categorizes loans into risk categories based on relevant information about the ability of borrowers to service their debt such as: current financial information, historical payment experience, credit documentation, public information and current economic trends, among other factors. The Companys loan risk grading system and ongoing monitoring process is discussed in Note 1. The following table presents the outstanding balance of
F-48
Table of Contents
the loan portfolio, by year of origination, loan classification, and credit quality, as of December 31, 2023 (dollars in thousands):
| Term Loans by Year of Origination |
Revolving Loans |
Revolving to Term Loans |
Total | |||||||||||||||||||||||||||||||||
| 2023 | 2022 | 2021 | 2020 | 2019 | Prior | |||||||||||||||||||||||||||||||
| Commercial real estate |
||||||||||||||||||||||||||||||||||||
| Pass |
$ | 849 | $ | 5,521 | $ | 9,327 | $ | 3,713 | $ | 8,015 | $ | 21,875 | $ | | $ | 8,895 | $ | 58,195 | ||||||||||||||||||
| Special Mention |
| | | | | 1,570 | | | 1,570 | |||||||||||||||||||||||||||
| Substandard |
| | | | | 373 | | | 373 | |||||||||||||||||||||||||||
| Doubtful |
| | | | | | | | | |||||||||||||||||||||||||||
| Loss |
| | | | | | | | | |||||||||||||||||||||||||||
|
|
|
|
|
|
|
|
|
|
|
|
|
|
|
|
|
|
|
|||||||||||||||||||
| Total |
$ | 849 | $ | 5,521 | $ | 9,327 | $ | 3,713 | $ | 8,015 | $ | 23,818 | $ | | $ | 8,895 | $ | 60,138 | ||||||||||||||||||
|
|
|
|
|
|
|
|
|
|
|
|
|
|
|
|
|
|
|
|||||||||||||||||||
| Current period gross charge-offs |
$ | | $ | | $ | | $ | | $ | | $ | | $ | | $ | | $ | | ||||||||||||||||||
|
|
|
|
|
|
|
|
|
|
|
|
|
|
|
|
|
|
|
|||||||||||||||||||
| Commercial |
||||||||||||||||||||||||||||||||||||
| Pass |
$ | | $ | 573 | $ | 14 | $ | 42 | $ | 1,352 | $ | 309 | $ | 10,148 | $ | | $ | 12,438 | ||||||||||||||||||
| Special Mention |
| | | | | | | | | |||||||||||||||||||||||||||
| Substandard |
| | | | | | | | | |||||||||||||||||||||||||||
| Doubtful |
| | | | | | | | | |||||||||||||||||||||||||||
| Loss |
| | | | | | | | | |||||||||||||||||||||||||||
|
|
|
|
|
|
|
|
|
|
|
|
|
|
|
|
|
|
|
|||||||||||||||||||
| Total |
$ | | $ | 573 | $ | 14 | $ | 42 | $ | 1,352 | $ | 309 | $ | 10,148 | $ | | $ | 12,438 | ||||||||||||||||||
|
|
|
|
|
|
|
|
|
|
|
|
|
|
|
|
|
|
|
|||||||||||||||||||
| Current period gross charge-offs |
$ | | $ | | $ | | $ | | $ | | $ | | $ | | $ | | $ | | ||||||||||||||||||
|
|
|
|
|
|
|
|
|
|
|
|
|
|
|
|
|
|
|
|||||||||||||||||||
| Residential real estate closed end |
||||||||||||||||||||||||||||||||||||
| Pass |
$ | 20,230 | $ | 45,920 | $ | 45,528 | $ | 25,150 | $ | 18,035 | $ | 55,253 | $ | | $ | | $ | 210,116 | ||||||||||||||||||
| Special Mention |
| | | | | | | | | |||||||||||||||||||||||||||
| Substandard |
| | | | | 242 | | | 242 | |||||||||||||||||||||||||||
| Doubtful |
| | | | | | | | | |||||||||||||||||||||||||||
| Loss |
| | | | | | | | | |||||||||||||||||||||||||||
|
|
|
|
|
|
|
|
|
|
|
|
|
|
|
|
|
|
|
|||||||||||||||||||
| Total |
$ | 20,230 | $ | 45,920 | $ | 45,528 | $ | 25,150 | $ | 18,035 | $ | 55,495 | $ | | $ | | $ | 210,358 | ||||||||||||||||||
|
|
|
|
|
|
|
|
|
|
|
|
|
|
|
|
|
|
|
|||||||||||||||||||
| Current period gross charge-offs |
$ | | $ | | $ | | $ | | $ | | $ | | $ | | $ | | $ | | ||||||||||||||||||
|
|
|
|
|
|
|
|
|
|
|
|
|
|
|
|
|
|
|
|||||||||||||||||||
| Other consumer loans |
||||||||||||||||||||||||||||||||||||
| Pass |
$ | | $ | | $ | 32 | $ | | $ | | $ | | $ | 17,703 | $ | 3,475 | $ | 21,210 | ||||||||||||||||||
| Special Mention |
| | | | | | | | | |||||||||||||||||||||||||||
| Substandard |
| | | | | | | | | |||||||||||||||||||||||||||
| Doubtful |
| | | | | | | | | |||||||||||||||||||||||||||
| Loss |
| | | | | | | | | |||||||||||||||||||||||||||
|
|
|
|
|
|
|
|
|
|
|
|
|
|
|
|
|
|
|
|||||||||||||||||||
| Total |
$ | | $ | | $ | 32 | $ | | $ | | $ | | $ | 17,703 | $ | 3,475 | $ | 21,210 | ||||||||||||||||||
|
|
|
|
|
|
|
|
|
|
|
|
|
|
|
|
|
|
|
|||||||||||||||||||
| Current period gross charge-offs |
$ | | $ | | $ | | $ | | $ | | $ | | $ | | $ | | $ | | ||||||||||||||||||
|
|
|
|
|
|
|
|
|
|
|
|
|
|
|
|
|
|
|
|||||||||||||||||||
F-49
Table of Contents
The amortized cost of outstanding loans by credit quality indicators as of December 31, 2022 (dollars in thousands):
| December 31, 2022 | ||||||||||||||||||||||||
| Pass | Special Mention |
Substandard | Doubtful | Loss | Total | |||||||||||||||||||
| Commercial real estate |
$ | 60,221 | $ | 1,627 | $ | 410 | $ | | $ | | $ | 62,258 | ||||||||||||
| Commercial |
31,814 | | | | | 31,814 | ||||||||||||||||||
| Residential real estate closed-end |
202,972 | | | | | 202,972 | ||||||||||||||||||
| Other consumer loans |
23,149 | | | | | 23,149 | ||||||||||||||||||
|
|
|
|
|
|
|
|
|
|
|
|
|
|||||||||||||
| Total Loans |
$ | 318,156 | $ | 1,627 | $ | 410 | $ | | $ | | $ | 320,193 | ||||||||||||
|
|
|
|
|
|
|
|
|
|
|
|
|
|||||||||||||
Collateral Dependent Loans
FASB ASC Topic 326 describes a collateral-dependent asset as a financial asset for which the repayment is expected to be provided substantially through the operation or sale of the collateral when the borrower, based on managements assessment, is experiencing financial difficulty as of the reporting date. Whether the underlying collateral is expected to be a substantial source of repayment for an asset depends on the availability, reliability, and capacity of sources other than the collateral to repay the debt. Collateral-dependent loans are individually evaluated for expected credit losses as of the reporting date, and they are removed from their respective pools of collectively evaluated assets. Expected credit losses for these types of assets are based on the fair value of the collateral at the measurement date, adjusted for estimated selling costs. There were no collateral-dependent loans that were individually evaluated for purposes of determining the allowance for credit loss under FASB ASC Topic 326 as of December 31, 2023.
Occasionally, the Company modifies loans to borrowers in financial distress by providing principal forgiveness, term extension, and other-than-insignificant payment delay or interest rate reduction. When principal forgiveness is provided, the amount of forgiveness is charged-off against the allowance for credit losses. During 2023, there were no loan modifications provided to borrowers exhibiting financial distress. During 2023 and 2022, there were no payment defaults from loans which had been modified due to borrower financial difficulty during the twelve months preceding the default.
Note 4. Premises and Equipment
A summary of the cost and accumulated depreciation of premises and equipment follows (dollars in thousands):
| December 31, | ||||||||
| 2023 | 2022 | |||||||
| Land |
$ | 2,258 | $ | 2,258 | ||||
| Building |
9,231 | 9,231 | ||||||
| Furniture, fixtures and equipment |
2,280 | 2,095 | ||||||
| Building improvements |
2,416 | 2,402 | ||||||
| Construction in process |
464 | 394 | ||||||
|
|
|
|
|
|||||
| $ | 16,649 | $ | 16,380 | |||||
| Less accumulated depreciation |
6,791 | 6,300 | ||||||
|
|
|
|
|
|||||
| Ending balance |
$ | 9,858 | $ | 10,080 | ||||
|
|
|
|
|
|||||
For 2023 and 2022, depreciation expense was $491 thousand and $501 thousand, respectively.
F-50
Table of Contents
Note 5. Related Party Transactions
Officers, directors and their affiliates had credit outstanding of $6.9 million and $12.6 million at December 31, 2023 and 2022, respectively, with the Company. During 2023, total principal payments were $185 thousand. The remaining decrease in the credit outstanding of $5.4 million relates to the cumulative effect of changes in the composition of related parties. These transactions occurred in the ordinary course of business on substantially the same terms as those prevailing at the time for comparable transactions with unrelated persons.
Deposits from related parties held by the Company at December 31, 2023 and 2022 amounted to $2.0 million and $15.2 million, respectively.
Note 6. Deposits
Remaining maturities on certificates of deposit are as follows (dollars in thousands):
| 2024 |
$ | 15,617 | ||
| 2025 |
1,008 | |||
| 2026 |
117 | |||
| 2027 and thereafter |
| |||
|
|
|
|||
| $ | 16,742 | |||
|
|
|
The Bank held no deposits classified as brokered at December 31, 2023 or 2022. To achieve full FDIC insurance, some of the Banks depositors have enrolled in the Insured Cash Sweep program offered by the Bank through the Intrafi network. When accounts are enrolled in this service, the Bank must elect, for each account, whether it will receive a reciprocal deposit balance or sell the deposit balance. At December 31, 2023 and 2022, the Bank held $177.3 million and $78.2 million of reciprocal deposits through Insured Cash Sweep services on its consolidated balance sheets. Accounts that are sold to the network are excluded from the Companys consolidated balance sheets. The Company receives fee income for sold accounts, which is included in deposit placement services income on the consolidated statements of income.
FDIC deposit insurance covers $250 thousand per depositor, per FDIC-insured bank, for each account ownership category. The Company estimates uninsured deposits held at the Bank as of December 31, 2023 are $648.0 million, which is 58.3% of total deposits.
There were no clients whose individual deposit balances exceeded 5.0% of total deposits as of December 31, 2023. There was one client with an individual deposit balance exceeding 5.0% of total deposits as of December 31, 2022. The total deposit balance related to this client as of December 31, 2022 was $54.1 million or 5.7% of total deposits.
Note 7. Borrowings
Federal Home Loan Bank Advance
The Bank has a secured line of credit with the Federal Home Loan Bank, which is renewed annually in December. The Bank pledges 1-4 family residential real estate loans within the Banks loan portfolio to establish credit availability. At December 31, 2023, the secured line of credit had no collateral pledged and therefore no available or outstanding balance. At December 31, 2022, for the same secured line, the Bank had pledged collateral to provide credit availability of $1.5 million with no outstanding balance.
Short Term Borrowings
At December 31, 2023 and 2022, the Company had an unsecured line of credit from a correspondent bank totaling $10.0 million with an outstanding balance of $5.0 million. The line matures December 5, 2024 and
F-51
Table of Contents
contains certain covenants regarding the Companys return on average assets, risk-based capital, and level of non-performing assets. The interest rate on the line of credit was 7.95% and 6.44% at December 31, 2023 and 2022, respectively. As of December 6, 2023, the agreement was amended to require payment of a quarterly unused commitment fee at the rate of 1.00% per annum on the undisbursed and uncanceled daily balance during the preceding quarter.
The Bank has unsecured federal fund purchase lines of credit with Community Bankers Bank totaling $8.0 million maturing March 20, 2024, First National Bankers Bank totaling $10.0 million maturing on June 30, 2024 and Pacific Coast Bankers Bank totaling $50.0 million maturing June 30, 2024. There were no outstanding federal funds purchased balances as of December 31, 2023 or 2022.
Note 8. Income Taxes
The tax effects of temporary differences that give rise to significant portions of the deferred tax assets and deferred tax liabilities at December 31, 2023 and 2022 are presented below (dollars in thousands):
| December 31, | ||||||||
| 2023 | 2022 | |||||||
| Deferred Tax Assets |
||||||||
| Securities available for sale |
$ | 3,074 | $ | 4,691 | ||||
| Allowance for loan credit losses |
907 | 941 | ||||||
| Deferred compensation |
331 | 262 | ||||||
| Loss on devalued bond |
95 | | ||||||
| Depreciation |
83 | 85 | ||||||
| Allowance for securities credit losses |
73 | | ||||||
| Other |
16 | 20 | ||||||
|
|
|
|
|
|||||
| $ | 4,579 | $ | 5,999 | |||||
|
|
|
|
|
|||||
| Deferred Tax Liabilities |
||||||||
| Deferred loan costs |
$ | (98 | ) | $ | (70 | ) | ||
|
|
|
|
|
|||||
| $ | (98 | ) | $ | (70 | ) | |||
|
|
|
|
|
|||||
| Net deferred tax assets |
$ | 4,481 | $ | 5,929 | ||||
|
|
|
|
|
|||||
Deferred tax assets are reported as other assets on the consolidated balance sheets.
The provision for income taxes charged to operations for the years ended December 31, 2023 and 2022, consists of the following (dollars in thousands):
| December 31, | ||||||||
| 2023 | 2022 | |||||||
| Current tax expense |
$ | 2,174 | $ | 2,051 | ||||
| Deferred tax benefit |
(99 | ) | (169 | ) | ||||
|
|
|
|
|
|||||
| Net provision for income taxes |
$ | 2,075 | $ | 1,882 | ||||
|
|
|
|
|
|||||
F-52
Table of Contents
The reasons for the difference between the Companys reported income tax expense and the amount computed by multiplying the statutory rate are as follows (dollars in thousands):
| December 31, | ||||||||
| 2023 | 2022 | |||||||
| Computed tax at applicable rate |
$ | 2,290 | $ | 2,134 | ||||
| Tax-exempt income |
(254 | ) | (269 | ) | ||||
| Other |
39 | 17 | ||||||
|
|
|
|
|
|||||
| Net provision for income taxes |
$ | 2,075 | $ | 1,882 | ||||
|
|
|
|
|
|||||
The Company files an income tax return in the U.S. federal jurisdiction and is subject to the bank franchise tax in the Commonwealth of Virginia. With few exceptions, the Company is no longer subject to federal or state tax examinations for years prior to 2020.
Note 9. Financial Instruments With Off-Balance-Sheet Risk
The Company is party to credit related financial instruments with off-balance-sheet risk in the normal course of business to meet the financing needs of its clients. These financial instruments include commitments to extend credit and standby letters of credit. Such commitments involve, to varying degrees, elements of credit and interest rate risk in excess of the amount recognized in the consolidated balance sheets.
The Companys exposure to credit loss is represented by the contractual amount of these commitments. The Company follows the same credit policies in making commitments as it does for on-balance-sheet instruments.
At December 31, 2023 and 2022, the contractual amounts of financial instruments with off-balance commitments are as follows (dollars in thousands):
| December 31, | ||||||||
| 2023 | 2022 | |||||||
| Commitments to grant loans |
$ | | $ | 7,738 | ||||
| Unfunded commitments under lines of credit |
22,947 | 29,159 | ||||||
| Standby letters of credit |
3,598 | 3,274 | ||||||
Commitments to grant loans are agreements to extend loans to clients provided the clients are in compliance with terms and conditions outlined in the respective loan documents. These commitments often come with specific expiration dates or other termination conditions, such as maturity dates, and may necessitate the payment of fees. Notably, lines of credit commitments might expire without being utilized, implying that the total commitment amounts do not accurately forecast future cash outflows. For collateral requirements, the Bank determines the necessity and amount based on an analysis of the borrower.
Unfunded commitments under lines of credit represent potential future credit extensions to current clients. Commercial lines of credit typically feature maturity dates within one year and do not automatically renew. Conversely, consumer revolving lines of credit and home equity lines, offer draw periods ranging from three to ten years, respectively, also without automatic renewal. These lines of credit are discretionary, with actual funding potentially falling short of the full commitment amount.
Standby letters of credit are conditional commitments by the Bank, serving as guarantees of a clients performance to a third party. These instruments are typically utilized to facilitate both public and private borrowing arrangements. Almost all letters of credit issued are set to expire within one year, subject to automatic renewal unless terminated by the Bank in accordance with the terms of the agreement. The credit risk associated with issuing letters of credit mirrors that of extending traditional loan facilities to clients, with collateral being secured as deemed necessary by the Bank.
F-53
Table of Contents
Note 10. Minimum Regulatory Capital Requirements
The Bank is subject to various regulatory capital requirements administered by the federal banking agencies. Failure to meet minimum capital requirements can initiate certain mandatory, possibly additional discretionary, actions by regulators that, if undertaken, could have a direct material effect on the Companys and the Banks financial statements. Under capital adequacy guidelines and the regulatory framework for prompt corrective action, financial institutions must meet specific capital guidelines that involve quantitative measures of assets, liabilities, and certain off-balance-sheet items as calculated under regulatory accounting practices. A financial institutions capital amounts and classification are also subject to qualitative judgments by the regulators about components, risk weightings, and other factors. Prompt corrective action provisions are not applicable to bank holding companies.
The final rules implementing Basel Committee on Banking Supervisions Capital guidelines for U.S. banks (Basel III rules) became effective on January 1, 2015, with full compliance with all of the new requirements being phased in over a multi-year schedule, and fully phased in by January 1, 2019. Under the Basel III rules, the Bank must hold a capital conservation buffer above the adequately capitalized risk-based capital ratios. The capital conservation buffer was implemented in a phased approach from 0.0% for 2015 to 2.5% by 2019. Although the capital conservation buffer is not part of regulatory minimum risk-based capital requirements, it does determine the minimums that must be met to avoid limitation on paying dividends, engaging in share repurchases, and paying discretionary bonuses if capital levels fall below the buffer amount. The net unrealized gain or loss on securities available for sale is not included in computing regulatory capital.
Quantitative measures established by regulation to ensure capital adequacy require financial institutions to maintain minimum amounts and ratios (set forth in the table below) of Total, Tier 1, and common equity Tier 1 (as defined in the regulations) to risk-weighted assets (as defined), and of Tier 1 capital (as defined) to average assets (as defined). Management believes, as of December 31, 2023, that the Bank meets all capital adequacy requirements to which it is subject.
To be categorized as well capitalized under the OCCs regulatory framework for prompt corrective action, the Bank must maintain minimum Total risk-based, Tier 1 risk-based, common equity Tier 1 and Tier 1 leverage ratios as set forth in the table. The Bank currently satisfies the requirement under the OCCs capital regulation to be well capitalized.
The following tables set forth the capital position and analysis for the Company and Bank (dollars in thousands). Because total assets on a consolidated basis are less than $3.0 billion, the Company is not subject to the consolidated capital requirements imposed by federal regulations. However, the Company elects to include those ratios for this report. Minimum capital ratios below include phase-in of the capital conservation buffer. The
F-54
Table of Contents
Company has a borrowing from a correspondent bank which it uses to downstream capital to the Bank. At December 31, 2023 and 2022, the outstanding balance was $5.0 million.
| Actual |
Minimum Capital Requirement |
Minimum To Be Well Capitalized Under Prompt Corrective Action Provisions |
||||||||||||||||||||||
| December 31, 2023 | Amount | Ratio | Amount | Ratio | Amount | Ratio | ||||||||||||||||||
| Total Risk-Based Capital | ||||||||||||||||||||||||
| Company |
$ | 99,669 | 24.26 | % | N/A | N/A | N/A | N/A | ||||||||||||||||
| Bank |
$ | 104,523 | 25.44 | % | $ | 43,140 | 10.50 | % | $ | 41,086 | 10.00 | % | ||||||||||||
| Tier 1 Risk-Based Capital |
||||||||||||||||||||||||
| Company |
$ | 95,002 | 23.12 | % | N/A | N/A | N/A | N/A | ||||||||||||||||
| Bank |
$ | 99,856 | 24.30 | % | $ | 34,923 | 8.50 | % | $ | 32,869 | 8.00 | % | ||||||||||||
| Common Equity Tier 1 Capital |
||||||||||||||||||||||||
| Company |
$ | 95,002 | 23.12 | % | N/A | N/A | N/A | N/A | ||||||||||||||||
| Bank |
$ | 99,856 | 24.30 | % | $ | 28,760 | 7.00 | % | $ | 26,706 | 6.50 | % | ||||||||||||
| Tier 1 Leverage Ratio |
||||||||||||||||||||||||
| Company |
$ | 95,002 | 8.77 | % | N/A | N/A | N/A | N/A | ||||||||||||||||
| Bank |
$ | 99,856 | 9.21 | % | $ | 43,347 | 4.00 | % | $ | 54,183 | 5.00 | % | ||||||||||||
| Actual |
Minimum Capital Requirement |
Minimum To Be Well Capitalized Under Prompt Corrective Action Provisions |
||||||||||||||||||||||
| December 31, 2022 | Amount | Ratio | Amount | Ratio | Amount | Ratio | ||||||||||||||||||
| Total Risk-Based Capital | ||||||||||||||||||||||||
| Company |
$ | 90,912 | 20.36 | % | N/A | N/A | N/A | N/A | ||||||||||||||||
| Bank |
$ | 95,856 | 21.46 | % | $ | 46,894 | 10.50 | % | $ | 44,661 | 10.00 | % | ||||||||||||
| Tier 1 Risk-Based Capital |
||||||||||||||||||||||||
| Company |
$ | 86,430 | 19.35 | % | N/A | N/A | N/A | N/A | ||||||||||||||||
| Bank |
$ | 91,374 | 20.46 | % | $ | 37,962 | 8.50 | % | $ | 35,729 | 8.00 | % | ||||||||||||
| Common Equity Tier 1 Capital |
||||||||||||||||||||||||
| Company |
$ | 86,430 | 19.35 | % | N/A | N/A | N/A | N/A | ||||||||||||||||
| Bank |
$ | 91,374 | 20.46 | % | $ | 31,263 | 7.00 | % | $ | 29,030 | 6.50 | % | ||||||||||||
| Tier 1 Leverage Ratio |
||||||||||||||||||||||||
| Company |
$ | 86,430 | 7.64 | % | N/A | N/A | N/A | N/A | ||||||||||||||||
| Bank |
$ | 91,374 | 8.08 | % | $ | 45,251 | 4.00 | % | $ | 56,564 | 5.00 | % | ||||||||||||
The Companys principal source of funds for dividend payments is dividends received from the Bank. Banking regulations limit the amount of dividends that may be paid without prior approval of regulatory agencies. As of December 31, 2023 approximately $24.6 million of retained earnings was available for dividend declaration without regulatory approval.
Note 11. Employee Benefit Plans
401(k) Plan
The Company has a 401(k) Plan whereby substantially all employees participate in the plan. Employees may contribute portions of their compensation subject to limits based on federal tax laws. The Company may make discretionary matching contributions to the plan. For 2023 and 2022, expense attributable to the plan amounted to $401 thousand and $373 thousand, respectively. The 401(k) expense is reported as salaries and employee benefits on the consolidated statements of income.
F-55
Table of Contents
Deferred Compensation Plan
The Company has a deferred compensation plan whereby awarded participants are entitled to receive an amount in cash that is equivalent to the increase in retained earnings per share under the provisions of the plan, with a vesting period extending over seven years. At December 31, 2023 and 2022, an accrued liability for the plan obligation was $1.9 million and $1.4 million, respectively. For 2023 and 2022, the expense attributable to the plan amounted to $631 thousand and $545 thousand, respectively. The liability is reflected in accrued expenses and other liabilities on the consolidated balance sheet and the expense is reported as salaries and employee benefits on the consolidated statements of income.
Note 12. Fair Value Measurements
Determination of Fair Value
Fair value is defined as the exchange price that would be received for an asset or paid to transfer a liability (an exit price) in the principal or most advantageous market for the asset or liability in an orderly transaction between market participants on the measurement date. The fair value measurements and disclosure topic specifies a hierarchy of valuation techniques based on whether the inputs to these valuation techniques are observable or unobservable. Observable inputs reflect market data obtained from independent sources, while unobservable inputs reflect the Companys market assumptions. U.S. GAAP requires that valuation techniques maximize the use of observable inputs and minimize the use of unobservable inputs.
Fair Value Hierarchy
U.S. GAAP establishes a fair value hierarchy which categorizes the valuation inputs into three broad levels. Based on the underlying inputs, each fair value measurement in its entirety is reported in one of the three levels. These levels are:
Level 1Valuation is based on quoted prices in active markets for identical assets and liabilities that the reporting entity has the ability to access at the measurement date. Level 1 assets and liabilities generally include debt and equity securities that are traded in an active exchange market. Valuations are obtained from readily available pricing sources for market transactions involving identical assets or liabilities.
Level 2Valuation is based on inputs other than quoted prices included within Level 1 that are observable for the asset or liability, either directly or indirectly. The valuation may be based on quoted prices for similar assets or liabilities; quoted prices in markets that are not active; or other inputs that are observable or can be corroborated by observable market data for substantially the full term of the asset or liability.
Level 3Valuation is based on unobservable inputs that are supported by little or no market activity and that are significant to the fair value of the assets or liabilities. Level 3 assets and liabilities include financial instruments whose value is determined using pricing models, discounted cash flow methodologies, or similar techniques, as well as instruments for which determination of fair value requires significant management judgment or estimation.
An asset or liabilitys categorization within the valuation hierarchy is based upon the lowest level of input that is significant to the fair value measurement.
Assets and Liabilities Measured at Fair Value on a Recurring Basis
The following describes the valuation techniques used by the Company to measure certain financial assets and liabilities recorded at fair value on a recurring basis in the financial statements:
Securities Available for Sale & Equity Securities
Debt securities available for sale and equity securities are recorded at fair value on a recurring basis. Fair value measurement is based upon quoted market prices, when available (Level 1). If quoted market prices are not
F-56
Table of Contents
available, fair values are measured utilizing independent valuation techniques of identical or similar securities for which significant assumptions are derived primarily from or corroborated by observable market data (Level 2). If the inputs used to provide the evaluation for certain securities are unobservable and/or there is little, if any, market activity then the security would fall to the lowest level of the hierarchy (Level 3).
The Companys investment portfolio is valued using fair value measurements that are considered to be Level 1 or Level 2, but may also use Level 3 measurements if required by the composition of the portfolio. The Bank has contracted with a securities portfolio accounting service provider for valuation of its securities portfolio. Most security types are priced using the securities accounting providers internally developed pricing software which appraises securities from an online real-time database. Subscription pricing services such as ICE Data Services and Bloomberg Valuation Services may be used to supplement the internal pricing system for security types where the underlying collateral, cash flow projections or trade data is not readily available. If Level 1 or Level 2 inputs are not available, the software may rely upon a discounted cash flow analysis based on the net present value of a securitys projected cash flow to arrive at fair market value. Valuations for direct obligations of the U.S. Treasury, exchange listed stock and preferred stock are obtained from on-line real-time databases.
The securities accounting service provider utilizes proprietary valuation matrices for valuing all municipal securities. The initial curves for determining the price, movement, and yield relationships within the municipal matrices are derived from industry benchmark curves or sourced from a municipal trading desk. The securities are further broken down according to issuer, credit support, state of issuance and rating to incorporate additional spreads to the industry benchmark curves.
The following table presents the balances of financial assets measured at fair value on a recurring basis (dollars in thousands):
| Balances | Fair Value Measurements Using | |||||||||||||||
| Financial Assets |
Level 1 | Level 2 | Level 3 | |||||||||||||
| As of December 31, 2023: |
||||||||||||||||
| Available for sale securities: |
||||||||||||||||
| U.S. government and federal agencies |
$ | 92,298 | $ | 78,817 | $ | 13,481 | $ | | ||||||||
| Mortgage backed securities |
8,649 | | 8,649 | | ||||||||||||
| Corporate bonds |
55,471 | 475 | 54,996 | | ||||||||||||
| State and municipal securities |
101,696 | | 101,696 | | ||||||||||||
|
|
|
|
|
|
|
|
|
|||||||||
| Total available for sale securities |
$ | 258,114 | $ | 79,292 | $ | 178,822 | $ | | ||||||||
| Mutual and exchange-traded funds |
505 | 505 | | | ||||||||||||
|
|
|
|
|
|
|
|
|
|||||||||
| Total |
$ | 258,619 | $ | 79,797 | $ | 178,822 | $ | | ||||||||
|
|
|
|
|
|
|
|
|
|||||||||
| As of December 31, 2022: |
||||||||||||||||
| Available for sale securities: |
||||||||||||||||
| U.S. government and federal agencies |
$ | 99,402 | $ | 83,506 | $ | 15,896 | $ | | ||||||||
| Mortgage backed securities |
10,631 | | 10,631 | | ||||||||||||
| Corporate bonds |
62,632 | 468 | 62,164 | | ||||||||||||
| State and municipal securities |
106,931 | | 106,931 | | ||||||||||||
|
|
|
|
|
|
|
|
|
|||||||||
| Total available for sale securities |
$ | 279,596 | $ | 83,974 | $ | 195,622 | $ | | ||||||||
| Mutual and exchange-traded funds |
486 | 486 | | | ||||||||||||
|
|
|
|
|
|
|
|
|
|||||||||
| Total |
$ | 280,082 | $ | 84,460 | $ | 195,622 | $ | | ||||||||
|
|
|
|
|
|
|
|
|
|||||||||
F-57
Table of Contents
Assets Measured at Fair Value on a Non-recurring Basis
Certain assets are measured at fair value on a nonrecurring basis in accordance with generally accepted accounting principles. Adjustments to the fair value of these assets usually result from the application of lower-of-cost-or-market accounting or write-downs of individual assets.
Collateral Dependent Loans
Upon the adoption of CECL, individually evaluated loans are analyzed to determine whether they are collateral dependent. Any individually evaluated loans, which are deemed to be collateral dependent, with an allocation to the ACL are measured at fair value on a non-recurring basis. Any fair value adjustments are recorded in the period incurred as provision for credit losses on the consolidated statements of income. Prior to adoption of CECL and ASU 2022-02, which eliminated the TDR accounting model, loans were designated as impaired when, in the judgment of management and based on current information and events, it was probable that all amounts due, according to the contractual terms of the loan agreement, would not be collected.
The measurement of loss associated with collateral dependent loans can be based on either the observable market price of the loan or fair value of the collateral. Fair value is measured based on the value of the collateral securing the loans. Collateral may be in the form of real estate or business assets including equipment, inventory, and accounts receivable. The vast majority of the collateral is real estate. The value of real estate collateral is determined utilizing a market valuation approach based on an appraisal conducted by an independent, licensed appraiser outside of the Company using observable market data (Level 2). However, if the collateral is a house or building in the process of construction or if an appraisal of the real estate property using an income approach or is over two years old, then the fair value is considered Level 3. The value of business equipment is based upon an outside appraisal if deemed significant, or the net book value on the applicable businesss financial statements if not considered significant using observable market data. Likewise, values for inventory and accounts receivables collateral are based on financial statement balances or aging reports (Level 3). Any fair value adjustments are recorded in the period incurred as a provision for loan credit losses on the consolidated statements of income. There were no collateral dependent loans with a recorded reserve as of December 31, 2023 and 2022.
Other Real Estate Owned
Other real estate owned (OREO) is measured at fair value less costs to sell. Valuation of OREO is determined using current appraisals from independent parties, a Level 2 input. If current appraisals cannot be obtained, or if declines in value are identified after a recent appraisal is received, appraisal values may be discounted, resulting in a Level 3 estimate. If the Company markets the property with a realtor, estimated selling costs reduce the fair value, resulting in a valuation based on Level 3 inputs. Fair value adjustments are recorded in the period incurred and expensed against current earnings. The Bank held no OREO at December 31, 2023 or 2022.
There were no assets measured at fair value on a nonrecurring basis at December 31, 2023 or 2022.
F-58
Table of Contents
Fair Value of Financial Instruments
The following tables present the carrying value and estimated fair value including the level within the fair value hierarchy of the Companys financial instruments as of December 31, 2023 and 2022 (dollars in thousands):
|
Carrying Amount |
Fair Value Measurements Using |
Total Fair Value |
||||||||||||||||||
| Level 1 | Level 2 | Level 3 | ||||||||||||||||||
| As of December 31, 2023: |
||||||||||||||||||||
| Financial assets: |
||||||||||||||||||||
| Cash and due from banks |
$ | 316,767 | $ | 316,767 | $ | | $ | | $ | 316,767 | ||||||||||
| Securities available for sale |
258,114 | 79,292 | 178,822 | | 258,114 | |||||||||||||||
| Securities held to maturity |
308,058 | 106,837 | 177,079 | | 283,916 | |||||||||||||||
| Equity securities |
505 | 505 | | | 505 | |||||||||||||||
| Restricted securities |
2,613 | | 2,613 | | 2,613 | |||||||||||||||
| Loans, net |
299,825 | | | 280,352 | 280,352 | |||||||||||||||
| Accrued Interest Receivable |
4,354 | | 4,354 | | 4,354 | |||||||||||||||
| Financial liabilities: |
||||||||||||||||||||
| Demand and savings deposits |
$ | 1,095,283 | $ | | $ | 766,933 | $ | 299,765 | $ | 1,066,698 | ||||||||||
| Time deposits |
16,742 | | | 16,600 | 16,600 | |||||||||||||||
| Short term borrowings |
5,000 | | 5,000 | | 5,000 | |||||||||||||||
| Accrued interest payable |
61 | | 61 | | 61 | |||||||||||||||
| As of December 31, 2022: |
||||||||||||||||||||
| Financial assets: |
||||||||||||||||||||
| Cash and due from banks |
$ | 98,663 | $ | 98,663 | $ | | $ | | $ | 98,663 | ||||||||||
| Securities available for sale |
279,596 | 83,974 | 195,622 | | 279,596 | |||||||||||||||
| Securities held to maturity |
312,567 | 104,415 | 174,469 | | 278,884 | |||||||||||||||
| Equity securities |
486 | 486 | | | 486 | |||||||||||||||
| Restricted securities |
2,501 | | 2,501 | | 2,501 | |||||||||||||||
| Loans, net |
315,711 | | | 295,516 | 295,516 | |||||||||||||||
| Accrued Interest Receivable |
4,313 | | 4,313 | | 4,313 | |||||||||||||||
| Financial liabilities: |
||||||||||||||||||||
| Demand and savings deposits |
$ | 940,381 | $ | | $ | 666,493 | $ | 240,803 | $ | 907,296 | ||||||||||
| Time deposits |
12,573 | | | 12,110 | 12,110 | |||||||||||||||
| Short term borrowings |
5,000 | | 5,000 | | 5,000 | |||||||||||||||
| Accrued interest payable |
20 | | 20 | | 20 | |||||||||||||||
F-59
Table of Contents
Note 13. Accumulated Other Comprehensive Income (Loss)
The following table presents the changes in each component in accumulated other comprehensive income (loss), net of tax for the years ended December 31, 2023 and 2022 (dollars in thousands):
|
Unrealized Gain (Loss) on Available for Sale Securities |
Unrealized Gain (Loss) on Securities Transferred from Available for Sale to Held to Maturity |
Accumulated Other Comprehensive Income (Loss) |
||||||||||
| Balance at December 31, 2021 |
$ | 1,850 | $ | | $ | 1,850 | ||||||
| Unrealized holding losses, net of tax of ($5,381) |
(14,985 | ) | (5,257 | ) | (20,242 | ) | ||||||
| Amortization of unrealized holding losses, net of tax of $198 |
| 744 | 744 | |||||||||
|
|
|
|
|
|
|
|||||||
| Balance at December 31, 2022 |
$ | (13,135 | ) | $ | (4,513 | ) | $ | (17,648 | ) | |||
|
|
|
|
|
|
|
|||||||
| Unrealized holding gains, net of tax of $1,302 |
4,897 | | 4,897 | |||||||||
| Amortization of unrealized holding losses, net of tax of $234 |
| 879 | 879 | |||||||||
| Reclassification adjustment, net of tax of $82 |
307 | | 307 | |||||||||
|
|
|
|
|
|
|
|||||||
| Balance at December 31, 2023 |
$ | (7,931 | ) | $ | (3,634 | ) | $ | (11,565 | ) | |||
|
|
|
|
|
|
|
|||||||
The following table presents the amounts reclassified out of accumulated other comprehensive income (loss), net of tax for the years ended December 31, 2023 and 2022 (dollars in thousands):
| December 31, 2023 |
Line Item in the Consolidated Statements of Income |
|||||
| Securities available for sale |
||||||
| Net securities loss reclassified into earnings |
$ | (389 | ) | Net losses on sales of available for sale securities | ||
| Related income tax benefit expense |
82 | Income tax expense | ||||
|
|
|
|||||
| Total reclassifications into net income |
$ | (307 | ) | Net of tax | ||
|
|
|
|||||
Note 14. Condensed Financial Statements of Parent Company
Financial information pertaining only to Chain Bridge Bancorp, Inc. is as follows (dollars in thousands):
| December 31, | ||||||||
| Balance Sheets | 2023 | 2022 | ||||||
| Assets |
||||||||
| Cash |
$ | 43 | $ | 97 | ||||
| Receivable from subsidiary |
103 | | ||||||
| Investment in common stock of Chain Bridge Bank, N.A. |
88,291 | 73,727 | ||||||
|
|
|
|
|
|||||
| Total assets |
$ | 88,437 | $ | 73,824 | ||||
|
|
|
|
|
|||||
| Liabilities and Shockholders Equity |
||||||||
| Short-term borrowings |
$ | 5,000 | $ | 5,000 | ||||
| Accrued expenses |
| 41 | ||||||
|
|
|
|
|
|||||
| Total liabilities |
5,000 | 5,041 | ||||||
|
|
|
|
|
|||||
| Stockholders equity |
83,437 | 68,783 | ||||||
|
|
|
|
|
|||||
| Total liabilities and stockholders equity |
$ | 88,437 | $ | 73,824 | ||||
|
|
|
|
|
|||||
F-60
Table of Contents
| Statements of Income | 2023 | 2022 | ||||||
| Dividend from Chain Bridge Bank, N.A. |
$ | 480 | $ | 115 | ||||
|
|
|
|
|
|||||
| Operating Expenses |
||||||||
| Interest expense and fees on short-term borrowings |
423 | 221 | ||||||
| Professional services |
30 | 300 | ||||||
| Marketing expenses |
40 | 40 | ||||||
| Other expenses |
1 | | ||||||
|
|
|
|
|
|||||
| Total operating expenses |
494 | 561 | ||||||
|
|
|
|
|
|||||
| Loss before allocated tax expense and undistributed net income of Chain Bridge Bank, N.A. |
(14 | ) | (446 | ) | ||||
| Income tax benefit |
(104 | ) | | |||||
| Undistributed net income of Chain Bridge Bank, N.A. |
8,741 | 8,727 | ||||||
|
|
|
|
|
|||||
| Net income |
$ | 8,831 | $ | 8,281 | ||||
|
|
|
|
|
|||||
| Statements of Cash Flows | 2023 | 2022 | ||||||
| Cash Flows from Operating Activities |
||||||||
| Net income |
$ | 8,831 | $ | 8,281 | ||||
| Adjustments to reconcile net income to net cash used in operating activities: |
||||||||
| Undistributed net income of Chain Bridge Bank, N.A. |
(8,741 | ) | (8,727 | ) | ||||
| Increase in receivable from subsidiary |
(103 | ) | | |||||
| (Decrease) Increase in accrued expenses |
(41 | ) | 41 | |||||
|
|
|
|
|
|||||
| Net cash used in operating activities |
(54 | ) | (405 | ) | ||||
|
|
|
|
|
|||||
| Cash Flows from Investing Activities |
||||||||
| Investment in Chain Bridge Bank, N.A. |
| (10,000 | ) | |||||
|
|
|
|
|
|||||
| Net cash used in investing activities |
| (10,000 | ) | |||||
|
|
|
|
|
|||||
| Cash Flows from Financing Activities |
||||||||
| Net proceeds from common stock issued |
| 10,500 | ||||||
|
|
|
|
|
|||||
| Net cash provided by financing activities |
| 10,500 | ||||||
|
|
|
|
|
|||||
| Net (decrease) increase in cash and cash equivalents |
(54 | ) | 95 | |||||
| Cash and cash equivalents at beginning of period |
97 | 2 | ||||||
|
|
|
|
|
|||||
| Cash and cash equivalents at end of period |
$ | 43 | $ | 97 | ||||
|
|
|
|
|
|||||
Note 15. Subsequent Events
The Company evaluates subsequent events that have occurred after the balance sheet date but before the financial statements are issued. There are two types of subsequent events: (1) recognized, or those that provide additional evidence about conditions that existed at the date of the balance sheet, including the estimates inherent in the process of preparing financial statements, and (2) non-recognized, or those that provide evidence about conditions that did not exist at the date of the balance sheet but arose after that date. The Company evaluated subsequent events through March 22, 2024.
The Company did not identify any subsequent events that would have required adjustment to or disclosure in the financial statements.
F-61
Table of Contents
Shares
Chain Bridge Bancorp, Inc.
Class A Common Stock

PROSPECTUS
Piper Sandler
Raymond James
Hovde
, 2024
Table of Contents
PART II
INFORMATION NOT REQUIRED IN PROSPECTUS
Item 13. Other Expenses of Issuance and Distribution.
The following table sets forth the expenses payable by the Registrant expected to be incurred in connection with the issuance and distribution of the shares of common stock being registered hereby (other than underwriting discounts and commissions). All of such expenses are estimates, other than the filing and listing fees payable to the Securities and Exchange Commission, the Financial Industry Regulatory Authority, Inc., the NYSE listing fee and .
| Filing FeeSecurities and Exchange Commission |
$ | * | ||
| FeeFinancial Industry Regulatory Authority, Inc. |
* | |||
| Listing FeeNYSE |
* | |||
| Fees of Transfer Agent |
* | |||
| Fees and Expenses of Counsel |
* | |||
| Fees and Expenses of Accountants |
* | |||
| Printing Expenses |
* | |||
| Miscellaneous Expenses |
* | |||
|
|
|
|||
| Total |
$ | * | ||
|
|
|
| * | To be provided by amendment. |
Item 14. Indemnification of Directors and Officers.
Section 102(b)(7) of the DGCL allows a corporation to provide in its certificate of incorporation that a director of the corporation will not be personally liable to the corporation or its stockholders for monetary damages for breach of fiduciary duty as a director, except where the director breached the duty of loyalty, failed to act in good faith, engaged in intentional misconduct or knowingly violated a law, authorized the payment of a dividend or approved a stock repurchase or redemption in violation of Delaware corporate law or obtained an improper personal benefit. Our Charter will provide for this limitation of liability.
Section 145 of the DGCL (Section 145) provides, among other things, that a Delaware corporation may indemnify any person who was, is or is threatened to be made, party to any threatened, pending or completed action, suit or proceeding, whether civil, criminal, administrative or investigative (other than an action by or in the right of such corporation), by reason of the fact that such person is or was an officer, director, employee or agent of such corporation or is or was serving at the request of such corporation as a director, officer, employee or agent of another corporation or enterprise against expenses (including attorneys fees), judgments, fines and amounts paid in settlement actually and reasonably incurred by such person in connection with such action, suit or proceeding, provided such person acted in good faith and in a manner he or she reasonably believed to be in or not opposed to the corporations best interests and, with respect to any criminal action or proceeding, had no reasonable cause to believe that his or her conduct was illegal. A Delaware corporation may indemnify any persons who were or are a party to any threatened, pending or completed action or suit by or in the right of the corporation by reason of the fact that such person is or was a director, officer, employee or agent of another corporation or enterprise against expenses (including attorneys fees) actually and reasonably incurred by such person in connection with the defense or settlement of such action or suit, provided such person acted in good faith and in a manner he or she reasonably believed to be in or not opposed to the corporations best interests; provided, further, that no indemnification is permitted without judicial approval if the officer, director, employee or agent is adjudged to be liable to the corporation. Where an officer or director is successful on the merits or otherwise in the defense of any action referred to above, the corporation must indemnify him or her against the expenses such officer or director has actually and reasonably incurred.
II-1
Table of Contents
Section 145 also provides that the expenses incurred by a director, officer, employee or agent of the corporation or a person serving at the request of the corporation as a director, officer, employee or agent of another corporation or enterprise in defending any action, suit or proceeding may be paid in advance of the final disposition of the action, suit or proceeding, subject, in the case of current officers and directors, to the corporations receipt of an undertaking by or on behalf of such officer or director to repay the amount so advanced if it shall be ultimately determined that such person is not entitled to be indemnified.
Section 145 further authorizes a corporation to purchase and maintain insurance on behalf of any person who is or was a director, officer, employee or agent of the corporation or is or was serving at the request of the corporation as a director, officer, employee or agent of another corporation or enterprise, against any liability asserted against such person and incurred by such person in any such capacity, or arising out of his or her status as such, whether or not the corporation would otherwise have the power to indemnify him or her under Section 145.
Our Bylaws will provide that we must indemnify our directors and officers to the fullest extent authorized by the DGCL; provided, however, that no such indemnification shall be required with respect to any settlement or other non-adjudicated disposition of any threatened or pending action or proceeding unless we have given our prior consent to such settlement or other disposition.
Our Bylaws will also provide that we may advance or promptly reimburse upon request any person entitled to indemnification hereunder for all expenses, including attorneys fees, reasonably incurred in defending any action or proceeding in advance of the final disposition thereof upon receipt of an undertaking by or on behalf of such person to repay such amount if such person is ultimately found not to be entitled to indemnification or, where indemnification is granted, to the extent the expenses so advanced or reimbursed exceed the amount to which such person is entitled; provided, however, that such person shall cooperate in good faith with any request by us that common counsel be utilized by the parties to an action or proceeding who are similarly situated unless to do so would be inappropriate due to actual or potential differing interests between or among such parties.
The indemnification rights set forth above shall not be exclusive of any other right which an indemnified person may have or hereafter acquire under any statute, provision of our Charter, our Bylaws, agreement, vote of stockholders or disinterested directors or otherwise.
We expect to maintain standard policies of insurance that provide coverage (1) to our directors and officers against loss arising from claims made by reason of breach of duty or other wrongful act and (2) to us with respect to indemnification payments that we may make to such directors and officers.
The proposed form of Underwriting Agreement to be filed as Exhibit 1.1 to this Registration Statement provides for indemnification to our directors and officers by the underwriters against certain liabilities.
Item 15. Recent Sales of Unregistered Securities.
Set forth below is information regarding securities sold or granted by us since June, 2021 that were not registered under the Securities Act. Also included is the consideration, if any, received by us for such securities and information relating to the section of the Securities Act, or rules of the Securities and Exchange Commission, under which exemption from registration was claimed for such sales and grants.
From March to May 2022, we sold an aggregate of 3,500 shares of old common stock at a purchase price of $3,000.00 per share to 97 investors, of which 91 were accredited investors and 6 were non-accredited investors, for an aggregate purchase price of $10.5 million. The sale of old common stock was deemed to be exempt from registration under the Securities Act in reliance upon Rule 506(b) of Regulation D.
In February 2024, we sold an aggregate of four shares of old common stock at a purchase price of $3,104.98 per share to four of our newly-appointed directors for an aggregate purchase price of $12.42 thousand. The sale of old common stock was deemed to be exempt from registration under the Securities Act in reliance upon Section 4(a)(2) of the Securities Act.
II-2
Table of Contents
The foregoing sale of old common stock did not involve any underwriters, underwriting discounts or commissions or any public offering, and the registrant believes such sale was exempt from the registration requirements of the Securities Act as stated above. All recipients of the foregoing transactions either received adequate information about the registrant or had access, through their relationships with the registrant, to such information. Furthermore, the registrant affixed appropriate legends to the share certificates and instruments issued in each foregoing transaction setting forth that the securities had not been registered and the applicable restrictions on transfer.
Item 16. Exhibits and Financial Statement Schedules.
(a) Exhibits. See the Exhibit Index immediately preceding the signature pages hereto, which is incorporated by reference as if fully set forth herein.
(b) Financial Statement Schedules. All schedules are omitted because the required information is inapplicable or the information is presented in the consolidated financial statements and the related notes.
Item 17. Undertakings
| (1) | Insofar as indemnification for liabilities arising under the Securities Act may be permitted to directors, officers and controlling persons of the registrant pursuant to the foregoing provisions, or otherwise, the registrant has been advised that in the opinion of the Securities and Exchange Commission such indemnification is against public policy as expressed in the Securities Act and is, therefore, unenforceable. In the event that a claim for indemnification against such liabilities (other than the payment by the registrant of expenses incurred or paid by a director, officer or controlling person of the registrant in the successful defense of any action, suit or proceeding) is asserted by such director, officer or controlling person in connection with the securities being registered, the registrant will, unless in the opinion of its counsel the matter has been settled by controlling precedent, submit to a court of appropriate jurisdiction the question of whether such indemnification by it is against public policy as expressed in the Securities Act and will be governed by the final adjudication of such issue. |
| (2) | The undersigned registrant hereby undertakes that: |
| (A) | For purposes of determining any liability under the Securities Act, the information omitted from the form of prospectus filed as part of this registration statement in reliance upon Rule 430A and contained in a form of prospectus filed by the registrant pursuant to Rule 424(b)(1) or (4) or 497(h) under the Securities Act shall be deemed to be part of this registration statement as of the time it was declared effective. |
| (B) | For the purpose of determining any liability under the Securities Act, each post-effective amendment that contains a form of prospectus shall be deemed to be a new registration statement relating to the securities offered therein, and the offering of such securities at that time shall be deemed to be the initial bona fide offering thereof. |
II-3
Table of Contents
EXHIBIT INDEX
| Number | Description |
|
| 1.1 | Form of Underwriting Agreement.* | |
| 3.1 | Form of Amended and Restated Certificate of Incorporation, to be in effect upon the completion of this offering. | |
| 3.2 | Form of Amended and Restated Bylaws, to be in effect upon the completion of this offering.* | |
| 5.1 | Opinion of Sullivan & Cromwell LLP.* | |
| 10.1 | Short-Term Cash Incentive Compensation Plan.* | |
| 10.2 | Long-Term Cash Incentive Plan.* | |
| 21.1 | Subsidiaries of the Registrant.* | |
| 23.1 | Consent of Yount, Hyde & Barbour, P.C., Independent Registered Public Accounting Firm.* | |
| 23.2 | Consent of Sullivan & Cromwell LLP (included as part of Exhibit 5.1).* | |
| 24.1 | Powers of Attorney (included on signature page to the Registration Statement).* | |
| 107.1 | Filing Fee Table.* | |
| * | To be filed by amendment. |
II-4
Table of Contents
Pursuant to the requirements of the Securities Act of 1933, as amended, the Registrant has duly caused this Registration Statement on Form S-1 to be signed on its behalf by the undersigned, thereunto duly authorized, in the City of McLean, Virginia, on the day of , 2024.
| CHAIN BRIDGE BANCORP, INC. | ||
| By: | ||
| Name: | ||
| Title: | ||
POWERS OF ATTORNEY
Each person whose signature appears below hereby constitutes and appoints and , and each of them, any of whom may act without joinder of the other, the individuals true and lawful attorneys-in-fact and agents, with full power of substitution and resubstitution, for the person and in his or her name, place and stead, in any and all capacities, to sign this Registration Statement and any or all amendments, including post-effective amendments to the Registration Statement, including a prospectus or an amended prospectus therein and any Registration Statement for the same offering that is to be effective upon filing pursuant to Rule 462 under the Securities Act, and all other documents in connection therewith to be filed with the Securities and Exchange Commission, granting unto said attorneys-in-fact and agents, and each of them, full power and authority to do and perform each and every act and thing requisite and necessary to be done in and about the premises, as fully to all intents and purposes as he or she might or could do in person, hereby ratifying and confirming all that said attorneys-in-fact as agents or any of them, or their substitute or substitutes, may lawfully do or cause to be done by virtue hereof.
Pursuant to the requirements of the Securities Act of 1933, as amended, this Registration Statement and Power of Attorney have been signed by the following persons in the capacities indicated on the day of , 2024.
| Signature |
Title |
|
|
John J. Brough |
Chief Executive Officer and Director (Principal Executive Officer) |
|
|
Joanna R. Williamson |
Chief Financial Officer (Principal Financial Officer and Principal Accounting Officer) |
|
|
Peter G. Fitzgerald |
Director |
|
|
Mark Martinelli |
Director |
|
|
Yonesy F. Núñez |
Director |
|
|
Michael J. Conover |
Director |
|
II-5
Table of Contents
| Signature |
Title |
|
|
Leigh-Alexandra Basha |
Director |
|
|
David M. Evinger |
Director |
|
|
Thomas G. Fitzgerald, Jr. |
Director |
|
|
Andrew J. Fitzgerald |
Director |
|
|
Joseph M. Fitzgerald |
Director |
|
|
Michelle L. Korsmo |
Director |
|
|
Benita Thompson-Byas |
Director |
|
|
Paul W. Leavitt |
Director |
|
II-6